Tag Archive: Fiji Islands


Earthquakes

USGS

MAG UTC DATE-TIME
y/m/d h:m:s
LAT
deg
LON
deg
DEPTH
km
 Region
MAP  4.5   2012/10/26 23:16:47   38.959   22.937 16.7  GREECE
MAP  4.5   2012/10/26 22:31:18   38.260   46.780 10.0  NORTHWESTERN IRAN
MAP  5.0   2012/10/26 21:38:19  -11.569   165.470 34.1  SANTA CRUZ ISLANDS
MAP  4.9   2012/10/26 21:11:57   10.667   126.806 35.0  PHILIPPINE ISLANDS REGION
MAP  4.7   2012/10/26 19:44:36   33.465   133.450 17.0  SHIKOKU, JAPAN
MAP  4.8   2012/10/26 19:33:11   37.690   141.561 61.0  NEAR THE EAST COAST OF HONSHU, JAPAN
MAP  2.8 2012/10/26 19:18:39   19.384  -155.243 3.8  ISLAND OF HAWAII, HAWAII
MAP  2.6 2012/10/26 18:48:13   18.910   -64.522 48.0  VIRGIN ISLANDS REGION
MAP  2.5 2012/10/26 18:31:54   46.260  -119.384 0.0  WASHINGTON
MAP  2.5 2012/10/26 18:04:57   51.499  -178.225 21.5  ANDREANOF ISLANDS, ALEUTIAN IS., ALASKA
MAP  2.5 2012/10/26 17:15:25   35.417  -117.957 2.9  SOUTHERN CALIFORNIA
MAP  3.0 2012/10/26 16:28:48   60.736  -151.633 85.4  KENAI PENINSULA, ALASKA
MAP  3.3 2012/10/26 14:18:20   42.016  -126.835 10.0  OFF THE COAST OF OREGON
MAP  2.7 2012/10/26 12:41:49   19.881  -155.686 16.3  ISLAND OF HAWAII, HAWAII
MAP  2.9 2012/10/26 11:38:34   19.383  -155.245 3.1  ISLAND OF HAWAII, HAWAII
MAP  2.9 2012/10/26 11:38:31   19.386  -155.244 4.1  ISLAND OF HAWAII, HAWAII
MAP  4.6   2012/10/26 10:52:59   43.224   142.871 131.2  HOKKAIDO, JAPAN REGION
MAP  4.7   2012/10/26 10:36:32   38.718   141.990 48.9  NEAR THE EAST COAST OF HONSHU, JAPAN
MAP  3.3 2012/10/26 10:32:52   59.367  -152.218 55.3  SOUTHERN ALASKA
MAP  3.0 2012/10/26 08:40:46   19.383   -64.224 80.0  VIRGIN ISLANDS REGION
MAP  4.8   2012/10/26 06:28:47   -0.364   132.895 43.2  NEAR THE NORTH COAST OF PAPUA, INDONESIA
MAP  2.5 2012/10/26 04:34:59   43.355   -78.634 5.0  NEW YORK
MAP  4.5   2012/10/26 04:24:31  -18.032  -178.574 608.0  FIJI REGION
MAP  2.5 2012/10/26 02:56:53   59.477  -152.370 59.8  SOUTHERN ALASKA
MAP  4.7   2012/10/26 00:33:14   41.046   142.272 59.8  HOKKAIDO, JAPAN REGION
MAP  2.9 2012/10/26 00:10:22   52.389  -174.294 223.1  ANDREANOF ISLANDS, ALEUTIAN IS., ALASKA


MAG UTC DATE-TIME
y/m/d h:m:s
LAT
deg
LON
deg
DEPTH
km
 Region
MAP  4.8   2012/10/27 22:23:15   -6.126   154.350 62.1  BOUGAINVILLE REGION, PAPUA NEW GUINEA
MAP  4.4 2012/10/27 21:17:01   -7.054   123.441 621.9  BANDA SEA
MAP  4.3 2012/10/27 21:10:42   -2.088   126.482 35.0  CERAM SEA, INDONESIA
MAP  4.7   2012/10/27 20:56:46  -16.255  -175.946 355.6  TONGA
MAP  4.9   2012/10/27 20:55:31   18.554   146.531 77.6  PAGAN REGION, NORTHERN MARIANA ISLANDS
MAP  2.6 2012/10/27 20:36:28   51.201  -179.933 30.5  ANDREANOF ISLANDS, ALEUTIAN IS., ALASKA
MAP  5.1   2012/10/27 20:15:00  -21.474   169.833 35.7  SOUTHEAST OF THE LOYALTY ISLANDS
MAP  5.5   2012/10/27 20:13:02   -6.178   151.602 22.7  NEW BRITAIN REGION, PAPUA NEW GUINEA
MAP  2.6 2012/10/27 17:48:08   32.146  -115.206 23.6  BAJA CALIFORNIA, MEXICO
MAP  3.1 2012/10/27 16:53:00   19.619   -63.980 24.0  VIRGIN ISLANDS REGION
MAP  3.2 2012/10/27 16:46:42   18.172   -68.373 93.0  MONA PASSAGE, DOMINICAN REPUBLIC
MAP  4.9   2012/10/27 16:22:10   14.566   -92.195 115.0  CHIAPAS, MEXICO
MAP  3.0 2012/10/27 15:52:14   63.171  -144.328 1.9  CENTRAL ALASKA
MAP  5.2   2012/10/27 15:46:29   10.500   126.823 36.7  PHILIPPINE ISLANDS REGION
MAP  3.5 2012/10/27 15:31:11   52.755  -162.915 35.9  SOUTH OF ALASKA
MAP  4.7   2012/10/27 15:00:47   -2.294   100.628 64.6  KEPULAUAN MENTAWAI REGION, INDONESIA
MAP  4.4 2012/10/27 12:33:05  -33.589   -72.028 23.8  OFFSHORE VALPARAISO, CHILE
MAP  2.7 2012/10/27 12:02:28   62.841  -151.149 111.3  CENTRAL ALASKA
MAP  4.4 2012/10/27 10:51:24   -9.175   111.272 69.2  SOUTH OF JAVA, INDONESIA
MAP  3.3 2012/10/27 10:43:50   17.475   -68.812 83.0  DOMINICAN REPUBLIC REGION
MAP  3.1 2012/10/27 10:32:09   17.414   -68.841 57.0  DOMINICAN REPUBLIC REGION
MAP  4.5   2012/10/27 10:20:59   10.637   126.874 35.1  PHILIPPINE ISLANDS REGION
MAP  5.2   2012/10/27 09:32:31   9.897   57.100 10.0  CARLSBERG RIDGE
MAP  4.2 2012/10/27 08:00:10   36.999   70.494 67.0  HINDU KUSH REGION, AFGHANISTAN
MAP  4.8   2012/10/27 07:02:41  -22.284   179.922 554.8  SOUTH OF THE FIJI ISLANDS
MAP  4.6   2012/10/27 06:37:34   28.502   128.715 35.5  RYUKYU ISLANDS, JAPAN
MAP  2.5 2012/10/27 06:18:51   18.511   -64.789 5.0  VIRGIN ISLANDS REGION
MAP  3.3 2012/10/27 06:07:59   68.491  -147.349 6.0  NORTHERN ALASKA
MAP  4.8   2012/10/27 05:52:18  -10.845   160.919 45.4  SOLOMON ISLANDS
MAP  5.0   2012/10/27 04:06:51   -4.074   140.267 41.6  PAPUA, INDONESIA
MAP  4.3 2012/10/27 03:56:44   38.259   46.633 10.0  NORTHWESTERN IRAN
MAP  2.7 2012/10/27 01:49:15   32.184  -115.220 15.8  BAJA CALIFORNIA, MEXICO
MAP  4.5   2012/10/27 00:49:37  -27.746   -66.615 144.2  CATAMARCA, ARGENTINA
MAP  3.2 2012/10/27 00:34:51   56.972  -158.394 150.9  ALASKA PENINSULA

Panic as magnitude-5 earthquake rattles southern Italy

NBCNewsWorld

Mario Tosti / AFP – Getty Images

People who had been evacuated from a hospital wait in a rescue center in Mormanno, southern Italy, after an earthquake early on Friday.

By NBC News staff and wire reports

ROME — A hospital was evacuated after a magnitude-5 earthquake struck southern Italy early on Friday, authorities said.

The quake hit at 1:05 a.m. local time (7:05 p.m. ET Thursday) about 3.9 miles underground, north of Cosenza in the Pollino mountains area on the border of the southern regions of Calabria and Basilicata, according to data from the Italian Geophysics Institute (INGV).

At least 14 other tremors followed the initial earthquake, according to INGV’s website.

Italian media reported that an elderly man who lived near the tremor’s epicenter had died of a heart attack.

An Italian police official told Reuters a hospital in the small town of Mormanno had been evacuated as a precautionary measure because some cracks were found in its structure.

No injuries were reported, the official said.

Italian news agencies reported scenes of panic in the hospital and said many inhabitants of Mormanno and surrounding towns had come out in the streets.

Police and firefighters were surveying the area for further damage, officials said.

NBC News’ Claudio Lavanga and Reuters contributed to this report.

Scientists convicted of manslaughter for not predicting quake

Magnitude 5 earthquake hits s. Italy, hospital evacuated

By REUTERS

ROME – A magnitude 5 earthquake struck north of Cosenza in southern Italy early on Friday, and police said a hospital had been evacuated after cracks were found in its structure, but there were no reports of injuries.

The quake hit at 1:05 a.m. (2305 GMT on Thursday) about 6.3 km (3.9 miles) underground, north of Cosenza in the Pollino mountains area on the border of the southern regions of Calabria and Basilicata, according to data from the Italian Geophysics Institute (INGV). It said on its website that at least 14 other tremors followed the initial earthquake.

An Italian police official told Reuters a hospital in the small town of Mormanno had been evacuated as a precautionary measure because some cracks were found in its structure.

No injuries were reported, the official said.

AN elderly man died from a heart attack and panic-stricken residents rushed into the streets fearing building collapses when a 5.3-magnitude earthquake struck a southern Italian province.

The 84-year-old victim suffered heart failure when the quake struck the province of Cosenza early on Friday and was dead before emergency services could reach him.

No injuries have been reported but several buildings have been damaged. A local hospital was also evacuated and schools closed as a precautionary measure.

According to the US Geological Survey, the quake, with a 5.3 magnitude at a depth of 3.8km, had its epicentre 6km southeast of Mormanno town in the Calabria region.

“Some plaster fell, a crack appeared in the stairway. We came down in a panic to the streets using our mobile phones for light,” Mormanno bed-and-breakfast owner Giuseppina Capalbi told the Corriere della Sera newspaper.

Many homes in the town centre suffered damage and police said it would take some hours to evaluate the scale of the problem, as local officials decided to close schools.

“There was a lot of panic, but happily there are no injured,” Mormanno mayor Guglielmo Armentano told Ansa.

“In our historic centre, there are some damaged buildings. As a precaution we have evacuated the hospital.”

More than 2200 tremors had struck the same region along the Pollino massif in recent years, but all but a handful were of a magnitude under 3.

Italy frequently falls victim to earthquakes. Among the most devastating was the 6.3-magnitude quake in the central city of L’Aquila that in 2009 killed 309 people and left tens of thousands homeless.

On Monday, six Italian seismologists and a government official were sentenced to six years in jail for multiple manslaughter for underestimating the risk of that earthquake, in a move viewed by some as a dangerous blow to

Related Coverage


LISS – Live Internet Seismic Server

GSN Stations

These data update automatically every 30 minutes. Last update: October 27, 2012 09:19:03 UTC

Seismograms may take several moments to load. Click on a plot to see larger image.

CU/ANWB, Willy Bob, Antigua and Barbuda

 ANWB 24hr plot

CU/BBGH, Gun Hill, Barbados

 BBGH 24hr plot

CU/BCIP, Isla Barro Colorado, Panama

 BCIP 24hr plot

CU/GRGR, Grenville, Grenada

 GRGR 24hr plot

CU/GRTK, Grand Turk, Turks and Caicos Islands

 GRTK 24hr plot

CU/GTBY, Guantanamo Bay, Cuba

 GTBY 24hr plot

CU/MTDJ, Mount Denham, Jamaica

 MTDJ 24hr plot

CU/SDDR, Presa de Sabaneta, Dominican Republic

 SDDR 24hr plot

CU/TGUH, Tegucigalpa, Honduras

 TGUH 24hr plot

IC/BJT, Baijiatuan, Beijing, China

 BJT 24hr plot

IC/ENH, Enshi, China

 ENH 24hr plot

IC/HIA, Hailar, Neimenggu Province, China

 HIA 24hr plot

IC/LSA, Lhasa, China

 LSA 24hr plot

IC/MDJ, Mudanjiang, China

 MDJ 24hr plot

IC/QIZ, Qiongzhong, Guangduong Province, China

 QIZ 24hr plot

IU/ADK, Aleutian Islands, Alaska, USA

 ADK 24hr plot

IU/AFI, Afiamalu, Samoa

 AFI 24hr plot

IU/ANMO, Albuquerque, New Mexico, USA

 ANMO 24hr plot

IU/ANTO, Ankara, Turkey

 ANTO 24hr plot

IU/BBSR, Bermuda

 BBSR 24hr plot

IU/BILL, Bilibino, Russia

 BILL 24hr plot

IU/CASY, Casey, Antarctica

 CASY 24hr plot

IU/CCM, Cathedral Cave, Missouri, USA

 CCM 24hr plot

IU/CHTO, Chiang Mai, Thailand

 CHTO 24hr plot

IU/COLA, College Outpost, Alaska, USA

 COLA 24hr plot

IU/COR, Corvallis, Oregon, USA

 COR 24hr plot

IU/CTAO, Charters Towers, Australia

 CTAO 24hr plot

IU/DAV,Davao, Philippines

 DAV 24hr plot

IU/DWPF,Disney Wilderness Preserve, Florida, USA

 DWPF 24hr plot

IU/FUNA,Funafuti, Tuvalu

 FUNA 24hr plot

IU/FURI, Mt. Furi, Ethiopia

 FURI 24hr plot

IU/GNI, Garni, Armenia

 GNI 24hr plot

IU/GRFO, Grafenberg, Germany

 GRFO 24hr plot

IU/GUMO, Guam, Mariana Islands

 GUMO 24hr plot

IU/HKT, Hockley, Texas, USA

 HKT 24hr plot

IU/HNR, Honiara, Solomon Islands

 HNR 24hr plot

IU/HRV, Adam Dziewonski Observatory (Oak Ridge), Massachusetts, USA

 HRV 24hr plot

IU/INCN, Inchon, Republic of Korea

 INCN 24hr plot

IU/JOHN, Johnston Island, Pacific Ocean

 JOHN 24hr plot

IU/KBS, Ny-Alesund, Spitzbergen, Norway

 KBS 24hr plot

IU/KEV, Kevo, Finland

 KEV 24hr plot

IU/KIEV, Kiev, Ukraine

 KIEV 24hr plot

IU/KIP, Kipapa, Hawaii, USA

 KIP 24hr plot

IU/KMBO, Kilima Mbogo, Kenya

 KMBO 24hr plot

IU/KNTN, Kanton Island, Kiribati

 KNTN 24hr plot

IU/KONO, Kongsberg, Norway

 KONO 24hr plot

IU/KOWA, Kowa, Mali

 KOWA 24hr plot

IU/LCO, Las Campanas Astronomical Observatory, Chile

 LCO 24hr plot

IU/LSZ, Lusaka, Zambia

 LSZ 24hr plot

IU/LVC, Limon Verde, Chile

 LVC 24hr plot

IU/MA2, Magadan, Russia

 MA2 24hr plot

IU/MAJO, Matsushiro, Japan

 MAJO 24hr plot

IU/MAKZ,Makanchi, Kazakhstan

 MAKZ 24hr plot

IU/MBWA, Marble Bar, Western Australia

 MBWA 24hr plot

IU/MIDW, Midway Island, Pacific Ocean, USA

 MIDW 24hr plot

IU/MSKU, Masuku, Gabon

 MSKU 24hr plot

IU/NWAO, Narrogin, Australia

 NWAO 24hr plot

IU/OTAV, Otavalo, Equador

 OTAV 24hr plot

IU/PAB, San Pablo, Spain

 PAB 24hr plot

IU/PAYG Puerto Ayora, Galapagos Islands

 PAYG 24hr plot

IU/PET, Petropavlovsk, Russia

 PET 24hr plot

IU/PMG, Port Moresby, Papua New Guinea

 PMG 24hr plot

IU/PMSA, Palmer Station, Antarctica

 PMSA 24hr plot

IU/POHA, Pohakaloa, Hawaii

 POHA 24hr plot

IU/PTCN, Pitcairn Island, South Pacific

 PTCN 24hr plot

IU/PTGA, Pitinga, Brazil

 PTGA 24hr plot

IU/QSPA, South Pole, Antarctica

 QSPA 24hr plot

IU/RAO, Raoul, Kermandec Islands

 RAO 24hr plot

IU/RAR, Rarotonga, Cook Islands

 RAR 24hr plot

IU/RCBR, Riachuelo, Brazil

 RCBR 24hr plot

IU/RSSD, Black Hills, South Dakota, USA

 RSSD 24hr plot

IU/SAML, Samuel, Brazil

 SAML 24hr plot

IU/SBA, Scott Base, Antarctica

 SBA 24hr plot

IU/SDV, Santo Domingo, Venezuela

 SDV 24hr plot

IU/SFJD, Sondre Stromfjord, Greenland

 SFJD 24hr plot

IU/SJG, San Juan, Puerto Rico

 SJG 24hr plot

IU/SLBS, Sierra la Laguna Baja California Sur, Mexico

 SLBS 24hr plot

IU/SNZO, South Karori, New Zealand

 SNZO 24hr plot

IU/SSPA, Standing Stone, Pennsylvania USA

 SSPA 24hr plot

IU/TARA, Tarawa Island, Republic of Kiribati

 TARA 24hr plot

IU/TATO, Taipei, Taiwan

 TATO 24hr plot

IU/TEIG, Tepich, Yucatan, Mexico

 TEIG 24hr plot

IU/TIXI, Tiksi, Russia

 TIXI 24hr plot

IU/TRIS, Tristan da Cunha, Atlantic Ocean

 TRIS 24hr plot

IU/TRQA, Tornquist, Argentina

 TRQA 24hr plot

IU/TSUM, Tsumeb, Namibia

 TSUM 24hr plot

IU/TUC, Tucson, Arizona

 TUC 24hr plot

IU/ULN, Ulaanbaatar, Mongolia

 ULN 24hr plot

IU/WAKE, Wake Island, Pacific Ocean

 WAKE 24hr plot

IU/WCI, Wyandotte Cave, Indiana, USA

 WCI 24hr plot

IU/WVT, Waverly, Tennessee, USA

 WVT 24hr plot

IU/XMAS, Kiritimati Island, Republic of Kiribati

 XMAS 24hr plot

IU/YAK, Yakutsk, Russia

 YAK 24hr plot

IU/YSS, Yuzhno Sakhalinsk, Russia

 YSS 24hr plot

**********************************************************************************************************

Volcanic Activity

Niwa observes underwater volcano changes

New Zealand scientists investigating an active undersea volcano that erupted three months ago have discovered significant changes to the seafloor.

Niwa research ship Tangaroa has mapped the Kermadec volcano that erupted 800km northeast of Tauranga on July 19, producing a pumice raft the size of Canterbury.

The eruption was strong enough to breach the ocean surface from a depth of 1100 metres. It was captured by a Nasa satellite, and a Royal New Zealand Air Force Orion patrol spotted the pumice on their way back home from Samoa.

Niwa’s volcanologist Dr Richard Wysoczanski, who is leading the 23-day expedition, said there had been volcanic activity every year for the past decade, but this was the largest by far.

“It is a substantial eruption. Had it occurred on land in New Zealand, it would have been a bit of a disaster.”

The volcanic caldera, which is like Lake Taupo, known to produce large and violent eruptions, spewed up to 10,000 more material than the Mt Tongariro eruption on August 6, he said.

It was mapped in 2002, showing a 1km-high undersea mountain with a 5km wide, 800-metre deep central crater.

This week, scientists found a new volcanic cone which has formed on the edge of the volcano, towering 240 metres above the crater rim.

They also found one side of the caldera wall is bulging in towards the volcano’s centre, indicating where an eruption may occur in the future or it may lead to an undersea avalanche.

Several cubic kilometres of new material has also been added to the volcano, with large volumes of freshly erupted pumice accumulating on the caldera floor, raising it by up to 10 metres.

“We couldn’t find any biology on the floor and the immediate vicinity has been completely wiped out,” Wysoczanski said.

Fresh volcanic rocks, up to beach ball size, will be brought back to Niwa for analysis.

Tangaroa embarked on the expedition to study the volcanic chain that stretches for 1000km north from Bay of Plenty. It is due back in Wellington on November 1.

  • Projectile point made from Obsidian Butte obsidian, collected west of Palomar Mountain in northern San Diego County, and attributed to the Luiseño cultural territory.

    Enlarge Photo

    LiveScience.com/Janet C. Harvey/Axel Schmitt – Projectile point made from Obsidian Butte obsidian, collected west of Palomar Mountain in northern San Diego County, and attributed to the Luiseño cultural te …more 

Related Content

  • In this Dec. 27, 2010 photo, the barren earth and dead trees reveal the blight of the Salton Sea, where water conservation efforts are attempting to restore the once natural playground and tourist site. The evaporating Salton Sea is the flashpoint for the latest dispute in California's water wars, testing an uneasy alliance that has sought to wean the Golden State from overreliance on Colorado River water.Enlarge GalleryIn this Dec. 27, 2010 photo, the barren earth and dead trees reveal the blight of …
  • Moonset at Rock Hill, one of five volcanoes that comprise the Salton Buttes. The buttes last erupted between 940 and 0 B.C., not 30,000 years ago, as previously thought, a new study finds.Enlarge PhotoMoonset at Rock Hill, one of five …

Earthquake swarms and a region-wide rotten egg smell recently reminded Southern California residents they live next to an active volcano field, tiny though it may be.

At the time, scientists said the phenomena did not reflect changes in the magma chamber below the Salton Sea. But now, researchers may need to revise estimates of the potential hazard posed by the Salton Buttes — five volcanoes at the lake’s southern tip.

The buttes last erupted between 940 and 0 B.C., not 30,000 years ago, as previously thought, a new study detailed online Oct. 15 in the journal Geology reports. The new age — which makes these some of California’s youngest volcanoes — pushes the volcanic quintuplets into active status. The California Volcano Observatory, launched in February by the U.S. Geological Survey (USGS), already lists the area as a high threat for future blasts.

“The USGS is starting to monitor all potentially active volcanoes in California, which includes the Salton Buttes,” said study author Axel Schmitt, a geochronologist at the University of California, Los Angeles. “With our results, I think this will further enhance the need to look into the system,” Schmitt told OurAmazingPlanet.

Schmitt and his colleagues dated zircon crystals in the hardened lava of the buttes with a relatively new technique, a “helium clock” that starts ticking once the minerals begin cooling at the surface.

Resolving the Obsidian Butte riddle

The revised age solves a long-standing archeological conundrum, said Steve Shackley, emeritus professor of anthropology at the University of California, Berkeley. Artifacts created from one of the five buttes, Obsidian Butte, first appear in Native American villages around 510 B.C. to 640 B.C. The Kumeyaay people, whose territory ranged from the coast to the Coso Mountains, crafted projectiles from Obsidian Butte glass, he said. “The men produced some of the best in the world,” Shackley told OurAmazingPlanet.

However, for decades, researchers thought Obsidian Butte erupted thousands of years earlier. To explain why no one collected the valuable obsidian, archeologists hypothesized that Obsidian Butte was submerged under ancient Lake Cahuilla, the precursor to today’s Salton Sea. But geologists had long proved that Lake Cahuilla was ephemeral, flooding and emptying over and over again, so the explanation was always problematic.

“If this dating method is correct, then the Obsidian Butte material wasn’t even available, and that makes more sense archaeologically,” Shackley said.

Rifting brings rising magma

In fact, that Obsidian Butte rises above the Salton Sea is what first attracted Schmitt’s attention. A 30,000-year-old butte should have been buried by a combination of sediment and subsidence by now, he said. “It had to be very young,” Schmitt said.

The buttes exist because California is tearing apart, forming new oceanic crust as magma wells up from below. The sinking Salton Trough is the landward extension of the Gulf of California, and marks the boundary between the Pacific and North America tectonic plates.

The lava source for the volcanoes is a magma chamberbeneath the Salton Sea, which also heats water for a nearby geothermal plant. Decay of uranium isotopes in zircon crystals show magma built up underneath the volcanoes for thousands of years before the latest eruption, the study shows. [50 Amazing Volcano Facts]

If another eruption occurs at the Salton Buttes, it will likely mimic past breakouts, Schmitt said. The volcanoes are made of sticky, slow-moving rhyolite lava. At Obsidian Butte, the lava cooled so quickly it turned into glass. However, pumice and ash found nearby means past breakouts started with a bang.

Schmitt said he hopes to study the area in more detail to better understand the most recent eruption. “The amounts of magma involved are relatively small and the impacts of an explosive eruption, meaning an ash cloud, would most likely be very local,” he said. “We don’t know very well how far any ash would have been dispersed, and that’s something I would like to follow up on in the research.”

Researching future hazards

The National Science Foundation’s EarthScope project funds an extensive seismic imaging project in the Salton Sea that may soon reveal more information about what’s happening deep underground.

“We’ll be looking with great interest to see what we can tell from the Salton Seismic Imaging Project,” said Joann Stock, a Caltech professor and an expert on the region’s volcanic hazards who was not involved in the new study.

“I think [Schmitt’s study] is a great contribution,” she said. “It’s an area where we should be concerned. We know that there’s a lot of hot stuff down there,” she told OurAmazingPlanet.

In August, an earthquake swarm shook the nearby town of Brawley. The USGS attributed the temblors to faults in the Brawley Seismic Zone. In September, a sulfurous stench emanated from the Salton Sea and wafted across the Inland Empire. The odor was tentatively linked to a fish die-off, but could also have been caused by volcanic gases, Stock said.

Reach Becky Oskin at boskin@techmedianetwork.com. Follow her on Twitter @beckyoskin. Follow OurAmazingPlanet on Twitter @OAPlanet. We’re also on Facebook and Google+.

Submarine eruption from Havre volcano built a new volcanic cone

By

Adonai
The Watchers Tweet Tweet New Zealand scientists investigating an active Kermadec undersea volcano Havre discovered significant changes to the seafloor during last eruption on July 19, 2012. The eruption was captured by a Nasa satellite, and a Royal New Zealand Air Force Orion patrol spotted the huge pumice area on their way back home from Samoa (read our earlier report) Scientists, aboard Niwa research ship – Tangaroa (deepwater research vessel), used multibeam sonar to map the seamount and found...

New Zealand scientists investigating an active Kermadec undersea volcano Havre discovered significant changes to the seafloor during last eruption on July 19, 2012. The eruption was captured by a Nasa satellite, and a Royal New Zealand Air Force Orion patrol spotted the huge pumice area on their way back home from Samoa (read our earlier report)

Scientists, aboard Niwa research ship – Tangaroa (deepwater research vessel), used multibeam sonar to map the seamount and found evidence of a new volcanic cone, 240 m tall and reaching withing 1,100 m below sea level, built on the side of the large submarine caldera of Havre. Aside from new volcanic cone they also found one side of the caldera wall is bulging in towards the volcano’s centre, indicating where an eruption may occur in the future or it may lead to an undersea avalanche.

Niwa’s volcanologist Dr Richard Wysoczanski, who is leading the 23-day expedition, said there had been volcanic activity every year for the past decade, but this was the largest by far.

“It is a substantial eruption. Had it occurred on land in New Zealand, it would have been a bit of a disaster.”

The volcanic caldera, which is like Lake Taupo, known to produce large and violent eruptions, spewed up to 10,000 more material than the Mt Tongariro eruption on August 6, he said.

***********************************************************************************************************

Extreme Temperatures/ Weather

27.10.2012 Forest / Wild Fire USA State of Kentucky, [Clay County] Damage level Details

Forest / Wild Fire in USA on Saturday, 27 October, 2012 at 04:38 (04:38 AM) UTC.

Description
A forest fire burned nearly 100 acres near the Sattler Branch community in Clay County. Fire fighters responded to the blaze late Thursday. By Friday afternoon, the flames were contained. Still, the fire gave folks who live nearby quite a scare. “It’s about that time of year you have to start worrying, leaves and everything is dry. There’s a lot of trees around here. It wasn’t as bad this year as it was last year; it was real close last year,” said resident Rebecca Combs. Back then, Combs says a forest fire came so close to her home that fire fighters had to hose it down to keep it from igniting. “All we could really see was the smoke this time. It was on the other side so it didn’t get really close, but it was close enough to make you nervous,” Combs said. Combs’ sister says their ailing father lives in the home. She says getting him out of the house in an emergency would be difficult. “He’s wheelchair bound so that wouldn’t have been something fun to try to do. It would’ve been a hassle. We try to think about going over fire evacuations any way, just in case because of him,” said sister Monica Baker. People we talked to in Clay County say the threat of fire is a constant concern this time of year. They say people need to be more careful.

***********************************************************************************************************

Storms / Flooding

Active tropical storm system(s)
Name of storm system Location Formed Last update Last category Course Wind Speed Gust Wave Source Details
Sandy (AL18) Carib Sea 22.10.2012 27.10.2012 Hurricane I 30 ° 120 km/h 148 km/h 3.66 m NOAA NHC Details

Tropical Storm data

Share:
Storm name: Sandy (AL18)
Area: Carib Sea
Start up location: N 13° 30.000, W 78° 0.000
Start up: 22nd October 2012
Status: Active
Track long: 1,078.30 km
Top category.:
Report by: NOAA NHC
Useful links:

Past track
Date Time Position Speed
km/h
Wind
km/h
Gust
km/h
Category Course Wave Pressure Source
Current position
Date Time Position Speed
km/h
Wind
km/h
Gust
km/h
Category Course Wave
feet
Pressure Source
27th Oct 2012 17:31:37 N 29° 0.000, W 76° 0.000 15 120 148 Hurricane I 30 ° 12 958 MB NOAA NHC
Forecast track
Date Time Position Category Wind
km/h
Gust
km/h
Source
29th Oct 2012 12:00:00 N 36° 24.000, W 72° 0.000 Hurricane II 130 157 NOAA NHC
29th Oct 2012 00:00:00 N 34° 12.000, W 72° 6.000 Hurricane I 120 148 NOAA NHC
30th Oct 2012 12:00:00 N 39° 48.000, W 77° 0.000 Hurricane I 102 120 NOAA NHC
31st Oct 2012 12:00:00 N 40° 48.000, W 77° 30.000 Tropical Depression 74 93 NOAA NHC
01st Nov 2012 12:00:00 N 43° 48.000, W 76° 48.000 Tropical Depression 65 83 NOAA NHC
Son-Thin (24W) Pacific Ocean 24.10.2012 27.10.2012 Typhoon IV 300 ° 204 km/h 250 km/h 3.35 m JTWC Details

Tropical Storm data

Share:
Storm name: Son-Thin (24W)
Area: Pacific Ocean
Start up location: N 9° 30.000, E 126° 24.000
Start up: 24th October 2012
Status: Active
Track long: 1,302.25 km
Top category.:
Report by: JTWC
Useful links:

Past track
Date Time Position Speed
km/h
Wind
km/h
Gust
km/h
Category Course Wave Pressure Source
Current position
Date Time Position Speed
km/h
Wind
km/h
Gust
km/h
Category Course Wave
feet
Pressure Source
27th Oct 2012 15:47:24 N 17° 30.000, E 108° 48.000 19 204 250 Typhoon IV 300 ° 11 JTWC
Forecast track
Date Time Position Category Wind
km/h
Gust
km/h
Source
29th Oct 2012 00:00:00 N 20° 54.000, E 105° 24.000 Tropical Depression 83 102 JTWC
30th Oct 2012 00:00:00 N 21° 42.000, E 106° 18.000 Tropical Depression 37 56 JTWC

…………………………………..

WASHINGTON –  The U.S. military will be moving ships from the Norfolk Naval Station region in Virginia out to sea to get out of the path of Hurricane Sandy.

The Navy says 24 of the larger ships in southeastern Virginia bases, including the aircraft carrier USS Harry S. Truman, are preparing to leave and will be moving out over the next day or so. The orders affect ships at Naval Station Norfolk and Joint Expeditionary Base Little Creek-Fort Story in the Hamption Roads area.

Other ships will be secured at the base. Military installations along the Eastern Seaboard, including Andrews Air Force Base and Langley Air Force Base in Virginia and Naval Submarine Base New London in Connecticut were also prepared to move ships and aircraft if needed.

New York faces most intense storm in history

City would actually benefit from a direct hit, forecast say

By Eric Holthaus


Reuters

Jean Marie Brennan walks along the jetty at Lighthouse Point Park as Hurricane Sandy passes offshore in Ponce Inlet, Fla. on Friday.

NEW YORK (MarketWatch) — As we’ve all heard by now, there is a big storm brewing on the East Coast. Looking at the latest weather models, that may be a bit of an understatement.

The National Weather Service has labelled the hybrid gyre that may result from the merging of Hurricane Sandy and a Midwest snowstorm a “Frankenstorm.” When it hits, the storm could have truly scary implications befitting the Halloween holiday it will coincide with.

You can read my latest forecast post on this rare menace over on the Wall Street Journal’s Metropolis blog.

In fact, computer models are now showing a storm so intense that it would break 100-plus year weather records for the most intense pressure readings ever recorded throughout nearly all of the Mid-Atlantic region northward into New York City and Long Island.

Every hurricane that has ever hit that area — from last year’s Hurricane Irene, to the “Perfect Storm” of 1991, even the Long Island Express of 1938 — would all rank below this storm should current models of the atmosphere pan out. That’s a stunning conclusion, but one worth pondering, even though the storm’s peak impacts won’t be felt until Tuesday and there’s still time for models to shift.

There’s reason to believe the models may be overdoing it. First off, what’s happening right now doesn’t have a clear precedence in the weather records. Our best available number-crunching simulations of the atmosphere simply weren’t designed for this scenario.

Normally, when hurricanes approach the East Coast from Sandy’s angle, they are pulled safely out to sea by a semi-permanent low-pressure center near Iceland. This time around, that low pressure isn’t there. In fact, it’s been replaced by a high pressure so intense it only occurs approximately 0.2% of the time on average.

The coincidence of that strong of a high pressure “block” being in place just when a hurricane is passing by — in and of itself a very rare occurrence — is just mind bogglingly rare. It’s the kind of stuff that’s important enough to rewrite meteorological textbooks. The result: Instead of heading out to sea Sandy’s full force will be turned back against the grain and directed squarely at the East Coast.

To top it off, an intense early-season snowstorm moving eastward out of the Great Lakes will provide an additional boost of energy to Sandy as it approaches the shore, broadening its windfield, strengthening its rainfall and waves, and increasing its destructive potential. This is truly a Frankenstein scenario — a hybrid of weather badness that is now coming alive.

The Hydrometeorological Prediction Center — the same folks at the National Weather Service that gave Sandy its “Frankenstorm” name — have had to manually adjust their official forecasts to tone down the exceptional scenarios that the weather models are currently showing.

It’s not that they don’t think the worst-case scenario is possible. It’s just that it’s never happened before. As a meteorologist, you have to be very, very careful if you are going to predict a historic scenario.

The storm is still a few days away, so there will be plenty of time to see how new model runs change with the addition of data from future Hurricane Hunter flights before the National Weather Service goes in full bore with an unprecedented forecast. For the time being, those from D.C. to Boston should remain especially vigilant and begin to take preparations to make sure they and their families are safe.

Storm may hit New York the hardest

Because the storm is expected to be so huge, the only reason its exact landfall location matters relates to the direction of the winds. Everyone from D.C. to New England will feel some type of effects, but because hurricanes rotate counter-clockwise, those north of the center will have massive amounts of seawater directly deposited on their shores.

For those south of the center, the storm’s circulation will actually be pushing flooding seas away from shore, lessening potential impacts.

Right now, the most reliable model tracks have clustered in a relatively tight range from Delaware to New York City. Counterintuitively, should the center of the storm make a direct strike on New York City, the city may actually be spared some of the more serious coastal impacts from the storm.

Should the storm continue on its current path (the National Hurricane Center’s most likely landfall is now in southern New Jersey), all bets are off for the five boroughs.

The latter scenario — the one that now appears most likely — would have many feet of ocean water funneled into New York Harbor over a period of up to 36 hours. Unlike Irene, which quickly transited New York City last year as a weakening tropical storm, Sandy may actually be in the process of strengthening when it makes landfall.

The result could prove incredibly damaging for coastal residents and critical infrastructure. Keep in mind that Irene was only inches away from flooding subway tunnels in Lower Manhattan. Storm-surge forecasts for this scenario haven’t been officially released yet, but six to 10 feet in the city is not out of the question in a worst-case scenario.

That result would put about 700,000 people’s homes underwater, according to a Climate Central interactive analysis. Add to that waves of 10 to 20 feet on ocean-facing shores, and an additional foot or so of tidal influence from the full moon, and we could be dealing with quite a mess on our hands.

With National Geographic reporting that sea level rise is already accelerating at three to four times the global rate in the Northeast due to climate change, impacts are expected to be worse than if the same exact storm would have hit several years ago.

Should Sandy veer further north of its current track and make landfall right over the city, storm surge could be dramatically lessened, though the city could receive about double the amount of rainfall — up to a foot or more.

For these reasons, if I were a resident of New York right now, I’d be rooting for a direct hit. If given a choice, I’d take 12 inches of rain over six feet of coastal flooding any day.

Meteorologist Eric Holthaus digs deeper into how weather and climate can affect markets for MarketWatch. He can be reached at wxriskforecaster@gmail.com.

Stories You Might Like

HURRICANE SANDY: RELATED STORIES
‘Frankenstorm’ has financial centers on edge
East Coast refineries brace for hurricane
Ways Sandy could jolt energy markets
Sandy wreaks havoc on airline flights
What homeowners need to know
New York faces most intense storm in history
Betting on Hurricane Sandy may be unwise
Where to watch Sandy: a list of webcams
Rolling coverage: East Coast girds for Sandy

New York Governor Andrew Cuomo declares State of Emergency as Hurricane Sandy barrels through Caribbean, killing 43

Sandy could be ‘worst case’ superstorm, more powerful than Hurricane Irene; officials will decide Saturday whether to evacuate wide swaths of New York City as ‘Frankenstorm’ approaches

By AND / NEW YORK DAILY NEWS

Resident Antonio Garces tries to recover his belongings from his house destroyed by Hurricane Sandy in Aguacate, Cuba, Thursday Oct. 25, 2012. Hurricane Sandy blasted across eastern Cuba on Thursday as a potent Category 2 storm and headed for the Bahamas after causing at least two deaths in the Caribbean. (AP Photo/Franklin Reyes)

Franklin Reyes/AP

Hurricane Sandy leveled homes in Cuba and Jamaica this week and it has been blamed for more than 20 deaths. The storm is marching north towards the U.S., and could slam New York with lashing rain, powerful winds and even snow.

In the face of a potentially devastating storm, Gov. Cuomo declared a state of emergency Friday and city officials considered evacuating as many as 375,000 New Yorkers.

The MTA was also considering a total shut down of buses and subways if the worst predictions about Hurricane Sandy come true.

The deadly tempest, which killed at least 41 people in the Caribbean, according to The Associated Press, is expected to make landfall late Monday night near Delaware.

NEW YORKERS: CLICK HERE TO SEE WHETHER YOU LIVE IN A HURRICANE EVACUATION ZONE

Mayor Bloomberg said he’d make a decision about evacuations in low-lying areas in all five boroughs as soon as Saturday.

“We are taking all the steps that we need to take,” Bloomberg said during a hastily called afternoon press conference on Friday.

HURRICANE27N_1_WEB

Franklin Reyes/AP

Hurricane Sandy blasted across eastern Cuba on Thursday as a potent Category 2 storm and headed for the Bahamas en route to the East Coast, forecasters predict.

HURRICANE NEW 3

Gilbert Bellamy/Reuters

Residents watch firefighters fight a blaze in a private home in Kingston October 26, 2012. The fire, which destroyed the home, was started by a faulty generator used to provide electricity in the blackout caused by the passing of Hurricane Sandy, firefighters said.

“But the storm is moving at a rate that we’re still not going to have a good sense of when and where it’s going to hit land.”

MTA Chairman Joseph Lhota said officials would begin the second shutdown of all buses and subways in its history if winds reach 39 mph.

“Our first priority is always safety, and the MTA is taking no chances with the safety of our customers, our employees and our equipment,” Lhota said in a statement. “We are hoping for the best but preparing for the worst. Whatever happens, we’ll be ready.”

Parts of the subway that are below sea level are particularly susceptible to flooding.

The MTA halted the subways for the first time in its history during Hurricane Irene last year.

HURRICANE NEW 2

Desmond Boylan/Reuters

People walk on a street littered with debris after Hurricane Sandy hit Santiago de Cuba October 26, 2012.

HURRICANE27N_4_WEB

Carl Juste/The Miami Herald via AP

Locals walk across the flooded streets of La Plaine, Haiti after Hurricane Sandy caused flooding and claimed more than 20 lives across the Caribbean.

Hurricane Irene was downgraded to a tropical storm before reaching the city but dire predictions in the days before it arrived triggered mandatory evacuations of lower Manhattan and other coastal neighborhoods.

With some forecasts predicting that Sandy could deliver an even more powerful punch, the city is again considering those extreme measures.

“The thing that we worry about the most is that people decide not to listen to the order to evacuate and then later on find themselves in harm’s way and then our police and fire departments have to put their lives on the line,” Bloomberg said.

City officials ordered construction crews to halt work as of Saturday evening and warned residents to prepare “go-bags” equipped with water and First Aid kits.

Officials were also deciding whether to cancel school on Monday.

story_hurricane2

Bryan Smith for New York Daily News

Mayor Michael Bloomberg discusses the city’s preparations ahead of Hurricane Sandy’s possible arrival early next week at City Hall on Friday.

Another major concern is “prolonged power outages,” Bloomberg said, and the city is working closely with ConEd.

“There are probably 20 different forecasts tracts for this storm and any one of them could be right,” Bloomberg said.

City Health Commissioner Thomas Farley said the city was asking six hospitals and 41 chronic care facilities, including nursing homes, in the low-lying areas to move patients who could be easily relocated.

HURRICANE NEW 4

nhc.noaa.gov

Hurricane Sandy path as shown by NOAA map.

The city could decide to evacuate the facilities using city buses as it did during Irene.

Cuomo declared a state of emergency for all 62 counties and said at a Long Island event that the state was taking “every precaution possible.”

A state of emergency gives the state more flexibility to help cities and counties. Cuomo also put the National Guard on alert, which makes Guard personnel and equipment available to help.

story_hurricane3

Julia Xanthos/New York Daily News

Workers from the MTA install plywood over subway grating to prevent flooding expected from Hurricane Sandy near the Staten Island Ferry in lower Manhattan on Friday.

He also said he will call up repair crews and reach out to other states that may have crews available.

The state is also asking for a pre-disaster declaration that would get New York federal aid and assistance, he said.

HURRICANE NEW 1

Carl Juste/The Miami Herald via AP

Residents of Leogane, Haiti find higher ground as the water level continues to rise Friday, Oct. 26, 2012.

story_hurricane1

Steve Nesius/Reuters

Jean Marie Brennan walks along the jetty at Lighthouse Point Park as Hurricane Sandy passes offshore in Ponce Inlet, Florida on Friday.

“There’s no need to panic,” he said. “We have a lot of time and we’re prepared for any eventuality, but we’d rather err on the side of caution.”

Cuomo canceled plans to campaign in Florida for President Obama so he could stay in New York. He also scrapped a homeland security conference scheduled for Monday in Albany so the 1,000 first responders who planned to attend could prepare for the storm in their home counties.

A host of other events were canceled as the storm loomed, including an exam for specialized high schools admissions scheduled for Sunday.With News Wire Services
With News Wire Services
tmoore@nydailynews.com

FoxNews.com

With a name like “Frankenstorm,” this could get ugly.

Hurricane Sandy, moving north from the Caribbean, was expected to make landfall Monday night near the Delaware coast, then hit two winter weather systems as it moves inland, creating a hybrid monster storm that could bring nearly a foot of rain, high winds and up to 2 feet of snow.

Experts said the storm would be wider and stronger than last year’s Irene, which caused more than $15 billion in damage, and could rival the worst East Coast storm on record.

Officials did not mince words, telling people to be prepared for several days without electricity. Jersey Shore beach towns began issuing voluntary evacuations and protecting boardwalks

Atlantic Beach casinos made contingency plans to close, and officials advised residents of flood-prone areas to stay with family or be ready to leave. Airlines said to expect cancellations and waived change fees for passengers who want to reschedule.

“Be forewarned,” said Connecticut Gov. Dannel P. Malloy. “Assume that you will be in the midst of flooding conditions, the likes of which you may not have seen at any of the major storms that have occurred over the last 30 years.”

Virginia Gov. Bob McDonnell declared a state of emergency Friday morning to help mobilize emergency response. The National Oceanic and Atmospheric Administration said that wherever the storm comes ashore, there will be 10 inches of rain and extreme storm surges. Up to 2 feet of snow should fall on West Virginia, with lighter snow in parts of Ohio and Pennsylvania.

The storm threatened to hit two weeks before Election Day, while several states were heavily involved in campaigning, canvassing and get-out-the-vote efforts. Republican presidential nominee Mitt Romney and Vice President Joe Biden both canceled weekend campaign events in coastal Virginia Beach, Va., though their events in other parts of the states were going on as planned.

In Rhode Island, politicians asked supporters to take down yard signs for fear they might turn into projectiles in the storm.

With a rare mix of three big merging weather systems over a densely populated region, experts predict at least $1 billion in damage.

STORM TIPS

Residents in the storm’s expected path should have a three days’ supply of water on hand, or one gallon per person per day, enough for drinking, cooking and some bathing, Virginia’s Department of Emergency Management recommends, and to combat extended power outages, residents should purchase battery-powered radios and extra batteries.

And if they meet Tuesday morning around New York or New Jersey, as forecasters predict, they could create a big, wet mess that settles over the nation’s most heavily populated corridor and reaches as far west as Ohio.

Airlines are giving travelers a way out if they want to scrap their plans due to Hurricane Sandy.

All the major airlines are offering waivers to customers who wish to reschedule their flights without incurring the typical fee of up to $150. The offers cover passengers flying in or out of just about any airport from Latin America to New Hampshire. Most waivers for travel in the Northeast are only valid Monday through Wednesday.

The airlines have only canceled a handful of flights so far, nearly all of them in and out of Florida and the Caribbean.

They say there will be hundreds of miles of steady, strong and damaging winds and rain for the entire Eastern region for several days. That could produce a bigger wallop than last year’s damaging Irene, which caused the cancellation of nearly 14,000 flights in a four-day period.

Those hoping to fly in or out of affected areas are asked to check their flight status before heading to the airport. Airlines also promise to update their Facebook pages and Twitter feeds with the latest information. To cancel, passengers should call the airline directly. Some airlines also allow changes to be made on their websites.

Passengers can expect cancellations to increase as the storm moves north over the weekend.

“Airlines and other operators generally stop flying to airports in the potential storm path long before winds reach dangerous levels,” the Federal Aviation Administration said in a statement.

Utilities are lining up out-of-state work crews and canceling employees’ days off to deal with expected power outages. From county disaster chiefs to the federal government, emergency officials are warning the public to be prepared. And President Barack Obama was briefed aboard Air Force One.

“It’s looking like a very serious storm that could be historic,” said Jeff Masters, meteorology director of the forecasting service Weather Underground. “Mother Nature is not saying, `Trick or treat.’ It’s just going to give tricks.”

National Oceanic and Atmospheric Administration forecaster Jim Cisco, who coined the nickname Frankenstorm, said: “We don’t have many modern precedents for what the models are suggesting.”

Government forecasters said there is a 90 percent chance — up from 60 percent two days earlier — that the East will get pounded.

Coastal areas from Florida to Maine will feel some effects, but the storm is expected to vent the worst of its fury on New Jersey and the New York City area, which could see around 5 inches of rain and gale-force winds close to 40 mph. Eastern Ohio, southwestern Pennsylvania and western Virginia could get snow.

And the storm will take its time leaving. The weather may not start clearing in the mid-Atlantic until the day after Halloween and Nov. 2 in the upper Northeast, Cisco said.

“It’s almost a weeklong, five-day, six-day event,” he said from a NOAA forecast center in College Park, Md. “It’s going to be a widespread, serious storm.”

It is likely to hit during a full moon, when tides are near their highest, increasing the risk of coastal flooding. And because many trees still have their leaves, they are more likely to topple in the event of wind and snow, meaning there could be widespread power outages lasting to Election Day.

Eastern states that saw outages that lasted for days after last year’s freak Halloween snowstorm and Hurricane Irene in late August 2011 are already pressuring power companies to be more ready this time.

Asked if he expected utilities to be more prepared, Massachusetts Gov. Deval Patrick responded: “They’d better be.”

Jersey Central Power & Light, which was criticized for its response to Irene, notified employees to be ready for extended shifts. In Pennsylvania, PPL Corp. spokesman Michael Wood said, “We’re in a much better place this year.”

New York Mayor Michael Bloomberg on Thursday said the city was striking a tone of calm preparedness.

“What we are doing is we are taking the kind of precautions you should expect us to do, and I don’t think anyone should panic,” Bloomberg said. The city has opened an emergency situation room and activated its coastal storm plan.

Some have compared the tempest to the so-called Perfect Storm that struck off the coast of New England in 1991, but that one hit a less populated area. Nor is this one like last year’s Halloween storm, which was merely an early snowfall.

“The Perfect Storm only did $200 million of damage and I’m thinking a billion” this time, Masters said. “Yeah, it will be worse.”

As it spun away from the Bahamas late Friday, Sandy was blamed for more than 43 deaths across the Caribbean. The 18th named storm of the Atlantic hurricane season hit the Bahamas after cutting across Cuba, where it tore roofs off homes and damaged fragile coffee and tomato crops. It is expected to move north, just off the Eastern Seaboard.

Norje Pupo, a 66-year-old retiree in Holguin, was helping his son clean up early Thursday after an enormous tree toppled in his garden.

“The hurricane really hit us hard,” he said. “As you can see, we were very affected. The houses are not poorly made here, but some may have been damaged.”

The Associated Press contributed to this story.

27.10.2012 Tropical Storm Cuba MultiProvinces, [Provinces of Santiago de Cuba and Holguin] Damage level Details

Tropical Storm in Cuba on Friday, 26 October, 2012 at 02:49 (02:49 AM) UTC.

Back

Updated: Saturday, 27 October, 2012 at 04:35 UTC
Description
The Cuban government said on Thursday night that 11 people died when the storm barreled across the island, most killed by falling trees or in building collapses in Santiago de Cuba province and neighboring Guantanamo province. The Cuban deaths were an unusually high number for the communist island which prides itself on protecting its people from storms by ordering mass evacuations.

************************************************************************************************************

Radiation

Fish Off Japan’s Coast Said to Contain Elevated Levels of Cesium

By

TOKYO — Elevated levels of cesium still detected in fish off the Fukushima coast of Japan suggest that radioactive particles from last year’s nuclear disaster have accumulated on the seafloor and could contaminate sea life for decades, according to new research.

Asahi Shimbun, via Getty Images

A broker inspected octopus from Fukushima at a market in Tokyo in August.

World Twitter Logo.

The findings published in Friday’s issue of the journal Science highlight the challenges facing Japan as it seeks to protect its food supply and rebuild the local fisheries industry.

More than 18 months after the nuclear disaster, Japan bans the sale of 36 species of fish caught off Fukushima, rendering the bulk of its fishing boats idle and denying the region one of its mainstay industries.

Some local fishermen are trying to return to work. Since July, a handful of them have resumed small-scale commercial fishing for species, like octopus, that have cleared government radiation tests. Radiation readings in waters off Fukushima and beyond have returned to near-normal levels.

But about 40 percent of fish caught off Fukushima and tested by the government still have too much cesium to be safe to eat under regulatory limits set by the Japanese government last year, said the article’s author, Ken O. Buesseler, a leading marine chemistry expert at the Woods Hole Oceanographic Institution, who analyzed test results from the 12 months following the March 2011 disaster.

Because cesium tends not to stay very long in the tissues of saltwater fish — and because high radiation levels have been detected most often in bottom-feeding fish — it is likely that fish are being newly contaminated by cesium on the seabed, Mr. Buesseler wrote in the Science article.

“The fact that many fish are just as contaminated today with cesium 134 and cesium 137 as they were more than one year ago implies that cesium is still being released into the food chain,” Mr. Buesseler wrote. This kind of cesium has a half-life of 30 years, meaning that it falls off by half in radioactive intensity every 30 years. Given that, he said, “sediments would remain contaminated for decades to come.”

Officials at Japan’s Fisheries Agency, which conducted the tests, said Mr. Buesseler’s analysis made sense.

“In the early days of the disaster, as the fallout hit the ocean, we saw high levels of radiation from fish near the surface,” said Koichi Tahara, assistant director of the agency’s resources and research division. “But now it would be reasonable to assume that radioactive substances are settling on the seafloor.”

But that was less of a concern than Mr. Buesseler’s research might suggest, Mr. Tahara said, because the cesium was expected to eventually settle down into the seabed.

Mr. Tahara also stressed that the government would continue its vigorous testing and that fishing bans would remain in place until radiation readings returned to safe levels.

Naohiro Yoshida, an environmental chemistry expert at the Tokyo Institute of Technology, said that while he agreed with much of Mr. Buesseler’s analysis, it was too early to reach a conclusion on how extensive radioactive contamination of Japan’s oceans would be, and how long it would have an impact on marine life in the area.

Further research was needed on ocean currents, sediments and how different species of fish are affected by radioactive contamination, he said.

As much as four-fifths of the radioactive substances released from the Fukushima Daiichi nuclear power plant are thought to have entered the sea, either blown offshore or released directly into the ocean from water used to cool the site’s reactors in the wake of the accident.

Sea currents quickly dispersed that radioactivity, and seawater readings off the Fukushima shore returned to near-normal levels. But fish caught in the area continue to show elevated readings for radioactive cesium, which is associated with an increased risk of cancer in humans.

Just two months ago, two greenling caught close to the Fukushima shore were found to contain more than 25,000 becquerels a kilogram of cesium, the highest cesium levels found in fish since the disaster and 250 times the government’s safety limit.

The operator of the Fukushima plant, the Tokyo Electric Power Company, said that the site no longer released contaminated water into the ocean, and that radiation levels in waters around the plant had stabilized.

But Yoshikazu Nagai, a spokesman for the company, said he could not rule out undetected leaks into the ocean from its reactors, the basements of which remain flooded with cooling water.

To reduce the chance of water from seeping out of the plant, Tokyo Electric is building a 2,400-foot-long wall between the site’s reactors and the ocean. But Mr. Nagai said the steel-and-concrete wall, which will reach 100 feet underground, would take until mid-2014 to build.


Fukushima owner says plant may be leaking radiation into sea


Volunteers to remove radioactive substances from a fishing boat in Minamisoma, Fukushima Prefecture, in this photo taken by Kyodo October 24, 2011. (Reuters / Kyodo)

Volunteers to remove radioactive substances from a fishing boat in Minamisoma, Fukushima Prefecture, in this photo taken by Kyodo October 24, 2011. (Reuters / Kyodo)

TEPCO, operator of the Fukushima nuclear facility, failed to confirm that radiation leaks at the plant had fully stopped. This came after a US report that irradiated fish are still being caught off the coast of Japan following the 2011 meltdown.

­The Tokyo Electric Power Co. (TEPCO) told journalists Friday they could not confirm that radiation had stopped leaking from the nuclear power plant struck by a massive earthquake and tsunami in March 2011. Still, they said that radiation levels in the seawater and seabed soil around the plant were declining.

A recent article in the academic journal Science revealed that 40 percent of bottom-dwelling marine species in the area show cesium-134 and 137 levels that are still higher than normal.

The numbers aren’t going down. Oceans usually cause the concentrations to decrease if the spigot is turned off,” Ken Buesseler, study author and senior scientist at the Woods Hole Oceanographic Institution told the Associated Press. “There has to be somewhere they’re picking up the cesium.”

Option one is the seafloor is the source of the continued contamination. The other source could be the reactors themselves,” Buesseler added.

Radioactive cesium is a human-made radioactive isotope produced through nuclear fission of the element cesium. It has a half-life of 30 years, making it extremely toxic.

TEPCO confirmed that the radioactive water used to cool the plant’s reactors leaked into the ocean several times, most recently in April.

The plant is struggling to find space to store the tens of thousands of tons of highly contaminated water used to cool the broken reactors and prevent it from a meltdown.

The company managed to collect the water used to cool the spent fuel rods and circulate it back into reactor cores, so the reactors are now being cooled with recycled water. However, groundwater is still seeping through cracks in basement where the reactor and turbine are stored, posing further dangers.

With the groundwater seeping in, the volume of decontaminated water collected and stored at the Fukushima Daiichi plant could triple within three years, TEPCO told the AP.

The accident at the Fukushima-1 nuclear power plant was triggered by a 9.0-magnitude earthquake that struck northeastern Japan on March 11, 2011. An enormous tsunami crashed onto the land, resulting in the flash-flooding of four of the plant’s six reactors, shattering the cooling system. This led to a series of oxygen blasts, and a partial meltdown of the reactor core.

The incident was the biggest nuclear disaster in 25 years since the tragedy at the Chernobyl nuclear power plant. Multiple cases of contamination of air and seawater by radioactive material have been reported. Over 140,000 people were forced to leave an evacuation area 40 kilometers in diameter around the plant. Most of those people are still living in shelters. Full management of the disaster, including dismantling the reactors, is expected to take around 40 years.


Fukushima ‘running out of space’ to store dirty water

by Our Foreign Desk

Japan’s crippled Fukushima nuclear power plant is struggling to find space to store tens of thousands of tons of highly contaminated water, it emerged today.

About 200,000 tons of radioactive water used to cool the broken reactors are being stored in hundreds of gigantic tanks built around the Fukushima Dai-ichi plant.

Operator Tokyo Electric Power (Tepco) has already chopped down trees to make room for more tanks and predicts the volume will more than triple within three years.

“Our land is limited and we could eventually run out of storage space,” said water treatment manager Yuichi Okamura.

Tepco’s tanks are filling up mostly because leaks in reactor facilities are allowing ground water to pour in.

Outside experts say that if contaminated water is released, there will be a lasting impact on the environment.

And they fear that because of the reactor leaks and water flowing from one part of the plant to another, that may already be happening.

Nuclear engineer Masashi Goto said the contaminated water build-up poses a long-term threat.

He said that the radioactive water in the basements may already be getting into the underground water system, where it could reach far beyond the plant, possibly into the ocean or public water supplies.

“You never know where it’s leaking and once it’s out you can’t put it back,” he said.

He added that the Tepco roadmap for dealing with the problem was “wishful thinking.”

“The longer it takes, the more contaminated water they get.”

************************************************************************************************************

Epidemic Hazards / Diseases

27.10.2012 Epidemic Hazard Uganda Western Uganda, [Kabale District] Damage level Details

Epidemic Hazard in Uganda on Friday, 19 October, 2012 at 10:56 (10:56 AM) UTC.

Back

Updated: Saturday, 27 October, 2012 at 12:43 UTC
Description
Another person has died of the Marburg viral disease in the southwestern district of Kabale, bringing the total number of such deaths to seven. Lydia Rusanyuka died Saturday morning at Rushoroza health center three after spending less than a week under medical care inside the isolation center. The deadly virus claimed its seventh victim just a little over a week since its outbreak in the district was first reported by health experts. The medics had settled onto the conclusion after samples from two relatives taken to the Uganda Virus Institute had tested positive. Rusanyuka, the mother of a mortuary attendant who also succumbed to the disease had been tested positive with the virus prior to her death. Her son, Jason Tumukunde also died of the same disease. Doctor Patrick Tusiime, the Kabale District health officer has said the deceased will be buried in Bukora, Kitumba sub-county Kabale district today. Meanwhile, the wife of the late Tumukunde, his sister and their eight-year-old daughter remain in isolation at Rushoroza after testing positive.

*************************************************************************************************************

Climate Change

Opposite Behaviors? Arctic Sea Ice Shrinks, Antarctic Grows

by Maria-Jose Vinas for NASA’s Earth Science News
Greenbelt MD (SPX)


September 2012 witnessed two opposite records concerning sea ice. Two weeks after the Arctic Ocean’s ice cap experienced an all-time summertime low for the satellite era (left), Antarctic sea ice reached a record winter maximum extent (right). But sea ice in the Arctic has melted at a much faster rate than it has expanded in the Southern Ocean, as can be seen in this image by comparing the 2012 sea ice levels with the yellow outline, which in the Arctic image represents average sea ice minimum extent from 1979 through 2010 and in the Antarctic image shows the median sea ice extent in September from 1979 to 2000. Credit: NASA/Goddard Space Flight Center Scientific Visualization Studio and NASA Earth Observatory/ Jesse Allen. View Arctic larger. View Antarctic larger.

The steady and dramatic decline in the sea ice cover of the Arctic Ocean over the last three decades has become a focus of media and public attention. At the opposite end of the Earth, however, something more complex is happening.

A new NASA study shows that from 1978 to 2010 the total extent of sea ice surrounding Antarctica in the Southern Ocean grew by roughly 6,600 square miles every year, an area larger than the state of Connecticut. And previous research by the same authors indicates that this rate of increase has recently accelerated, up from an average rate of almost 4,300 square miles per year from 1978 to 2006.

“There’s been an overall increase in the sea ice cover in the Antarctic, which is the opposite of what is happening in the Arctic,” said lead author Claire Parkinson, a climate scientist with NASA’s Goddard Space Flight Center, Greenbelt, Md. “However, this growth rate is not nearly as large as the decrease in the Arctic.”

The Earth’s poles have very different geographies. The Arctic Ocean is surrounded by North America, Greenland and Eurasia. These large landmasses trap most of the sea ice, which builds up and retreats with each yearly freeze-and-melt cycle. But a large fraction of the older, thicker Arctic sea ice has disappeared over the last three decades. The shrinking summer ice cover has exposed dark ocean water that absorbs sunlight and warms up, leading to more ice loss.

On the opposite side of the planet, Antarctica is a continent circled by open waters that let sea ice expand during the winter but also offer less shelter during the melt season. Most of the Southern Ocean’s frozen cover grows and retreats every year, leading to little perennial sea ice in Antarctica.

Using passive-microwave data from NASA’s Nimbus 7 satellite and several Department of Defense meteorological satellites, Parkinson and colleague Don Cavalieri showed that sea ice changes were not uniform around Antarctica.

Most of the growth from 1978 to 2010 occurred in the Ross Sea, which gained a little under 5,300 square miles of sea ice per year, with more modest increases in the Weddell Sea and Indian Ocean. At the same time, the region of the Bellingshausen and Amundsen Seas lost an average of about 3,200 square miles of ice every year.

Parkinson and Cavalieri said that the mixed pattern of ice growth and ice loss around the Southern Ocean could be due to changes in atmospheric circulation. Recent research points at the depleted ozone layer over Antarctica as a possible culprit.

Ozone absorbs solar energy, so a lower concentration of this molecule can lead to a cooling of the stratosphere (the layer between six and 30 miles above the Earth’s surface) over Antarctica. At the same time, the temperate latitudes have been warming, and the differential in temperatures has strengthened the circumpolar winds flowing over the Ross Ice Shelf.

“Winds off the Ross Ice Shelf are getting stronger and stronger, and that causes the sea ice to be pushed off the coast, which generates areas of open water, polynyas,” said Josefino Comiso, a senior scientist at NASA Goddard.

“The larger the coastal polynya, the more ice it produces, because in polynyas the water is in direct contact with the very cold winter atmosphere and rapidly freezes.” As the wind keeps blowing, the ice expands further to the north.

This year’s winter Antarctic sea ice maximum extent, reached two weeks after the Arctic Ocean’s ice cap experienced an all-time summertime low, was a record high for the satellite era of 7.49 million square miles, about 193,000 square miles more than its average maximum extent for the last three decades.

The Antarctic minimum extents, which are reached in the midst of the Antarctic summer, in February, have also slightly increased to 1.33 million square miles in 2012, or around 251,000 square miles more than the average minimum extent since 1979.

The numbers for the southernmost ocean, however, pale in comparison with the rates at which the Arctic has been losing sea ice – the extent of the ice cover of the Arctic Ocean in September 2012 was 1.32 million square miles below the average September extent from 1979 to 2000. The lost ice area is equivalent to roughly two Alaskas.

Parkinson said that the fact that some areas of the Southern Ocean are cooling and producing more sea ice does not disprove a warming climate.

“Climate does not change uniformly: The Earth is very large and the expectation definitely would be that there would be different changes in different regions of the world,” Parkinson said. “That’s true even if overall the system is warming.” Another recent NASA study showed that Antarctic sea ice slightly thinned from 2003 to 2008, but increases in the extent of the ice balanced the loss in thickness and led to an overall volume gain.

The new research, which used laser altimetry data from the Ice, Cloud, and land Elevation Satellite (ICESat), was the first to estimate sea ice thickness for the entire Southern Ocean from space.

Records of Antarctic sea ice thickness are much patchier than those of the Arctic, due to the logistical challenges of taking regular measurements in the fierce and frigid waters around Antarctica. The field data collection is mostly limited to research icebreakers that generally only travel there during spring and summer – so the sole means to get large-scale thickness measurements is from space.

“We have a good handle of the extent of the Antarctic sea ice, but the thickness has been the missing piece to monitor the sea ice mass balance,” said Thorsten Markus, one of the authors of the study and Project Scientist for ICESat-2, a satellite mission designed to replace the now defunct ICESat. ICESat-2 is scheduled to launch in 2016. “The extent can be greater, but if the sea ice gets thinner, the volume could stay the same.”

************************************************************************************************************

Solar Activity

2MIN News October 26. 2012

Published on Oct 26, 2012 by

Collapsing Atmosphere/Magnetic Shield: http://youtu.be/woVitezc-zU
STARWATER: http://youtu.be/LiC-92YgZvQ

TODAY’S LINKS
Methane Followup: http://usnews.nbcnews.com/_news/2012/10/24/14670511-climate-changing-methane-…
Saturn Storm: http://www.sciencedaily.com/releases/2012/10/121025105209.htm
Saturn Storm Visualizations: http://phys.org/news/2012-10-after-effects-saturn-super-storm-video.html
Hawaii Volcano Update: http://news.discovery.com/earth/kilauea-lava-lake-threatens-to-spill-121024.html
Soyuz/ISS Update: http://phys.org/news/2012-10-soyuz-astronauts-docks-space-station.html
China’s Largest Fresh Lake: http://news.xinhuanet.com/english/photo/2012-10/26/c_131931543.htm
China NavSat: http://news.xinhuanet.com/english/photo/2012-10/26/c_131931037.htm
Italy Quake: http://www.telegraph.co.uk/news/worldnews/europe/italy/9634929/One-dead-as-5….

REPEAT LINKS
Spaceweather: http://spaceweather.com/ [Look on the left at the X-ray Flux and Solar Wind Speed/Density]

HAARP: http://www.haarp.alaska.edu/haarp/data.html [Click online data, and have a little fun]

CERES JPL: http://ssd.jpl.nasa.gov/sbdb.cgi?sstr=ceres;orb=1;cov=0;log=0;cad=0#orb

SDO: http://sdo.gsfc.nasa.gov/data/ [Place to find Solar Images and Videos – as seen from earth]

Helioviewer: http://www.helioviewer.org/

SOHO: http://sohodata.nascom.nasa.gov/cgi-bin/soho_movie_theater [SOHO; Lasco and EIT – as seen from earth]

Stereo: http://stereo.gsfc.nasa.gov/cgi-bin/images [Stereo; Cor, EUVI, HI – as seen from the side]

SunAEON: http://www.sunaeon.com/#/solarsystem/ [Just click it… trust me]

SOLARIMG: http://solarimg.org/artis/ [All purpose data viewing site]

iSWA: http://iswa.gsfc.nasa.gov/iswa/iSWA.html [Free Application; for advanced sun watchers]

NASA ENLIL SPIRAL: http://iswa.gsfc.nasa.gov:8080/IswaSystemWebApp/iSWACygnetStreamer?timestamp=…
NOAA ENLIL SPIRAL: http://www.swpc.noaa.gov/wsa-enlil/

US Wind Map: http://hint.fm/wind/

NOAA Bouys: http://www.ndbc.noaa.gov/

RADIATION Network: http://radiationnetwork.com/

NOAA Environmental Visualization Laboratory: http://www.nnvl.noaa.gov/Default.php

RSOE: http://hisz.rsoe.hu/alertmap/index2.php [That cool alert map I use]

GOES Xray: http://www.swpc.noaa.gov/sxi/goes15/index.html

JAPAN Radiation Map: http://jciv.iidj.net/map/

LISS: http://earthquake.usgs.gov/monitoring/operations/heliplots_gsn.php

Gamma Ray Bursts: http://grb.sonoma.edu/ [Really? You can’t figure out what this one is for?]

BARTOL Cosmic Rays: http://neutronm.bartol.udel.edu//spaceweather/welcome.html [Top left box, look for BIG blue circles]

TORCON: http://www.weather.com/news/tornado-torcon-index [Tornado Forecast for the day]

GOES Weather: http://rsd.gsfc.nasa.gov/goes/ [Clouds over America]

RAIN RECORDS: http://www.cocorahs.org/ViewData/ListIntensePrecipReports.aspx

EL DORADO WORLD WEATHER MAP: http://www.eldoradocountyweather.com/satellite/ssec/world/world-composite-ir-…

PRESSURE MAP: http://www.woweather.com/cgi-bin/expertcharts?LANG=us&MENU=0000000000&…

HURRICANE TRACKER: http://www.weather.com/weather/hurricanecentral/tracker

INTELLICAST: http://www.intellicast.com/ [Weather site used by many youtubers]

NASA News: http://science.nasa.gov/science-news/science-at-nasa/

PHYSORG: http://phys.org/ [GREAT News Site!]

QUAKES LIST FULL: http://www.emsc-csem.org/Earthquake/seismologist.php

2MIN News October 27. 2012


Published on Oct 27, 2012 by

All Images seen and Information heard here can be found at the Links Below, with gratitude. [Click SHOW MORE]

Collapsing Atmosphere/Magnetic Shield: http://youtu.be/woVitezc-zU
STARWATER: http://youtu.be/LiC-92YgZvQ

TODAY’S LINKS
Fukushima Worry: http://www.weather.com/news/japan-nuclear-water-worries-20121025

REPEAT LINKS
Spaceweather: http://spaceweather.com/ [Look on the left at the X-ray Flux and Solar Wind Speed/Density]

HAARP: http://www.haarp.alaska.edu/haarp/data.html [Click online data, and have a little fun]

CERES JPL: http://ssd.jpl.nasa.gov/sbdb.cgi?sstr=ceres;orb=1;cov=0;log=0;cad=0#orb

SDO: http://sdo.gsfc.nasa.gov/data/ [Place to find Solar Images and Videos – as seen from earth]

Helioviewer: http://www.helioviewer.org/

SOHO: http://sohodata.nascom.nasa.gov/cgi-bin/soho_movie_theater [SOHO; Lasco and EIT – as seen from earth]

Stereo: http://stereo.gsfc.nasa.gov/cgi-bin/images [Stereo; Cor, EUVI, HI – as seen from the side]

SunAEON: http://www.sunaeon.com/#/solarsystem/ [Just click it… trust me]

SOLARIMG: http://solarimg.org/artis/ [All purpose data viewing site]

iSWA: http://iswa.gsfc.nasa.gov/iswa/iSWA.html [Free Application; for advanced sun watchers]

NASA ENLIL SPIRAL: http://iswa.gsfc.nasa.gov:8080/IswaSystemWebApp/iSWACygnetStreamer?timestamp=…
NOAA ENLIL SPIRAL: http://www.swpc.noaa.gov/wsa-enlil/

US Wind Map: http://hint.fm/wind/

NOAA Bouys: http://www.ndbc.noaa.gov/

RADIATION Network: http://radiationnetwork.com/

NOAA Environmental Visualization Laboratory: http://www.nnvl.noaa.gov/Default.php

RSOE: http://hisz.rsoe.hu/alertmap/index2.php [That cool alert map I use]

GOES Xray: http://www.swpc.noaa.gov/sxi/goes15/index.html

JAPAN Radiation Map: http://jciv.iidj.net/map/

LISS: http://earthquake.usgs.gov/monitoring/operations/heliplots_gsn.php

Gamma Ray Bursts: http://grb.sonoma.edu/ [Really? You can’t figure out what this one is for?]

BARTOL Cosmic Rays: http://neutronm.bartol.udel.edu//spaceweather/welcome.html [Top left box, look for BIG blue circles]

TORCON: http://www.weather.com/news/tornado-torcon-index [Tornado Forecast for the day]

GOES Weather: http://rsd.gsfc.nasa.gov/goes/ [Clouds over America]

RAIN RECORDS: http://www.cocorahs.org/ViewData/ListIntensePrecipReports.aspx

EL DORADO WORLD WEATHER MAP: http://www.eldoradocountyweather.com/satellite/ssec/world/world-composite-ir-…

PRESSURE MAP: http://www.woweather.com/cgi-bin/expertcharts?LANG=us&MENU=0000000000&…

HURRICANE TRACKER: http://www.weather.com/weather/hurricanecentral/tracker

INTELLICAST: http://www.intellicast.com/ [Weather site used by many youtubers]

NASA News: http://science.nasa.gov/science-news/science-at-nasa/

PHYSORG: http://phys.org/ [GREAT News Site!]

QUAKES LIST FULL: http://www.emsc-csem.org/Earthquake/seismologist.php

CANYON OF FIRE:

A filament of magnetism snaking around the sun’s southeastern limb erupted on Oct 26th. The blast created a “canyon of fire” in the sun’s lower atmosphere. Click on the circle to animate the event:

The glowing walls of the canyon are formed in a process closely related to that of arcade loops, which appear after many solar flares. Stretching more than 250,000 km from end to end, the “canyon” traces the original channel where the filament was suspended by magnetic forces above the stellar surface.

As erupting magnetic filaments often do, this one launched a coronal mass ejection (CME) into space. The Solar and Heliospheric Observary recorded the expanding cloud: movie. The CME does not appear to be heading for Earth or any other planet.

Solar activity at low levels with possible Earth-directed CME…

By

chillymanjaro
 
The Watchers Tweet Tweet Solar activity was at low levels for the past 24 hours and X-Ray flux plot shown merely C-class threshold. However, a prominence eruption was observed north of Region 1600. A bright CME was observed in STEREO Ahead COR 2 imagery at 18:24 UTC on October 27. Latest STEREO Ahead COR2 images indicate that this CME may be Earth directed. SIDC reports that a halo or partial-halo CME was detected. SpaceWeather.com reports that filament of...

Solar activity was at low levels for the past 24 hours and X-Ray flux plot shown merely C-class threshold. However, a prominence eruption was observed north of Region 1600.

A bright CME was observed in STEREO Ahead COR 2 imagery at 18:24 UTC on October 27. Latest STEREO Ahead COR2 images indicate that this CME may be Earth directed. SIDC reports that a halo or partial-halo CME was detected.

STEREO Behind COR2 image from 21:40 UTC on OCtober 27 and earlier STEREO Ahead COR2 image from 18:54 UTC on October 27

SOHO’s LASCO C2 latest image is recorded at 11:12 UTC on October 26.

SpaceWeather.com reports that filament of magnetism snaking around the sun’s southeastern limb erupted on October 26. The blast created a “canyon of fire” in the sun’s lower atmosphere. This solar filament launched a coronal mass ejection (CME) into space but luckily, it was not Earth-directed. Stretching more than 250,000 km from end to end, the “canyon” traces the original channel where the filament was suspended by magnetic forces above the stellar surface.

GOES X-Ray flux show mostly quit conditions, only 3 C-class flares were observed during the past 24 hours.

All four visible Sunspot regions (1596, 1598, 1599, 1600) are currently stable. Three low-level C-class flares were observed from behind the west limb, likely from old Region 1594. Region 1598 remained the most magnetically complex region on the visible disk and produced a B9 flare at 12:35 UTC on October 27. Region 1596 has shown signs of penumbral decay, mainly in its trailer spots. There are no large coronal holes on the Earthside of the Sun.

There will be a slight chance for an isolated M-Class flare throughout the weekend. NOAA/SWPC forecasters estimated 15 % chances of M-class event. Sunspot 1598 is the one to watch.

************************************************************************************************************

Space

NASA: Rare, enormous gas storm detected on Saturn

By Todd Sperry, CNN
These red, orange and green clouds on Saturn represent the tail end of a 2010/11 massive storm.
STORY HIGHLIGHTS
  • The storm, first detected in 2010, let out something of a cosmic burp
  • If on Earth, it would cover North America top to bottom and wrap the globe many times
  • The storm also led to a drastic change in the ringed planet

(CNN) — NASA says the Cassini spacecraft recorded the aftermath of a massive storm on Saturn that let out an “unprecedented belch of energy.”

Not only was the size of the storm unusual, but what the storm was made of left scientists puzzled.

The source of the cosmic burp, which rapidly changed the atmosphere’s temperature, was ethylene gas, an odorless, colorless gas that has rarely been observed on Saturn, NASA said.

“This temperature spike is so extreme it’s almost unbelievable,” said Brigette Hesman, the study’s lead author who works at Goddard. “To get a temperature change of the same scale on Earth, you’d be going from the depths of winter in Fairbanks, Alaska, to the height of summer in the Mojave Desert,” Hesman said in a statement released by NASA.

NASA’s NuStar gets first look at black hole at the center of the Milky Way

Scientists still haven’t figured out from where the ethylene gas came.

By comparison, a storm of similar size on Earth would cover North America from top to bottom and wrap the planet many times, researchers said.

The Cassini spacecraft first detected the disruption on December 5, 2010, and has been following it since, but researchers said the ethylene gas disruption that followed the storm was unexpected.

A storm this size happens once every 30 years, or once every Saturn year, NASA scientists said.

Launched in 1997, the Cassini-Huygens mission is a cooperative project of NASA, the European Space Agency and the Italian Space Agency.

A full report will be published in November’s issue of the Astrophysical Journal.

A COMET IN TROUBLE?

Amateur astronomers have been keeping a close eye on Comet 168P/Hergenrother since October 1st when it suddenly brightened 500-fold, from 15th to 8th magnitude. At the time, the comet was making its closest approach to the sun (1.4 AU). Some observers speculated that solar heating caused the fragile comet to break apart. On Oct. 26th, a group of astronomers found evidence to support this idea. “Using the Faulkes North (F65) telescope,” writes Ernesto Guido et al., “we detected a fragmentation in Comet 168P.”

“Our images, taken on Oct. 26th, reveal the presence of a secondary nucleus, or fragment, about two arcseconds away from the main central condensation of comet 168P.” This is probably a chunk of rocky ice emerging from the haze of gas and dust that surrounds the main nucleus, still hidden inside. Comets are notoriously fragile, so its no surprise that Comet 168P/Hergenrother is breaking apart in this way.

The only question is, what happens next? Will the comet spit in two, with two heads and two tails, one tracking the fragment and the other tracking the parent? Or is this the prelude to a more complete disintegration? Amateur astronomers are encouraged to monitor developments while the comet remains bright enough to see through backyard telescopes. Here are the comet’s coordinates. For best results, we recommend the Comet Hunter Telescope.

Earth approaching objects (objects that are known in the next 30 days)

Object Name Apporach Date Left AU Distance LD Distance Estimated Diameter* Relative Velocity
214869 (2007 PA8) 05th November 2012 8 day(s) 0.0433 16.8 1.5 km – 3.3 km 10.79 km/s 38844 km/h
(2011 UG21) 06th November 2012 9 day(s) 0.1784 69.4 340 m – 760 m 19.73 km/s 71028 km/h
(2010 WT) 07th November 2012 10 day(s) 0.1251 48.7 53 m – 120 m 6.53 km/s 23508 km/h
333358 (2001 WN1) 09th November 2012 12 day(s) 0.1285 50.0 370 m – 830 m 8.73 km/s 31428 km/h
330233 (2006 KV86) 11th November 2012 14 day(s) 0.1876 73.0 450 m – 1.0 km 23.35 km/s 84060 km/h
(2008 LH2) 12th November 2012 15 day(s) 0.1487 57.9 35 m – 78 m 5.10 km/s 18360 km/h
(2001 YM2) 12th November 2012 15 day(s) 0.0860 33.5 440 m – 980 m 9.26 km/s 33336 km/h
(2012 KF25) 15th November 2012 18 day(s) 0.1528 59.5 23 m – 51 m 9.75 km/s 35100 km/h
(1999 SF10) 19th November 2012 22 day(s) 0.0346 13.5 41 m – 92 m 4.08 km/s 14688 km/h
(2009 WB105) 24th November 2012 27 day(s) 0.0400 15.6 59 m – 130 m 18.86 km/s 67896 km/h
(2007 VB188) 25th November 2012 28 day(s) 0.1446 56.3 14 m – 32 m 10.32 km/s 37152 km/h
1 AU = ~150 million kilometers,1 LD = Lunar Distance = ~384,000 kilometers Source: NASA-NEO


Galactic Dinners –
The Milky Way Slowly Consuming Ancient Star Cluster

MessageToEagle.com – Based on current models, galaxies grow by consuming other star systems and the so-called galactic cannibalism process is widespread in the universe.

Around the Milky Way galaxy and in the vicinity of our immediate cosmic neighborhood, known as the “Local Group” of galaxies, traces of spiral galaxies swallowing dwarf galaxies have been known to astronomers since 1997.

Using the Sloan Digital Sky Survey, researchers have recently discovered a band of stars, or stellar stream.
It is the first of its kind found in the southern Galactic sky, a region that has been hard to examine due to a relative lack of deep-sky imaging there. Deeper imaging enables astronomers to detect fainter stars.


Credits: NASA
This stellar stream, named the Triangulum stream, could be the remnant of an ancient star cluster slowly being ingested by the Milky Way, Earth’s home galaxy.

“The Milky Way is constantly gobbling up small galaxies and star clusters,” said Ana Bonaca, a Yale graduate student and lead author of a study forthcoming in Astrophysical Journal Letters.


Click on image to enlarge

M33, the Triangulum Galaxy, is a perennial favorite of amateur and professional astronomers alike, due to its orientation and relative proximity to us. It is the second nearest spiral galaxy to our Milky Way (after M31, the Andromeda Galaxy) and a prominent member of the “local group” of galaxies. From our Milky Way perspective, M33’s stellar disk appears at moderate inclination, allowing us to see its internal structure clearly, whereas M31 is oriented nearly edge-on. The Galaxy Evolution Explorer imaged M33 as it appears in ultraviolet wavelengths. Credits: NASA/JPL-Caltech
The discovery will help astronomers reconstruct how the Milky Way’s mass is distributed, further revealing its dynamic structure.

“The more powerful gravity of our Milky Way pulls these objects apart and their stars then become part of the Milky Way itself.”


Researchers have previously found evidence of the Milky Way eating up dwarf galaxies.Bonaca argues that the newly found stellar stream is the remnant of a star cluster rather than of a larger galaxy, because the stream is very narrow.

“Our discovery is more of a light snack than a big meal for the Milky Way,” says Marla Geha, associate professor of astronomy at Yale and a co-author of the study.

“Studying this digestion process in detail is important because it gives us new insight into how all galaxies form and evolve.”


Galaxies are believed to form hierarchically through the merger of smaller galaxies and still smaller star clusters.
Stellar streams form as they are ripped apart by the gravitational force of galaxies.
This process may be the primary way galaxies such as the Milky Way grow in mass, the researchers say.


A map of stars in the outer region of the Milky Way as traced by the Sloan Digital Sky Survey. Streams of stars are seen throughout both the Northern (top) and Southern Galactic hemispheres, corresponding to small galaxies and star clusters which are in the process of being ingested by the Milky Way. The newest discovery is designated as the Triangulum Stream. Credits: yale.edu
Triangulum was found by searching a region recently surveyed by the Sloan Digital Sky Survey III (SDSS-III), an international collaboration that is mapping the sky through wide-field photometry.

Bonaca, Geha and co-author Nitya Kallivayalil, a Yale postdoctoral fellow, relied specifically on the survey’s Data Release 8, which included information about vast new areas of the southern galactic sky.

The study is available now on the arXiv preprint server.

MessageToEagle.com via cordis.europa.eu

See also:
ESA’s New Satellite Cheops Will Study Super-Earths


*************************************************************************************************************

Mysterious Booms / Rumblings

By: Meg Rossman

A loud, unexplained noise set off dozens of calls to the Niagara County Sheriff’s Office Friday morning after residents reported hearing an explosion so loud it shook their homes. YNN’s Meg Rossman reveals the source behind that explosion and why there’s no mystery behind that mystery boom.

NIAGARA COUNTY, N.Y. — It was the mystery boom heard ’round the world – or at least Niagara County that caused the Niagara County Sheriff’s Office to field dozens of calls similar to this exchange from concerned residents:

Dispatch: “Niagara County 911 what’s your emergency?”Caller: “…I heard an explosion and my windows all shook.

Dispatch: “You don’t see any fire or anything?

Caller: “No. No, I don’t.”

No fire and no damage but after several reports just after midnight Friday, Niagara County Undersheriff Michael J. Filicetti said deputies went to investigate.”We actually had several units respond down to the, mostly it was the Newfane area, Town of Somerset, Barker area,” he explained. “They checked around and couldn’t find anything.”

But they were offered plenty of suggestions, everything ranging from a sonic boom to a meteor.

“As of early this morning, we still hadn’t figured out what caused it,” Filicetti said.

According to officials at Columbia University, it’s not out of the question for tremors like Friday’s to be caused by landslides, sonic booms or even a meteor. In this case, however, the source turned out to be a 2.5 magnitude earthquake centered in the Town of Barker.

Dispatch: “Niagara County 9-1-1 what’s the address of your emergency?

Caller: “It’s not actually an emergency. I heard that explosion…”

So how do you explain that mystery boom?”They likely experienced a jolt and that jolt would likely set one’s house in motion and I suspect that’s the noise they heard,” Andrew Whittaker explained.

Whittaker, a structural engineering professor from the University at Buffalo, said it’s a common occurrence with minor earthquakes so close to the surface. According to the U.S. Geological Survey, the area sits on a fault line and experiences several very minor quakes every few years, though none of any apocalyptic proportions.

“We have no evidence whatsoever that a large magnitude event is around the corner,” Whittaker said.

Mystery solved.

*************************************************************************************************************

Biological Hazards / Wildlife

DNR: More than 11,000 deer dead of EHD

Virus will not impact this hunting season

  • By Steve Kelso

GRAND RAPIDS, Mich. (WOOD) – The number of Michigan deer dead of a virus continues to rise.

More than 11,000 deer that have been reported dead of epizootic hemorrhagic disease, or EHD, according to the Michigan Department of Natural Resources.

The disease causes extensive internal hemorrhages, according to the DNR. White-tailed deer usually develop symptoms seven days after exposure. Between eight and 36 hours after the start of symptoms like rapid pulse and breathing, fever and weakness, the deer lie down and die.

EHD is spread by a gnat called the midge — a species that multiplied well in this summer’s drought. It has been know to exist in Michigan for years, but this year’s outbreak is the worst in history.

“It is way worse than any other outbreak. We have had a few that got over 1,000 or maybe over a thousand a few years back, but this is by far the worst we have seen it,” said DNR Wildlife Biologist John Niewoonder.

The hardest-hit areas are in southwest Michigan, a DNR map shows. Ionia County has also seen a big outbreak. There have been 2,244 reported cases there. Kent County has had 1,637 reported cases.

The DNR says that the number of deer dead of EHD is actually much higher than the 11,000 or so reported, but admits that there is no telling exactly how many deer have died.

The DNR had hoped that by October, the numbers would be on the decrease because a hard freeze should kill off the midges.

Hunters should still feel free to hunt, the DNR says, and the agency will not put any limitations on deer hunting this year. But after this season concludes, the DNR will consider numbers gathered from deer check stations as they decide how many permits to issue next year.

“Typically these re-evaluations don’t result in big changes because the population just doesn’t change that much from one year to the next. This year may be different because of the disease. Hunters may notice bigger changes for next year than they normally would,” said Niewoonder.

It is important to put the number of dead deer in perspective. While there are more than 11,000 deer dead from EHD, hunters harvested more than 440,000 last year and an average of more than 50,000 die every year in car crashes.

The DNR says it does not anticipate that Michigan’s deer herd is in danger.

Humans cannot contract EHD. It occasionally infects domesticated animals — usually hoof stock, the DNR says — but they rarely get sick.

Online:

DNR field offices contact information

Details on this year’s EHD outbreak and FAQ

Watch video here

27.10.2012 Biological Hazard USA State of California, South Lake Tahoe Damage level Details

Biological Hazard in USA on Saturday, 27 October, 2012 at 17:27 (05:27 PM) UTC.

Description
A total of 3 chipmunks tested positive for the plague in the South Lake Tahoe area. California Department of Public Health tested 38 chipmunks and 3 squirrels for the plague during the this month’s surveillance effort, El Dorado County Department of Environmental Health spokesperson Karen Bender said. The department said the results of the tests are not surprising, but do warrant precaution. The plague is an infectious bacterial disease that is spread by wild rodents and their fleas. People can be infected by close contact with the rodents or their fleas. “Risk of transmission is significantly reduced during the winter months because rodents and their fleas are less active when the weather is cold,” Interim El Dorado County Health Officer, Dr. Robert Hartmann said. Cases of the plague are common in mountain and foothill areas of California, but cases in people are rare. The plague can be treated by antibiotics if detected early. Symptoms of the plague appear within two weeks of exposure and include fever, nausea, weakness and swollen lymph nodes.
Biohazard name: Yersinia pestis (chipmunks)
Biohazard level: 4/4 Hazardous
Biohazard desc.: Viruses and bacteria that cause severe to fatal disease in humans, and for which vaccines or other treatments are not available, such as Bolivian and Argentine hemorrhagic fevers, H5N1(bird flu), Dengue hemorrhagic fever, Marburg virus, Ebola virus, hantaviruses, Lassa fever, Crimean-Congo hemorrhagic fever, and other hemorrhagic or unidentified diseases. When dealing with biological hazards at this level the use of a Hazmat suit and a self-contained oxygen supply is mandatory. The entrance and exit of a Level Four biolab will contain multiple showers, a vacuum room, an ultraviolet light room, autonomous detection system, and other safety precautions designed to destroy all traces of the biohazard. Multiple airlocks are employed and are electronically secured to prevent both doors opening at the same time. All air and water service going to and coming from a Biosafety Level 4 (P4) lab will undergo similar decontamination procedures to eliminate the possibility of an accidental release.
Symptoms:
Status: confirmed

**************************************************************************************************************

Articles of Interest


Rocket Explosion:
New Space Debris Cloud Threatens Future Space Missions


MessageToEagle.com – ‘Briz-M’, a Russian rocket recently exploded into some 500 fragments. Most of the debris is now, floating in low Earth orbit.

The good news is that the ISS can avoid a possible collision.

The bad news is that this new space junk cloud has become a threat to future space missions.

The rocket was previously floating inert in space after it failed on a mission to deliver two satellites to its intended orbits in a botched August launch. The rocket engine stalled seven seconds after ignition, leaving some 10 to 15 tons of rocket fuel unused in its tanks. On October 16, Briz-M detonated and shattering into hundreds of fragments.

A proton-M rocket carrying Briz-M.
The debris from the explosion was first noticed by Australian astronomer Robert McNaught. Russia is carefully monitoring the fragments, but there is a risk the number may increase further as the space junk pieces collide with each other and break apart, an industry source told Interfax on Thursday.

The space junk poses no immediate danger, but could threaten future space missions. “We just expanded the list of potential threats with new entries,” the source explained.

The debris is spread across altitudes ranging from 250 to 5,000 kilometers.Both American and Russian space experts believe most of the scrap will continue to orbit the earth.

Air Force Lt. Col. Monica Matoush, a Pentagon spokesperson, said the U.S. military was tracking debris from the Breeze M breakup.

The Defense Department’s joint functional component command for space, known by the acronym JFCC-Space, monitors objects in orbit and issues collision alerts to U.S. government, international and commercial satellite owners.

“The resulting debris field and impact to space objects on orbit are being assessed at this time, however JFCC-Space is currently tracking over 500 pieces of debris,” Matoush said in an email Tuesday. ”

We expect that number to fluctuate as work to characterize the debris field continues.”

The explosion of Briz-M has cteared a space debris cloud that can threaten future space missions. Image credit: ESA


“Although some of the pieces have begun to re-enter, most of the debris will remain in orbit for an extended period of time,” US State Department spokesperson Jamie Mannina said in a statement.

The International Space Station orbits Earth at an altitude of about 400 kilometers. The station is not currently on a collision course with any of the fragments, and can be repositioned in the future if any danger arises.

Experts are worried how the debris cloud will affect future space missions.

© MessageToEagle.com

See also:
New Supercomputer Can Prevent Asteroid Impact By Using An Atomic Bomb

*************************************************************************************************************

[In accordance with Title 17 U.S.C. Section 107, this material is distributed without profit, for research and/or educational purposes. This constitutes ‘FAIR USE’ of any such copyrighted material.]

Earthquakes

USGS

MAG UTC DATE-TIME
y/m/d h:m:s
LAT
deg
LON
deg
DEPTH
km
 Region
MAP  4.2 2012/10/09 22:51:19  -43.470   172.780 9.0  SOUTH ISLAND OF NEW ZEALAND
MAP  2.7 2012/10/09 22:22:38   53.543  -166.035 48.8  FOX ISLANDS, ALEUTIAN ISLANDS, ALASKA
MAP  4.8   2012/10/09 22:14:23  -59.790   -26.637 99.1  SOUTH SANDWICH ISLANDS REGION
MAP  2.5 2012/10/09 21:01:35   63.001  -150.385 119.3  CENTRAL ALASKA
MAP  3.4 2012/10/09 20:56:13   18.760   -65.142 50.0  VIRGIN ISLANDS REGION
MAP  2.9 2012/10/09 19:18:45   18.376   -64.438 101.0  VIRGIN ISLANDS REGION
MAP  4.7   2012/10/09 18:34:51   -4.475   129.245 52.0  BANDA SEA
MAP  2.9 2012/10/09 17:24:37   58.717  -153.623 13.0  KODIAK ISLAND REGION, ALASKA
MAP  3.8 2012/10/09 17:21:40   19.493   -64.377 64.0  VIRGIN ISLANDS REGION
MAP  4.3 2012/10/09 16:11:58   20.759   122.184 158.2  BATAN ISLANDS REGION, PHILIPPINES
MAP  3.7 2012/10/09 16:06:50   19.627   -64.324 54.0  VIRGIN ISLANDS REGION
MAP  4.0 2012/10/09 15:50:55   24.438  -109.398 10.0  GULF OF CALIFORNIA
MAP  3.5 2012/10/09 15:21:30   19.566   -64.429 52.0  VIRGIN ISLANDS REGION
MAP  2.5 2012/10/09 13:03:32   62.862  -150.833 109.5  CENTRAL ALASKA
MAP  3.4 2012/10/09 13:00:02   33.711  -117.343 9.2  SOUTHERN CALIFORNIA
MAP  6.4   2012/10/09 12:32:04  -61.033   153.960 10.2  BALLENY ISLANDS REGION
MAP  4.5   2012/10/09 12:14:29  -23.428  -179.854 596.6  SOUTH OF THE FIJI ISLANDS
MAP  2.6 2012/10/09 11:24:56   60.114  -153.183 126.6  SOUTHERN ALASKA
MAP  3.0 2012/10/09 08:49:10   35.777   -97.163 5.0  OKLAHOMA
MAP  4.8   2012/10/09 07:57:52   -2.692   139.200 45.9  NEAR THE NORTH COAST OF PAPUA, INDONESIA
MAP  5.5   2012/10/09 07:49:54   -2.757   139.179 36.9  NEAR THE NORTH COAST OF PAPUA, INDONESIA
MAP  5.2   2012/10/09 07:14:59   -2.710   139.088 33.3  NEAR THE NORTH COAST OF PAPUA, INDONESIA
MAP  3.4 2012/10/09 04:55:44   62.780  -149.622 70.1  CENTRAL ALASKA
MAP  4.6   2012/10/09 04:41:59   4.856   96.543 54.2  NORTHERN SUMATRA, INDONESIA
MAP  4.7   2012/10/09 03:30:35  -29.413   -69.348 111.4  SAN JUAN, ARGENTINA
MAP  2.6 2012/10/09 03:00:53   47.103  -121.113 1.5  WASHINGTON
MAP  4.8   2012/10/09 00:30:21  -20.896  -174.074 27.7  TONGA
MAP  2.6 2012/10/09 00:11:32   18.950   -66.373 40.0  PUERTO RICO REGION

…………………………..

Seismic movement in Hunza: Landslides affect 15 families, damage infrastructure

A view of the mountains affected by tremors in Mayoon and Hussainabad villages of Hunza-Nagar District. PHOTO: SHABBIR MIR/THE EXPRESS TRIBUNE

GILGIT: At least 15 families have abandoned their houses due to landslides triggered by tremors in two villages of Hunza-Nagar District.

The landslides damaged a main water channel and other public and private property in Mayoon and Hussainabad villages.

“At least 15 families have moved in with their relatives in view of the looming threat,” Shahzad Hussain, a resident of the area told The Express Tribune on Monday. He said that the landslides started two weeks ago.

So far a main water channel, a link road and 12 electricity polls have been damaged. The landslides have also destroyed wild fruit trees.

“There is no light or no water in the area,” Hussain said, adding that the remaining villagers are also considering moving due to the  tremors. Complaints to officials over the disrupted water and electricity supply yielded no result.

Another resident said fissures have already appeared in the ground in some parts. He said the villagers who had moved away did so on the advice of experts sent by a non-governmental organisation.

Another villager said, “We hope the government will act swiftly to minimise our losses.”

Others were not as hopeful, saying that past landslides have devastated several houses, orchards and standing crops in Shinaki area, but the government did not do anything for the people.

Gilgit-Baltistan Disaster Management Authority Director Burhan Afandi said that the government is planning to conduct a survey in the area to find the cause behind landslides and tremors.

“Thirteen families have been relocated as a precautionary measure and we will be conducting a survey to find out the causes,” he said.

In 2010, the government had shifted 55 families from Hussainabad village to safer places due to landslides, but later the villages returned as the situation turned back to normal. According to the then Hunza deputy commissioner, fissures had developed on some parts of the surface, causing landslide in the region, which is on a fault line.

Published in The Express Tribune

Deformation of Earth’s crust to south of Baku can lead to serious quakes and narrowing of Caspian

Baku, Fineko/abc.az. American seismologist predicts an increase in seismic activity of Baku and on the Absheron peninsula.

At the International Seismology Conference taking place in Baku American scientist and seismologist Robert King has informed that in Baku and Absheron peninsula it is expected an increase in seismic activity as a result of compression fracture between the Minor and the Greater Caucasus.

“Our research showed that the Arabian and Eurasian lithospheric plate is characterized by high strength, and as a result they do not deform internally, and tremors are the result of oceanic activity, located between these territories. In the entire Caucasus a fault is observed, in the south and the north there is some movement and deformation in the lowlands between the Minor and the Greater Caucasus. In the Baku seismic zone the speed of fault is 12 mm a year over 100 km. At that, to the south of Baku it is observed fracture and displacement of the Earth’s crust in the direction of the Caspian Sea, where compression takes place that will lead to a narrowing of the Caspian Sea. At the same time, we find it difficult to predict the results of all the occurring processes,” he said.

According to Mr. King, in order to predict the results of the occurring processes it is needed to determine whether a similar contraction is in the depths of the earth, develop a range of different geodetic models, neotectonics, a map of faults that will be possible as the installation of 25 new seismic stations.

“To continue the research, stations should be installed at a distance of 5-10 km from each other on the perimeter of the fault. It is necessary to invest in this as much money as has already been invested in the purchase and installation of stations in order to study the processes occurring in the soil, as well as raising of the level of oil reservoirs. All these studies are important in order to determine possible effects of very large deformations that occur to the south of Baku, in order to prepare for a possible earthquake,” he said.

No tsunami threat from southwestern Pacific quake

By Star-Advertiser staff

A preliminary 6.4-magnitude earthquake struck 452 miles northwest of the Balleny Islands region early this morning at 2:32 a.m., but presented no tsunami threat to Hawaii, according to the Pacific Tsunami Warning Center.

The earthquake struck at a depth of about 6.3 miles.

The Balleny Islands are a series of uninhabited volcanic islands that are part of Antarctica.

LISS – Live Internet Seismic Server

GSN Stations

These data update automatically every 30 minutes. Last update: October 10, 2012 06:49:11 UTC

Seismograms may take several moments to load. Click on a plot to see larger image.

CU/ANWB, Willy Bob, Antigua and Barbuda

 ANWB 24hr plot

CU/BBGH, Gun Hill, Barbados

 BBGH 24hr plot

CU/BCIP, Isla Barro Colorado, Panama

 BCIP 24hr plot

CU/GRGR, Grenville, Grenada

 GRGR 24hr plot

CU/GRTK, Grand Turk, Turks and Caicos Islands

 GRTK 24hr plot

CU/GTBY, Guantanamo Bay, Cuba

 GTBY 24hr plot

CU/MTDJ, Mount Denham, Jamaica

 MTDJ 24hr plot

CU/SDDR, Presa de Sabaneta, Dominican Republic

 SDDR 24hr plot

CU/TGUH, Tegucigalpa, Honduras

 TGUH 24hr plot

IC/BJT, Baijiatuan, Beijing, China

 BJT 24hr plot

IC/ENH, Enshi, China

 ENH 24hr plot

IC/HIA, Hailar, Neimenggu Province, China

 HIA 24hr plot

IC/LSA, Lhasa, China

 LSA 24hr plot

IC/MDJ, Mudanjiang, China

 MDJ 24hr plot

IC/QIZ, Qiongzhong, Guangduong Province, China

 QIZ 24hr plot

IU/ADK, Aleutian Islands, Alaska, USA

 ADK 24hr plot

IU/AFI, Afiamalu, Samoa

 AFI 24hr plot

IU/ANMO, Albuquerque, New Mexico, USA

 ANMO 24hr plot

IU/ANTO, Ankara, Turkey

 ANTO 24hr plot

IU/BBSR, Bermuda

 BBSR 24hr plot

IU/BILL, Bilibino, Russia

 BILL 24hr plot

IU/CASY, Casey, Antarctica

 CASY 24hr plot

IU/CCM, Cathedral Cave, Missouri, USA

 CCM 24hr plot

IU/CHTO, Chiang Mai, Thailand

 CHTO 24hr plot

IU/COLA, College Outpost, Alaska, USA

 COLA 24hr plot

IU/COR, Corvallis, Oregon, USA

 COR 24hr plot

IU/CTAO, Charters Towers, Australia

 CTAO 24hr plot

IU/DAV,Davao, Philippines

 DAV 24hr plot

IU/DWPF,Disney Wilderness Preserve, Florida, USA

 DWPF 24hr plot

IU/FUNA,Funafuti, Tuvalu

 FUNA 24hr plot

IU/FURI, Mt. Furi, Ethiopia

 FURI 24hr plot

IU/GNI, Garni, Armenia

 GNI 24hr plot

IU/GRFO, Grafenberg, Germany

 GRFO 24hr plot

IU/GUMO, Guam, Mariana Islands

 GUMO 24hr plot

IU/HKT, Hockley, Texas, USA

 HKT 24hr plot

IU/HNR, Honiara, Solomon Islands

 HNR 24hr plot

IU/HRV, Adam Dziewonski Observatory (Oak Ridge), Massachusetts, USA

 HRV 24hr plot

IU/INCN, Inchon, Republic of Korea

 INCN 24hr plot

IU/JOHN, Johnston Island, Pacific Ocean

 JOHN 24hr plot

IU/KBS, Ny-Alesund, Spitzbergen, Norway

 KBS 24hr plot

IU/KEV, Kevo, Finland

 KEV 24hr plot

IU/KIEV, Kiev, Ukraine

 KIEV 24hr plot

IU/KIP, Kipapa, Hawaii, USA

 KIP 24hr plot

IU/KMBO, Kilima Mbogo, Kenya

 KMBO 24hr plot

IU/KNTN, Kanton Island, Kiribati

 KNTN 24hr plot

IU/KONO, Kongsberg, Norway

 KONO 24hr plot

IU/KOWA, Kowa, Mali

 KOWA 24hr plot

IU/LCO, Las Campanas Astronomical Observatory, Chile

 LCO 24hr plot

IU/LSZ, Lusaka, Zambia

 LSZ 24hr plot

IU/LVC, Limon Verde, Chile

 LVC 24hr plot

IU/MA2, Magadan, Russia

 MA2 24hr plot

IU/MAJO, Matsushiro, Japan

 MAJO 24hr plot

IU/MAKZ,Makanchi, Kazakhstan

 MAKZ 24hr plot

IU/MBWA, Marble Bar, Western Australia

 MBWA 24hr plot

IU/MIDW, Midway Island, Pacific Ocean, USA

 MIDW 24hr plot

IU/MSKU, Masuku, Gabon

 MSKU 24hr plot

IU/NWAO, Narrogin, Australia

 NWAO 24hr plot

IU/OTAV, Otavalo, Equador

 OTAV 24hr plot

IU/PAB, San Pablo, Spain

 PAB 24hr plot

IU/PAYG Puerto Ayora, Galapagos Islands

 PAYG 24hr plot

IU/PET, Petropavlovsk, Russia

 PET 24hr plot

IU/PMG, Port Moresby, Papua New Guinea

 PMG 24hr plot

IU/PMSA, Palmer Station, Antarctica

 PMSA 24hr plot

IU/POHA, Pohakaloa, Hawaii

 POHA 24hr plot

IU/PTCN, Pitcairn Island, South Pacific

 PTCN 24hr plot

IU/PTGA, Pitinga, Brazil

 PTGA 24hr plot

IU/QSPA, South Pole, Antarctica

 QSPA 24hr plot

IU/RAO, Raoul, Kermandec Islands

 RAO 24hr plot

IU/RAR, Rarotonga, Cook Islands

 RAR 24hr plot

IU/RCBR, Riachuelo, Brazil

 RCBR 24hr plot

IU/RSSD, Black Hills, South Dakota, USA

 RSSD 24hr plot

IU/SAML, Samuel, Brazil

 SAML 24hr plot

IU/SBA, Scott Base, Antarctica

 SBA 24hr plot

IU/SDV, Santo Domingo, Venezuela

 SDV 24hr plot

IU/SFJD, Sondre Stromfjord, Greenland

 SFJD 24hr plot

IU/SJG, San Juan, Puerto Rico

 SJG 24hr plot

IU/SLBS, Sierra la Laguna Baja California Sur, Mexico

 SLBS 24hr plot

IU/SNZO, South Karori, New Zealand

 SNZO 24hr plot

IU/SSPA, Standing Stone, Pennsylvania USA

 SSPA 24hr plot

IU/TARA, Tarawa Island, Republic of Kiribati

 TARA 24hr plot

IU/TATO, Taipei, Taiwan

 TATO 24hr plot

IU/TEIG, Tepich, Yucatan, Mexico

 TEIG 24hr plot

IU/TIXI, Tiksi, Russia

 TIXI 24hr plot

IU/TRIS, Tristan da Cunha, Atlantic Ocean

 TRIS 24hr plot

IU/TRQA, Tornquist, Argentina

 TRQA 24hr plot

IU/TSUM, Tsumeb, Namibia

 TSUM 24hr plot

IU/TUC, Tucson, Arizona

 TUC 24hr plot

IU/ULN, Ulaanbaatar, Mongolia

 ULN 24hr plot

IU/WAKE, Wake Island, Pacific Ocean

 WAKE 24hr plot

IU/WCI, Wyandotte Cave, Indiana, USA

 WCI 24hr plot

IU/WVT, Waverly, Tennessee, USA

 WVT 24hr plot

IU/XMAS, Kiritimati Island, Republic of Kiribati

 XMAS 24hr plot

IU/YAK, Yakutsk, Russia

 YAK 24hr plot

IU/YSS, Yuzhno Sakhalinsk, Russia

 YSS 24hr plot


***********************************************************************************************************

Extreme Temperatures/ Weather

09.10.2012 Forest / Wild Fire Bulgaria Sofia-Capital, [Vitosha Mountain] Damage level Details

Forest / Wild Fire in Bulgaria on Tuesday, 09 October, 2012 at 12:55 (12:55 PM) UTC.

Description
A large wildfire has erupted Tuesday around noon on the Vitosha Mountain just outside Bulgaria’s capital Sofia. Firefighters have been alerted by citizens about a blaze in the Mecha Polyana (Bear’s Glade) area between the Aleko center and the Bistrishko Branishte reserve in the mountain. The billowing smoke, fanned by high winds, is clearly visited from Sofia, which is located on Vitosha’s northern foothills. Bulgaria’s firefigthing service has reported that the blaze is hard to tackle due to the terrain and windy conditions. 70 firefighters and foresters have been sent to the location, which currently encompasses some 2.5 acres of alpine grassland and pine forest.

***********************************************************************************************************

Storms / Flooding

  Active tropical storm system(s)
Name of storm system Location Formed Last update Last category Course Wind Speed Gust Wave Source Details
Prapiroon (22W) Pacific Ocean 08.10.2012 10.10.2012 Typhoon III 295 ° 157 km/h 194 km/h 4.57 m JTWC Details

  Tropical Storm data

Share:
Storm name: Prapiroon (22W)
Area: Pacific Ocean
Start up location: N 17° 54.000, E 135° 42.000
Start up: 08th October 2012
Status: Active
Track long: 316.97 km
Top category.:
Report by: JTWC
Useful links:

Past track
Date Time Position Speed
km/h
Wind
km/h
Gust
km/h
Category Course Wave Pressure Source
08th Oct 2012 05:04:27 N 17° 54.000, E 135° 42.000 9 83 102 Tropical Storm 270 15 JTWC
09th Oct 2012 05:29:14 N 17° 42.000, E 132° 36.000 9 120 148 Typhoon I. 260 15 JTWC
Current position
Date Time Position Speed
km/h
Wind
km/h
Gust
km/h
Category Course Wave
feet
Pressure Source
10th Oct 2012 05:20:41 N 18° 24.000, E 130° 54.000 9 157 194 Typhoon III 295 ° 15 JTWC
Forecast track
Date Time Position Category Wind
km/h
Gust
km/h
Source
11th Oct 2012 12:00:00 N 19° 42.000, E 129° 12.000 SuperTyphoon 213 259 JTWC
11th Oct 2012 00:00:00 N 19° 12.000, E 129° 24.000 Typhoon IV 204 250 JTWC
12th Oct 2012 00:00:00 N 20° 24.000, E 129° 24.000 SuperTyphoon 213 259 JTWC
13th Oct 2012 00:00:00 N 21° 12.000, E 130° 18.000 Typhoon IV 204 250 JTWC
14th Oct 2012 00:00:00 N 22° 6.000, E 131° 12.000 Typhoon IV 194 241 JTWC
15th Oct 2012 00:00:00 N 23° 30.000, E 132° 48.000 Typhoon IV 176 213 JTWC
Today Flash Flood Russia [Asia] Republic of Dagestan, [Derbent City region] Damage level Details

Flash Flood in Russia [Asia] on Wednesday, 10 October, 2012 at 06:39 (06:39 AM) UTC.

Description
Heavy rains caused flooding that killed seven people in the southern Russian province of Dagestan on Wednesday, the Emergency Situations Ministry said. About 320 homes in the Caspian Sea coastal city of Derbent close to the Caucasus Mountains were flooded and seven bodies were found, the ministry said. In Derbent, warnings were issued from loudspeakers at mosques and mounted on cars dispatched around the city in the mostly Muslim province, Ekho Moskvy radio reported.

************************************************************************************************************

Epidemic Hazards / Diseases

Today Epidemic Puerto Rico [Statewide] Damage level Details

Epidemic in Puerto Rico on Wednesday, 10 October, 2012 at 03:12 (03:12 AM) UTC.

Description
Puerto Rico’s health department has declared a dengue epidemic. Health Secretary Lorenzo Gonzalez says at least six people have died, including two children younger than 10. A total of 4,816 cases have been reported, including 21 cases of the potentially fatal hemorrhagic dengue. The U.S. Centers for Disease Control and Prevention says 342 new cases were reported in one week last month, twice the number of cases during the same period last year. Dengue cases usually flare up from August to January. The mosquito-borne virus causes fever, severe headaches and extreme joint and muscle pain. Dengue claimed a record 31 lives during a 2010 epidemic that saw more than 12,000 suspected cases. Gonzalez made the announcement on Monday.
Biohazard name: Dengue Fever
Biohazard level: 3/4 Hight
Biohazard desc.: Bacteria and viruses that can cause severe to fatal disease in humans, but for which vaccines or other treatments exist, such as anthrax, West Nile virus, Venezuelan equine encephalitis, SARS virus, variola virus (smallpox), tuberculosis, typhus, Rift Valley fever, Rocky Mountain spotted fever, yellow fever, and malaria. Among parasites Plasmodium falciparum, which causes Malaria, and Trypanosoma cruzi, which causes trypanosomiasis, also come under this level.
Symptoms:
Status: confirmed

************************************************************************************************************

Climate Change


Vast differences in Antarctic and Arctic polar ocean microbial communities reported

Scientists uncover vast differences in Earth's polar ocean microbial communities


The Swedish icebreaker Oden off the coast of Antarctica, with an emperor penguin in the foreground. Credit: J. Wegelius. (Phys.org)—An international team of scientists, including a University of Michigan graduate student, has demonstrated that a clear difference exists between the marine microbial communities in the Southern and Arctic oceans, contributing to a better understanding of the biodiversity of marine life at the poles.
The most comprehensive comparison of microbial diversity at both of Earth’s polar oceans showed that about 75 percent of the organisms at each pole are different. This insight sheds light on newly recognized biodiversity patterns and reinforces the importance of studying Earth’s polar regions in the face of a changing climate. And it highlights the need for further research on the impacts of sea ice, seasonal shifts and freshwater input in both regions. “We believe that significant differences in the environmental conditions at each pole and unique selection mechanisms in the Arctic and Southern oceans are at play in controlling surface and deep-ocean community structure,” said Alison Murray, leader of the international team and an associate research professor at the Desert Research Institute in Reno, Nev.

The team reported its findings online Monday in the .

Scientists uncover vast differences in Earth's polar ocean microbial communities

A sample-collecting device called a rosette is lowered into the ocean off the coast of Antarctica. Credit: Lollie Garay. Kevin Bakker, a graduate student in the U-M Department of Ecology and Evolutionary Biology, is a co-author of the PNAS paper. Before arriving at U-M last month, Bakker conducted molecular and microbial marine science off the coast of Antarctica while working at the University of Georgia. The scientists found that the differences between the two poles were most pronounced in the microbial communities sampled from the coastal regions, which is “likely a result of the significant differences in freshwater sourcing to the two polar oceans,” said Jean-François Ghiglione, first author of the report and research professor at the French Microbial Oceanography Laboratory.

In the Southern Ocean, glacial melt water accounts for most of the freshwater that flows into the system, Ghiglione said. In contrast, the Arctic Ocean receives much bigger pulses of freshwater from several large river systems with huge continental drainage basins, in addition to glacial melt water. While the surface microbial communities appear to be dominated by environmental selection, the deep ocean communities are more constrained by historical events and connected through oceanic circulation, providing evidence for biogeographically defined communities in the global ocean. “Neither latitude nor temperature drove the composition of the surface bacterial communities directly. Rather, short-term effects such as seasonal river input or melting glaciers shaped community composition,” said U-M’s Bakker. “In contrast, it seems like the deep oceans are driven more by long-term changes.”

Scientists uncover vast differences in Earth's polar ocean microbial communities


U-M graduate student Kevin Bakker in a laboratory aboard the icebreaker Oden. After collecting water samples, Bakker filtered the water to extract microbial DNA, then sent the genetic material to another lab for sequencing. Credit: Patricia Yager. The collaboration involved scientists from six countries: Canada, France, New Zealand, Spain, Sweden and the United States. The project was made possible through the International Polar Year, a global research campaign, and the Sloan Foundation’s Census of Marine Life Program, which stimulated field efforts at both poles, along with a separate program targeting marine microbes, the International Census of Marine Microbes. In addition, the national polar research programs from each of the six contributing nations, including the U.S. National Science Foundation, supported field expeditions. “The collective energies required to bring this study to fruition was remarkable,” Murray said. “By using similar strategies and technologies in sample collection through next-generation sequencing, we have a highly comparable, unprecedented data set that for the first time has allowed us to take an in-depth look across a large number of samples into the similarities of the microbial communities between the two polar oceans.” Scientists compared 20 samples from the Southern Ocean against 24 samples from the Arctic Ocean taken from both surface and deep-water sites. They also included an additional 48 samples from Earth’s lower latitudes to investigate the polar signal in global marine bacterial biogeography. The researchers specifically compared samples from coastal and open oceans and between winter and summer seasons to test whether or how environmental conditions and dispersal patterns shape microbial communities in the polar oceans. Samples were processed and analyzed by the International Census of Marine Microbes using an identical approach based on pyrosequencing and involving more than 800,000 sequences from each of the 92 samples. “Our analyses identified a number of key organisms in both poles in the surface and deep-ocean waters that are important in driving the differences between the communities,” Murray said. “Still, further research is needed to address the ecological and evolutionary processes that underlie these unique patterns.”

More information: “Pole-to-pole biogeography of surface and deep marine bacterial communities,” by Jean-Francois Ghiglione et al. doi: 10.1073/pnas.1208160109

Read more at: http://phys.org/news/2012-10-vast-differences-antarctic-arctic-polar.html#jCp

Journal reference: Proceedings of the National Academy of Sciences search and more info website

Provided by University of Michigan search and more info website

************************************************************************************************************

Solar Activity

3MIN News October 9. 2012

Published on Oct 9, 2012 by

Pole Shift Video: http://youtu.be/uI10tKuLtFU
STARWATER: http://youtu.be/LiC-92YgZvQ

TODAY’S LINKS
SpaceX Fail: http://cosmiclog.nbcnews.com/_news/2012/10/08/14297705-spacex-launch-problems…
Polar Biodiversity: http://phys.org/news/2012-10-vast-differences-antarctic-arctic-polar.html

REPEAT LINKS
Spaceweather: http://spaceweather.com/ [Look on the left at the X-ray Flux and Solar Wind Speed/Density]

HAARP: http://www.haarp.alaska.edu/haarp/data.html [Click online data, and have a little fun]

CERES JPL: http://ssd.jpl.nasa.gov/sbdb.cgi?sstr=ceres;orb=1;cov=0;log=0;cad=0#orb

SDO: http://sdo.gsfc.nasa.gov/data/ [Place to find Solar Images and Videos – as seen from earth]

SOHO: http://sohodata.nascom.nasa.gov/cgi-bin/soho_movie_theater [SOHO; Lasco and EIT – as seen from earth]

Stereo: http://stereo.gsfc.nasa.gov/cgi-bin/images [Stereo; Cor, EUVI, HI – as seen from the side]

SunAEON:http://www.sunaeon.com/#/solarsystem/ [Just click it… trust me]

SOLARIMG: http://solarimg.org/artis/ [All purpose data viewing site]

iSWA: http://iswa.gsfc.nasa.gov/iswa/iSWA.html [Free Application; for advanced sun watchers]

NASA ENLIL SPIRAL: http://iswa.gsfc.nasa.gov:8080/IswaSystemWebApp/iSWACygnetStreamer?timestamp=…
NOAA ENLIL SPIRAL: http://www.swpc.noaa.gov/wsa-enlil/

US Wind Map: http://hint.fm/wind/

NOAA Bouys: http://www.ndbc.noaa.gov/

NOAA Environmental Visualization Laboratory: http://www.nnvl.noaa.gov/Default.php

RSOE: http://hisz.rsoe.hu/alertmap/index2.php [That cool alert map I use]

GOES Xray: http://www.swpc.noaa.gov/sxi/goes15/index.html

JAPAN Radiation Map: http://jciv.iidj.net/map/

LISS: http://earthquake.usgs.gov/monitoring/operations/heliplots_gsn.php

Gamma Ray Bursts: http://grb.sonoma.edu/ [Really? You can’t figure out what this one is for?]

BARTOL Cosmic Rays: http://neutronm.bartol.udel.edu//spaceweather/welcome.html [Top left box, look for BIG blue circles]

TORCON: http://www.weather.com/news/tornado-torcon-index [Tornado Forecast for the day]

GOES Weather: http://rsd.gsfc.nasa.gov/goes/ [Clouds over America]

RAIN RECORDS: http://www.cocorahs.org/ViewData/ListIntensePrecipReports.aspx

EL DORADO WORLD WEATHER MAP: http://www.eldoradocountyweather.com/satellite/ssec/world/world-composite-ir-…

PRESSURE MAP: http://www.woweather.com/cgi-bin/expertcharts?LANG=us&MENU=0000000000&…

HURRICANE TRACKER: http://www.weather.com/weather/hurricanecentral/tracker

INTELLICAST: http://www.intellicast.com/ [Weather site used by many youtubers]

NASA News: http://science.nasa.gov/science-news/science-at-nasa/

PHYSORG: http://phys.org/ [GREAT News Site!]

QUAKES LIST FULL: http://www.emsc-csem.org/Earthquake/seismologist.php

ACTIVE SUNSPOT:

A sunspot, currently located on the farside of the sun, is about to emerge over the sun’s southeastern limb. It is crackling with M-class solar flares and could bring a significant uptick in solar activity.

************************************************************************************************************

Space

Earth approaching objects (objects that are known in the next 30 days)

Object Name Apporach Date Left AU Distance LD Distance Estimated Diameter* Relative Velocity
(1994 EK) 14th October 2012 4 day(s) 0.1356 52.8 230 m – 520 m 12.22 km/s 43992 km/h
(2012 PA20) 15th October 2012 5 day(s) 0.1502 58.5 100 m – 230 m 10.36 km/s 37296 km/h
(2012 RV16) 18th October 2012 8 day(s) 0.1270 49.4 310 m – 700 m 16.14 km/s 58104 km/h
214869 (2007 PA8) 05th November 2012 26 day(s) 0.0433 16.8 1.5 km – 3.3 km 10.79 km/s 38844 km/h
(2011 UG21) 06th November 2012 27 day(s) 0.1784 69.4 340 m – 760 m 19.73 km/s 71028 km/h
(2010 WT) 07th November 2012 28 day(s) 0.1251 48.7 53 m – 120 m 6.53 km/s 23508 km/h
1 AU = ~150 million kilometers,1 LD = Lunar Distance = ~384,000 kilometers Source: NASA-NEO

DRAGON AND THE ISS:

Laden with supplies, SpaceX’s Dragon spacecraft is approaching the International Space Station for docking on Wednesday, Oct. 10th. Last night, David Blanchard saw the commercial spacecraft chasing the ISS across the sky above Flagstaff, Arizona:

“The Dragon capsule raced to catch the ISS as the pair moved across the western sky separated by about 20 seconds,” says Blanhard. “This image is a single 30-s exposure that shows the separation and how Dragon trails ISS.”

On Wednesday, these two streaks will merge. As the Dragon approaches the ISS, astronaut and station commander Suni Williams will reach out with the station’s robot arm to grapple the capsule. The spacecraft will then be joined to one of the station’s ports where astronauts will unload its 1,000 pounds of food, clothing, science gear and other items. Later, the astronauts will load almost 2,000 pounds of used equipment and experiments into the Dragon to be returned to Earth safely in about three weeks.

GEOMAGNETIC ACTIVITY CONTINUES:

For the third day in a row, geomagnetic storms are circling the poles. In North America, auroras have spilled across the Canadian border descending as far south as Utah, Colorado, Kansas, and Nebraska. The best place to see the show, according to pilot Matt Melnyk, is from the window of an airplane:

“I photographed an unbelievable display from the cockpit at 21,000 feet while flying across Alberta Canada,” says Melnyk. “Being the pilot we get a front row view of the amazing aurora and this display was nothing less than spectacular!”

The storms were instigated by a CME strike on Oct. 8th and they are about to be re-energized by a solar wind stream due to hit Earth’s magnetic field on Oct. 10th. NOAA forecasters estimate a 40% chance of strong geomagnetic storms during the next 24 hours, so high-latitude sky watchers should remain alert for auroras


*************************************************************************************************************

Biological Hazards / Wildlife / Hazmat

Biological Hazard in South Africa on Tuesday, 09 October, 2012 at 09:55 (09:55 AM) UTC.

Description
A large section of coastline in South Africa has been closed after a 30-metre whale washed ashore following an attack by Great White sharks. The whale was removed from the surf after its carcass attracted high numbers of Great Whites to the coast by Muizenberg beach, near Cape Town, on Sunday. Authorities have since taken the southern right whale from the beach but have closed off a stretch of shore from Muizenberg to Monwabisi ‘as a precaution’. Disaster response teams had moved swiftly to get the animal out of the water and onto a flat-bed truck. Wilfred Solomons-Johannes, a spokesman for Cape Town’s disaster risk management centre, said: ‘A decision was taken to begin the recovery operation immediately because of the increase of shark activity off beaches along the False Bay coastline.’ The warning did not stop curious onlookers streaming to the site. Claire McKinnon, manager of the Cape Town cleansing and solid-waste management department, said samples were taken from the carcass to enable pathologists to establish the cause of death before it was disposed of at a landfill site. Once the whale was out of the water, a bulldozer rolled it over the sand. Solomons-Johannes said it was not known whether the whale was alive when the sharks attacked it or had succumbed to an illness. ‘Under normal circumstances predators such as sharks often sneak up on their prey from behind or underneath. Predators don’t usually face off in a fight,’ he said. ‘A predator goes in quickly and quietly attacks the prey. Predators choose the ill, injured, young or old animals to hunt because they are easier to catch.’
Biohazard name: Shark Attack (Great White Shark)
Biohazard level: 1/4 Low
Biohazard desc.: Bacteria and viruses including Bacillus subtilis, canine hepatitis, Escherichia coli, varicella (chicken pox), as well as some cell cultures and non-infectious bacteria. At this level precautions against the biohazardous materials in question are minimal, most likely involving gloves and some sort of facial protection. Usually, contaminated materials are left in open (but separately indicated) waste receptacles. Decontamination procedures for this level are similar in most respects to modern precautions against everyday viruses (i.e.: washing one’s hands with anti-bacterial soap, washing all exposed surfaces of the lab with disinfectants, etc). In a lab environment, all materials used for cell and/or bacteria cultures are decontaminated via autoclave.
Symptoms:
Status: confirmed
09.10.2012 Biological Hazard Zimbabwe Province of Manicaland, [Buhera, Mutare, Mutasa and Chipinge districts] Damage level Details

Biological Hazard in Zimbabwe on Tuesday, 09 October, 2012 at 08:57 (08:57 AM) UTC.

Description
Anthrax has killed hundreds of animals mostly in the communal parts of Manicaland within the past two months, and veterinary experts say the risk of the hemorrhagic infection may be greater with drought covering much of the province. Though there were no immediate reports of human deaths in the outbreak, health authorities in Manicaland have recorded several hospitalised cases following the consumption of infected carcasses.
Humans usually get anthrax through direct contact with infected livestock, often when spores get into a cut on the skin or eating infected carcasses. Without treatment, anthrax can be fatal, but early treatment with antibiotics is very effective. Dr Kurai Pride Kapondo, the acting provincial veterinary officer for Manicaland, confirmed the developments, adding that Anthrax cases have frequently been documented in Buhera, Mutare, Mutasa and Chipinge districts. The movement of cattle from these affected districts has been suspended with immediate effect, and those caught moving animals from these affected areas will be penalised because the spread of the disease is partially blamed on illegal animal movements. Natural anthrax is endemic in Zimbabwe where its bacillus spores can live for decades in dry soil and are ingested by animals ruminating for remnants of vegetation in the driest months of September and October. Anthrax outbreaks happen occasionally in livestock herds and wild animals in Zimbabwe, usually in the Gonarezhou area. Animals typically contract the disease by ingesting or inhaling spores that can survive in soil for decades. Once infected, livestock can die within hours. Anthrax bacteria react to drought and other harsh conditions by producing more spores, and experts said conditions are ripe for disease this year. A drought stretches throughout the entirety of Manicaland. “The division of veterinary field services would like to inform the general public that there have been cases of anthrax in Manicaland Province. Anthrax is a notifiable disease and the division of veterinary services must be notified of suspected cases,” said Dr Kapondo, adding that the disease presents itself as sudden death and animals are found with tarry blood oozing from the nose, mouth and anus. “Carcasses bloat and decompose very rapidly. The carcasses of suspected anthrax cases should never be opened and the meat should never be consumed. Should a case of anthrax occur on your farm, you may help to stop the spread of infection by burning or burying dead animals, and disinfecting the place using the most effective disinfectants like quicklime, formalin or caustic soda,” said Dr Kapondo.
The veterinary department is suffering from perennial shortage of vaccines and farmers are being encouraged to purchase their own vaccines.
Biohazard name: Anthrax
Biohazard level: 4/4 Hazardous
Biohazard desc.: Viruses and bacteria that cause severe to fatal disease in humans, and for which vaccines or other treatments are not available, such as Bolivian and Argentine hemorrhagic fevers, H5N1(bird flu), Dengue hemorrhagic fever, Marburg virus, Ebola virus, hantaviruses, Lassa fever, Crimean-Congo hemorrhagic fever, and other hemorrhagic or unidentified diseases. When dealing with biological hazards at this level the use of a Hazmat suit and a self-contained oxygen supply is mandatory. The entrance and exit of a Level Four biolab will contain multiple showers, a vacuum room, an ultraviolet light room, autonomous detection system, and other safety precautions designed to destroy all traces of the biohazard. Multiple airlocks are employed and are electronically secured to prevent both doors opening at the same time. All air and water service going to and coming from a Biosafety Level 4 (P4) lab will undergo similar decontamination procedures to eliminate the possibility of an accidental release.
Symptoms:
Status: confirmed
10.10.2012 HAZMAT South Korea Province of Gyeonggi, Gumi Damage level Details

HAZMAT in South Korea on Saturday, 06 October, 2012 at 10:55 (10:55 AM) UTC.

Back

Updated: Wednesday, 10 October, 2012 at 03:17 UTC
Description
A chemical leak at a plant in Gumi, S Korea, about 10 km from US army base Camp Carroll, killed five people and injured 18 others 27 September but details of the extent of the damage are only now becoming clear, with officials declaring it a disaster area Monday 8 October. People living within one kilometre of the plant were evacuated and 3,000 people are reported to have been sickened by the hydrofluoric acid leak, reports RT. The area southeast of the capital Seoul is known as Korea’s Silicon Valley.

**************************************************************************************************************

Articles of Interest

Today Power Outage USA State of Texas, [Lower Valley] Damage level Details

Power Outage in USA on Wednesday, 10 October, 2012 at 03:18 (03:18 AM) UTC.

Description
A power outage in the Lower Valley left 13,800 customers without electricity and numerous intersections without working traffic lights. The outage began around 2:16 p.m. and was restored by 3:06 p.m., according to El Paso Electric officials. Police responded to multiple traffic-related calls in the affect area. Officials said the outage affected the Border Highway area all the way to the Yarbrough Drive exit. The cause of the outage is still unknown, but officials said it has something to do with equipment failure at the Ascarate substation. The cause of the outage is unknown, and according to the outage map, repairs may be completed within three hours.

*************************************************************************************************************

[In accordance with Title 17 U.S.C. Section 107, this material is distributed without profit, for research and/or educational purposes. This constitutes ‘FAIR USE’ of any such copyrighted material.]

Earthquakes

USGS

MAG UTC DATE-TIME
y/m/d h:m:s
LAT
deg
LON
deg
DEPTH
km
 Region
MAP  2.9 2012/10/07 23:48:20   19.083   -64.763 37.0  VIRGIN ISLANDS REGION
MAP  3.0 2012/10/07 23:34:07   19.085   -64.797 19.0  VIRGIN ISLANDS REGION
MAP  3.3 2012/10/07 23:31:10   18.962   -64.695 52.0  VIRGIN ISLANDS REGION
MAP  3.0 2012/10/07 23:14:56   59.767  -151.986 54.5  KENAI PENINSULA, ALASKA
MAP  2.7 2012/10/07 21:10:23   49.483  -120.490 0.0  BRITISH COLUMBIA, CANADA
MAP  2.7 2012/10/07 21:04:00   18.420   -64.879 83.0  VIRGIN ISLANDS REGION
MAP  3.4 2012/10/07 16:53:10   19.600   -64.442 47.0  VIRGIN ISLANDS REGION
MAP  2.5 2012/10/07 13:25:09   33.986  -117.189 14.2  GREATER LOS ANGELES AREA, CALIFORNIA
MAP  3.1 2012/10/07 12:59:21   19.155   -64.604 82.0  VIRGIN ISLANDS REGION
MAP  3.0 2012/10/07 12:44:53   18.145   -64.599 3.0  VIRGIN ISLANDS REGION
MAP  3.0 2012/10/07 12:12:06   19.093   -65.859 13.0  PUERTO RICO REGION
MAP  2.9 2012/10/07 12:01:34   18.978   -64.108 39.0  VIRGIN ISLANDS REGION
MAP  5.3   2012/10/07 11:42:51   40.737   48.470 40.9  AZERBAIJAN
MAP  4.5   2012/10/07 11:34:14   -7.423   124.922 376.0  BANDA SEA
MAP  3.2 2012/10/07 11:19:37   19.658   -64.352 47.0  VIRGIN ISLANDS REGION
MAP  4.3 2012/10/07 11:08:55   -3.211   135.196 32.8  PAPUA, INDONESIA
MAP  3.3 2012/10/07 11:06:20   19.926   -64.301 49.0  NORTH OF THE VIRGIN ISLANDS
MAP  3.2 2012/10/07 10:17:13   59.028  -154.559 135.7  SOUTHERN ALASKA
MAP  4.5   2012/10/07 09:16:49   12.368   -89.199 35.0  OFF THE COAST OF EL SALVADOR
MAP  5.3   2012/10/07 08:36:32   -5.533   151.810 35.3  NEW BRITAIN REGION, PAPUA NEW GUINEA
MAP  2.9 2012/10/07 08:34:03   18.899   -64.974 19.0  VIRGIN ISLANDS REGION
MAP  3.6 2012/10/07 07:49:31   18.015   -68.561 97.0  DOMINICAN REPUBLIC REGION
MAP  3.1 2012/10/07 07:44:51   19.786   -64.281 30.0  NORTH OF THE VIRGIN ISLANDS
MAP  2.7 2012/10/07 07:41:26   18.562   -64.104 24.0  VIRGIN ISLANDS REGION
MAP  3.1 2012/10/07 07:39:36   17.543   -68.570 37.0  DOMINICAN REPUBLIC REGION
MAP  4.7   2012/10/07 07:38:46  -15.420  -172.065 10.0  SAMOA ISLANDS REGION
MAP  4.4 2012/10/07 07:00:55   9.685   -85.056 23.7  OFF THE COAST OF COSTA RICA
MAP  3.2 2012/10/07 06:10:09   18.890   -65.249 13.0  PUERTO RICO REGION
MAP  3.0 2012/10/07 06:09:00   19.027   -64.584 18.0  VIRGIN ISLANDS REGION
MAP  2.9 2012/10/07 05:45:23   19.094   -64.508 35.0  VIRGIN ISLANDS REGION
MAP  5.6   2012/10/07 03:14:23   18.550   120.959 33.1  LUZON, PHILIPPINES
MAP  3.4 2012/10/07 03:07:43   19.631   -64.387 50.0  VIRGIN ISLANDS REGION
MAP  3.7 2012/10/07 02:48:34   19.457   -64.256 81.0  VIRGIN ISLANDS REGION
MAP  4.4 2012/10/07 02:32:07   54.567   167.322 25.4  KOMANDORSKIYE OSTROVA, RUSSIA REGION
MAP  4.7   2012/10/07 01:56:51  -20.659  -174.094 21.8  TONGA

MAG UTC DATE-TIME
y/m/d h:m:s
LAT
deg
LON
deg
DEPTH
km
 Region
MAP  2.7 2012/10/06 23:42:18   41.274  -123.381 40.4  NORTHERN CALIFORNIA
MAP  2.6 2012/10/06 22:57:02   61.735  -150.726 55.1  SOUTHERN ALASKA
MAP  4.1 2012/10/06 22:49:37  -32.097   -72.290 15.2  OFFSHORE COQUIMBO, CHILE
MAP  2.7 2012/10/06 22:11:34   55.639  -161.901 166.7  ALASKA PENINSULA
MAP  2.5 2012/10/06 21:58:29   33.456  -116.388 5.5  SOUTHERN CALIFORNIA
MAP  2.7 2012/10/06 20:15:36   60.232  -141.851 36.3  SOUTHERN ALASKA
MAP  2.6 2012/10/06 16:59:06   19.259  -155.287 32.7  ISLAND OF HAWAII, HAWAII
MAP  2.9 2012/10/06 15:01:11   57.067  -157.532 6.1  ALASKA PENINSULA
MAP  2.7 2012/10/06 10:25:44   59.825  -141.784 5.0  SOUTHEASTERN ALASKA
MAP  4.7   2012/10/06 09:27:41   41.113   88.308 36.1  SOUTHERN XINJIANG, CHINA
MAP  4.1 2012/10/06 08:49:17   23.769  -108.551 10.1  GULF OF CALIFORNIA
MAP  3.3 2012/10/06 08:40:51   62.423  -153.554 37.8  CENTRAL ALASKA
MAP  4.1 2012/10/06 08:35:37   19.436  -109.056 10.0  REVILLA GIGEDO ISLANDS REGION
MAP  4.5   2012/10/06 07:56:29  -25.457  -177.582 150.0  SOUTH OF THE FIJI ISLANDS
MAP  3.4 2012/10/06 06:15:15   19.693   -64.379 28.0  VIRGIN ISLANDS REGION
MAP  3.2 2012/10/06 05:32:16   18.969   -64.278 64.0  VIRGIN ISLANDS REGION
MAP  4.6   2012/10/06 05:27:44   31.424   140.165 153.2  IZU ISLANDS, JAPAN REGION
MAP  3.3 2012/10/06 04:43:03   19.525   -64.421 55.0  VIRGIN ISLANDS REGION
MAP  4.9   2012/10/06 03:40:04   23.833   -45.674 9.9  NORTHERN MID-ATLANTIC RIDGE
MAP  4.6   2012/10/06 03:18:16  -32.172   -72.138 12.3  OFFSHORE VALPARAISO, CHILE
MAP  2.6 2012/10/06 03:01:36   61.519  -146.737 49.0  SOUTHERN ALASKA
MAP  4.8   2012/10/06 01:19:35   76.129   7.725 10.0  SVALBARD REGION
MAP  3.2 2012/10/06 00:31:54   60.497  -152.071 16.9  SOUTHERN ALASKA

MAG UTC DATE-TIME
y/m/d h:m:s
LAT
deg
LON
deg
DEPTH
km
 Region
MAP  3.3 2012/10/05 23:07:26   41.349  -117.348 0.0  NEVADA
MAP  3.4 2012/10/05 22:37:55   58.209  -137.906 0.0  SOUTHEASTERN ALASKA
MAP  3.2 2012/10/05 20:51:27   43.771  -127.756 10.0  OFF THE COAST OF OREGON
MAP  2.8 2012/10/05 20:32:11   47.709  -122.613 26.2  SEATTLE-TACOMA URBAN AREA, WASHINGTON
MAP  5.0   2012/10/05 20:02:09   23.502  -108.680 1.0  GULF OF CALIFORNIA
MAP  2.6 2012/10/05 19:54:29   32.205  -115.280 35.0  BAJA CALIFORNIA, MEXICO
MAP  3.2 2012/10/05 19:45:33   18.518   -66.071 119.0  PUERTO RICO REGION
MAP  3.2 2012/10/05 19:42:54   58.162  -153.726 99.0  KODIAK ISLAND REGION, ALASKA
MAP  5.4   2012/10/05 18:22:58   13.032   -91.557 50.9  OFF THE COAST OF GUATEMALA
MAP  5.0   2012/10/05 18:08:20   -6.673   129.509 157.2  BANDA SEA
MAP  4.5   2012/10/05 17:56:02  -15.542   -70.700 185.2  SOUTHERN PERU
MAP  3.0 2012/10/05 17:12:44   19.047   -64.315 63.0  VIRGIN ISLANDS REGION
MAP  2.9 2012/10/05 17:11:53   19.233   -64.451 24.0  VIRGIN ISLANDS REGION
MAP  2.5 2012/10/05 17:05:21   19.380  -155.238 3.8  ISLAND OF HAWAII, HAWAII
MAP  3.3 2012/10/05 13:58:11   19.129   -64.295 58.0  VIRGIN ISLANDS REGION
MAP  2.9 2012/10/05 13:57:01   18.777   -64.128 69.0  VIRGIN ISLANDS REGION
MAP  3.3 2012/10/05 13:32:58   19.649   -64.397 8.0  VIRGIN ISLANDS REGION
MAP  2.7 2012/10/05 13:14:47   19.108   -64.405 44.0  VIRGIN ISLANDS REGION
MAP  3.0 2012/10/05 13:11:09   19.182   -64.559 7.0  VIRGIN ISLANDS REGION
MAP  2.6 2012/10/05 12:39:03   18.809   -64.120 70.0  VIRGIN ISLANDS REGION
MAP  3.0 2012/10/05 12:35:36   19.177   -64.409 45.0  VIRGIN ISLANDS REGION
MAP  3.2 2012/10/05 12:28:00   19.033   -64.353 60.0  VIRGIN ISLANDS REGION
MAP  3.3 2012/10/05 11:59:32   19.629   -64.393 13.0  VIRGIN ISLANDS REGION
MAP  4.2 2012/10/05 11:23:01   19.471   -64.115 86.0  VIRGIN ISLANDS REGION
MAP  4.5   2012/10/05 11:19:23  -23.038  -175.509 35.0  TONGA REGION
MAP  4.4 2012/10/05 10:25:28   39.369   33.833 4.8  CENTRAL TURKEY
MAP  5.0   2012/10/05 08:13:19   26.233   125.176 154.7  NORTHEAST OF TAIWAN
MAP  4.0 2012/10/05 06:37:31   19.961   -65.465 36.0  PUERTO RICO REGION
MAP  4.4 2012/10/05 04:55:52   11.931   -86.656 100.0  NEAR THE COAST OF NICARAGUA
MAP  3.1 2012/10/05 04:38:39   19.642   -64.378 40.0  VIRGIN ISLANDS REGION
MAP  3.3 2012/10/05 04:03:31   19.078   -64.707 78.0  VIRGIN ISLANDS REGION
MAP  3.0 2012/10/05 03:25:18   19.132   -64.382 52.0  VIRGIN ISLANDS REGION
MAP  3.3 2012/10/05 02:36:23   18.940   -64.274 66.0  VIRGIN ISLANDS REGION
MAP  3.1 2012/10/05 02:23:54   18.963   -64.271 68.0  VIRGIN ISLANDS REGION
MAP  2.7 2012/10/05 02:17:31   19.108   -64.314 53.0  VIRGIN ISLANDS REGION
MAP  3.0 2012/10/05 02:08:30   18.969   -64.384 59.0  VIRGIN ISLANDS REGION
MAP  3.5 2012/10/05 01:17:22   35.928  -117.680 2.7  CENTRAL CALIFORNIA
MAP  3.4 2012/10/05 01:10:44   19.236   -64.360 46.0  VIRGIN ISLANDS REGION
MAP  5.7   2012/10/05 00:19:57   17.496   -46.461 10.0  NORTHERN MID-ATLANTIC RIDGE
MAP  5.5   2012/10/05 00:15:42   17.509   -46.465 10.0  NORTHERN MID-ATLANTIC RIDGE

……………………………

‘Silent Earthquakes’ Ripple Under Cascadia

Credit Pacific Northwest Seismic Network
The past five weeks saw two swarms of “slow slip and tremor” in the Northwest.

Parts of Washington and Oregon are in the midst of silent earthquakes this week. You can’t feel this so-called “slow slip” quake and it doesn’t cause damage. Still, scientists want to learn more about the recently discovered phenomenon.

Little is certain so far, but there’s a possibility these deep tremors could trigger a damaging earthquake or serve as a warning bell for the Big One.

A bank of computer monitors covers one wall of the University of Washington seismology lab. Some display seismograph readouts that look like jagged mountain ranges stacked one over the other. A big screen shows a current map of tremors under the Pacific Northwest. It is lit up with activity.

“Each dot represents the location of a five minute burst of tremor,” says earth scientist Ken Creager.

He scrutinizes a dense slash of blue, yellow, green and red dots. The arc stretches south from mid-Vancouver Island, goes under the Olympic Peninsula, Puget Sound and peters out south of Olympia. A separate patch of color radiates out from near Roseburg, Ore.

Washington State Seismologist John Vidale is also keeping an eye on the busy map.

“This kind of earthquake is distinctly different than the earthquakes we have been watching for a hundred years, because this patch of fault that we’re watching takes three weeks to break. Whereas ordinarily something a hundred miles long would take a minute or less to break.”

“About half of our instruments can see it,” Vidale adds. “It’s a very slight level of rattling. I don’t think I have ever heard of somebody who we believed could feel it.”

Local seismologists woke up to the phenomenon about a decade ago and have since discovered a big non-volcanic tremor swarm happens fairly routinely around here — every 14 months or so in western Washington, a little less often in Oregon and more often in northern California.

Scientists have coined a variety of names including “slow slip quake” or “episodic tremor and slip” to describe what they’re seeing.

Vidale says the mechanisms at work deep underground remain fairly mysterious. This current slow slip quake under the Salish Sea has lasted five weeks. Creager says scientists have calculated that a significant event like this releases the equivalent energy of a magnitude 6.5 regular quake.

“It’s a lot of energy being released,” Creager says. “It just happens so slowly that you’re not going to feel it. This is the way we like to see energy released.”

But there’s a flip side. The grinding and slippage at depth increases the strain closer to the surface where the North American plate and the oceanic plate are stuck together or “locked.” When that offshore fault zone eventually gives way, we get the damaging Big One.

University of Oregon Professor David Schmidt makes an analogy to a car teetering partway over a cliff.

“And these small slow slip events are somebody standing behind that car giving it a little nudge every several months. So even though the nudge is small, at some point that nudge might be enough to kind of tip us over the edge and cause the car to fall off the cliff.”

Or set off the Cascadia megaquake in this analogy.

Schmidt points to a study published in the journal Science that describes how last year’s great earthquake and tsunami in Japan was preceded by slow slip and tremor near the epicenter.

John Vidale mentions another killer earthquake, in Turkey in 1999, where instruments picked up a slow slip precursor.

“One of the goals of our research is to say, how often does that slow slip trigger a great earthquake? How often are great earthquakes triggered by slow slip? That’s almost completely unknown at this point.”

Vidale and his colleague Creager are more certain that we don’t need to quake with worry. They note that great earthquakes strike very infrequently in the Northwest.

So even if a megaquake becomes more likely during a slow slip event, the chances of one happening are still quite slim.

Copyright 2012 Northwest News Network

On the Web:

Interactive tremor map (Pacific Northwest Seismic Network)

“Slow Slip, ETS and Cascadia” (Central Washington University)

LISS – Live Internet Seismic Server

GSN Stations

These data update automatically every 30 minutes. Last update: October 8, 2012 05:18:48 UTC

Seismograms may take several moments to load. Click on a plot to see larger image.

CU/ANWB, Willy Bob, Antigua and Barbuda

 ANWB 24hr plot

CU/BBGH, Gun Hill, Barbados

 BBGH 24hr plot

CU/BCIP, Isla Barro Colorado, Panama

 BCIP 24hr plot

CU/GRGR, Grenville, Grenada

 GRGR 24hr plot

CU/GRTK, Grand Turk, Turks and Caicos Islands

 GRTK 24hr plot

CU/GTBY, Guantanamo Bay, Cuba

 GTBY 24hr plot

CU/MTDJ, Mount Denham, Jamaica

 MTDJ 24hr plot

CU/SDDR, Presa de Sabaneta, Dominican Republic

 SDDR 24hr plot

CU/TGUH, Tegucigalpa, Honduras

 TGUH 24hr plot

IC/BJT, Baijiatuan, Beijing, China

 BJT 24hr plot

IC/ENH, Enshi, China

 ENH 24hr plot

IC/HIA, Hailar, Neimenggu Province, China

 HIA 24hr plot

IC/LSA, Lhasa, China

 LSA 24hr plot

IC/MDJ, Mudanjiang, China

 MDJ 24hr plot

IC/QIZ, Qiongzhong, Guangduong Province, China

 QIZ 24hr plot

IU/ADK, Aleutian Islands, Alaska, USA

 ADK 24hr plot

IU/AFI, Afiamalu, Samoa

 AFI 24hr plot

IU/ANMO, Albuquerque, New Mexico, USA

 ANMO 24hr plot

IU/ANTO, Ankara, Turkey

 ANTO 24hr plot

IU/BBSR, Bermuda

 BBSR 24hr plot

IU/BILL, Bilibino, Russia

 BILL 24hr plot

IU/CASY, Casey, Antarctica

 CASY 24hr plot

IU/CCM, Cathedral Cave, Missouri, USA

 CCM 24hr plot

IU/CHTO, Chiang Mai, Thailand

 CHTO 24hr plot

IU/COLA, College Outpost, Alaska, USA

 COLA 24hr plot

IU/COR, Corvallis, Oregon, USA

 COR 24hr plot

IU/CTAO, Charters Towers, Australia

 CTAO 24hr plot

IU/DAV,Davao, Philippines

 DAV 24hr plot

IU/DWPF,Disney Wilderness Preserve, Florida, USA

 DWPF 24hr plot

IU/FUNA,Funafuti, Tuvalu

 FUNA 24hr plot

IU/FURI, Mt. Furi, Ethiopia

 FURI 24hr plot

IU/GNI, Garni, Armenia

 GNI 24hr plot

IU/GRFO, Grafenberg, Germany

 GRFO 24hr plot

IU/GUMO, Guam, Mariana Islands

 GUMO 24hr plot

IU/HKT, Hockley, Texas, USA

 HKT 24hr plot

IU/HNR, Honiara, Solomon Islands

 HNR 24hr plot

IU/HRV, Adam Dziewonski Observatory (Oak Ridge), Massachusetts, USA

 HRV 24hr plot

IU/INCN, Inchon, Republic of Korea

 INCN 24hr plot

IU/JOHN, Johnston Island, Pacific Ocean

 JOHN 24hr plot

IU/KBS, Ny-Alesund, Spitzbergen, Norway

 KBS 24hr plot

IU/KEV, Kevo, Finland

 KEV 24hr plot

IU/KIEV, Kiev, Ukraine

 KIEV 24hr plot

IU/KIP, Kipapa, Hawaii, USA

 KIP 24hr plot

IU/KMBO, Kilima Mbogo, Kenya

 KMBO 24hr plot

IU/KNTN, Kanton Island, Kiribati

 KNTN 24hr plot

IU/KONO, Kongsberg, Norway

 KONO 24hr plot

IU/KOWA, Kowa, Mali

 KOWA 24hr plot

IU/LCO, Las Campanas Astronomical Observatory, Chile

 LCO 24hr plot

IU/LSZ, Lusaka, Zambia

 LSZ 24hr plot

IU/LVC, Limon Verde, Chile

 LVC 24hr plot

IU/MA2, Magadan, Russia

 MA2 24hr plot

IU/MAJO, Matsushiro, Japan

 MAJO 24hr plot

IU/MAKZ,Makanchi, Kazakhstan

 MAKZ 24hr plot

IU/MBWA, Marble Bar, Western Australia

 MBWA 24hr plot

IU/MIDW, Midway Island, Pacific Ocean, USA

 MIDW 24hr plot

IU/MSKU, Masuku, Gabon

 MSKU 24hr plot

IU/NWAO, Narrogin, Australia

 NWAO 24hr plot

IU/OTAV, Otavalo, Equador

 OTAV 24hr plot

IU/PAB, San Pablo, Spain

 PAB 24hr plot

IU/PAYG Puerto Ayora, Galapagos Islands

 PAYG 24hr plot

IU/PET, Petropavlovsk, Russia

 PET 24hr plot

IU/PMG, Port Moresby, Papua New Guinea

 PMG 24hr plot

IU/PMSA, Palmer Station, Antarctica

 PMSA 24hr plot

IU/POHA, Pohakaloa, Hawaii

 POHA 24hr plot

IU/PTCN, Pitcairn Island, South Pacific

 PTCN 24hr plot

IU/PTGA, Pitinga, Brazil

 PTGA 24hr plot

IU/QSPA, South Pole, Antarctica

 QSPA 24hr plot

IU/RAO, Raoul, Kermandec Islands

 RAO 24hr plot

IU/RAR, Rarotonga, Cook Islands

 RAR 24hr plot

IU/RCBR, Riachuelo, Brazil

 RCBR 24hr plot

IU/RSSD, Black Hills, South Dakota, USA

 RSSD 24hr plot

IU/SAML, Samuel, Brazil

 SAML 24hr plot

IU/SBA, Scott Base, Antarctica

 SBA 24hr plot

IU/SDV, Santo Domingo, Venezuela

 SDV 24hr plot

IU/SFJD, Sondre Stromfjord, Greenland

 SFJD 24hr plot

IU/SJG, San Juan, Puerto Rico

 SJG 24hr plot

IU/SLBS, Sierra la Laguna Baja California Sur, Mexico

 SLBS 24hr plot

IU/SNZO, South Karori, New Zealand

 SNZO 24hr plot

IU/SSPA, Standing Stone, Pennsylvania USA

 SSPA 24hr plot

IU/TARA, Tarawa Island, Republic of Kiribati

 TARA 24hr plot

IU/TATO, Taipei, Taiwan

 TATO 24hr plot

IU/TEIG, Tepich, Yucatan, Mexico

 TEIG 24hr plot

IU/TIXI, Tiksi, Russia

 TIXI 24hr plot

IU/TRIS, Tristan da Cunha, Atlantic Ocean

 TRIS 24hr plot

IU/TRQA, Tornquist, Argentina

 TRQA 24hr plot

IU/TSUM, Tsumeb, Namibia

 TSUM 24hr plot

IU/TUC, Tucson, Arizona

 TUC 24hr plot

IU/ULN, Ulaanbaatar, Mongolia

 ULN 24hr plot

IU/WAKE, Wake Island, Pacific Ocean

 WAKE 24hr plot

IU/WCI, Wyandotte Cave, Indiana, USA

 WCI 24hr plot

IU/WVT, Waverly, Tennessee, USA

 WVT 24hr plot

IU/XMAS, Kiritimati Island, Republic of Kiribati

 XMAS 24hr plot

IU/YAK, Yakutsk, Russia

 YAK 24hr plot

IU/YSS, Yuzhno Sakhalinsk, Russia

 YSS 24hr plot

**********************************************************************************************************

Volcanic Activity

Maar Volcanoes: Odd Explosions Beneath Earth Explained

By Megan Gannon, News Editor | LiveScience.com

The eruption of a so-called maar-diatreme volcano is short-lived but violent. Magma creeps up through a crack in the Earth’s crust and mixes with water, setting off a series of explosions — as many as a few each hour for several weeks. When the action stops, a crater-topped, rock-filled fracture called a diatreme is left behind. Now researchers are proposing a new way to think about how these structures are formed, which could help geologists predict eruptions and find new sources of diamonds. “Previously it was thought that those explosions started at very shallow levels and got progressively deeper,” geologist Greg Valentine, a professor at the University at Buffalo in New York, told LiveScience. This old model seemed to explain the shape of a diatreme, which sits like an inverted cone beneath a shallow maar, or crater. But that model didn’t match with what geologists were finding at volcanic sites, Valentine said. If the explosions started at shallow levels and moved deeper, shallow rocks would be spewed from the mouth of the volcano first and the deeper rock deposits would pile up on top. At maar sites, however, scientists were finding deep rock fragments mixed mostly with shallow fragments, indicating that explosions occur at essentially every depth throughout the episode. Valentine and James White, an associate professor at the University of Otago in New Zealand, created a new model to account for the apparently more jumbled order of explosions. Their model, published online Sept. 18 by the journal Geology, also shows that individual explosions are relatively small, and shallow explosions are more likely than deep explosions to cause eruptions. The last known maar-diatreme eruption occurred in 1977 in Alaska’s remote Aleutian Range, forming two vents known as the Ukinrek Maars. The threats associated with these volcanoes tend to be localized, but they can still be significant, Valentine said. “These volcanoes can send ash deposits into populated areas. They could easily produce the same effects that the one in Iceland did when it disrupted air travel, so what we’re trying to do is understand the way they behave,” he explained in a statement.

08.10.2012 Volcano Eruption Indonesia North Sulawesi, [Mount Lokon _Volcano] Damage level Details

Volcano Eruption in Indonesia on Sunday, 07 October, 2012 at 15:46 (03:46 PM) UTC.

Description
A volatile volcano in northern Indonesia erupted Sunday, spewing smoke and ash that caused muddy rain to fall in nearby villages, an official said. Mount Lokon in North Sulawesi province rumbled as heavy rain fell around its cloud-covered crater, local monitoring official Farid Ruskanda Bina said. He said the sound was heard 5 kilometers (3 miles) away but the height of the eruption was not visible. The ash made the rain thick and muddy in six villages, Bina said. “Soldiers are distributing masks to the villagers,” he said. There was no plan for evacuations because the nearest villages are beyond the danger area, he said. More than 33,000 people live along the fertile slopes of the 5,741-foot (1,750-meter) mountain. Mount Lokon is one of about 129 active volcanoes in Indonesia. Its last major eruption in 1991 killed a Swiss hiker and forced thousands of people to flee their homes.
05.10.2012 Volcano Activity Italy Sicily, [ Etna Volcano] Damage level Details

Volcano Activity in Italy on Friday, 05 October, 2012 at 17:01 (05:01 PM) UTC.

Description
A slight increase in shaking was reported at Etna volcano on the island of Sicily but it does not appear in danger of eruption, volcano experts said Friday. Activity on a recently opened crater has been registered since Wednesday, Italian news agency ANSA reported. The activity has been accompanied by “a slight increase in volcanic shaking,” volcano experts said. Etna has experienced nine “eruptive events” this year. The volcano belched a plume of smoke in a full-blown explosion in January that led to the temporary closure of Catania airport.

***********************************************************************************************************

Extreme Temperatures/ Weather

07.10.2012 Forest / Wild Fire Tanzania Multiple areas, [Namtumbo and Tunduru districts] Damage level Details

Forest / Wild Fire in Tanzania on Sunday, 07 October, 2012 at 07:05 (07:05 AM) UTC.

Description
Recently, fire occurrence surveys were conducted in Namtumbo and Tunduru districts, covering all villages in Selous-Niassa Wildlife Protection Corridor (SNWPC) Project Area. The surveys were conducted by teams composed of staff belonging to natural resources sectors.Similar situations where wild fires are seen include Coast Region, Morogoro, Singida, Kigoma and Mara. The selected area served as a study case to general situation in rural areas where this dry season phenomenon is common to the detriment of the environment.It has been found that the major cause for fires is shifting cultivation but other factors also come into play, such as poachers, lumberers, honey gatherers and charcoal burners. Also cases of accidental fires cannot be ruled out. However, fires that occur often get out of hand due to lack of action from villagers as well as lack of laws to control fire occurrences and where laws exist there is a lot of laxity in enforcing them. The report compiled by staff from Natural Resources Sector revealed that incidents of wildfire have increased along with effects of climatic changes. Fires are rare in the wet season because the grass usually has high water content to burn properly. The above situation is also applicable to other areas in Coast Region, Morogoro and Tanga, since wildfires are a commonplace in many parts during the dry season.The majority of interviewed residents and villagers agreed that wildfires tend to occur during the dry season, from July to November. This is the time when the grass is tinder dry and, unfortunately, wild fires can often get out of hand. Again, this is the period most peasants are preparing their plots for the next farming season.The fires are used as short-cut measures in removing long grasses and thick bushes.

***********************************************************************************************************

Storms /  Flooding / Landslides

 Active tropical storm system(s)
Name of storm system Location Formed Last update Last category Course Wind Speed Gust Wave Source Details
Olivia (EP15) Pacific Ocean – East 06.10.2012 08.10.2012 Tropical Depression 355 ° 93 km/h 111 km/h 4.88 m NOAA NHC Details

Tropical Storm data

Share:
Storm name: Olivia (EP15)
Area: Pacific Ocean – East
Start up location: N 14° 0.000, W 118° 42.000
Start up: 06th October 2012
Status: Active
Track long: 211.23 km
Top category.:
Report by: NOAA NHC
Useful links:

Past track
Date Time Position Speed
km/h
Wind
km/h
Gust
km/h
Category Course Wave Pressure Source
07th Oct 2012 08:08:10 N 14° 0.000, W 120° 30.000 17 83 102 Tropical Storm 280 19 1000 MB NOAA NHC
Current position
Date Time Position Speed
km/h
Wind
km/h
Gust
km/h
Category Course Wave
feet
Pressure Source
08th Oct 2012 05:01:14 N 16° 12.000, W 120° 54.000 11 93 111 Tropical Depression 355 ° 16 998 MB NOAA NHC
Forecast track
Date Time Position Category Wind
km/h
Gust
km/h
Source
09th Oct 2012 12:00:00 N 17° 24.000, W 121° 30.000 Tropical Depression 83 102 NOAA NHC
09th Oct 2012 00:00:00 N 17° 18.000, W 121° 0.000 Tropical Depression 93 111 NOAA NHC
10th Oct 2012 00:00:00 N 17° 12.000, W 122° 12.000 Tropical Depression 65 83 NOAA NHC
11th Oct 2012 00:00:00 N 16° 54.000, W 123° 48.000 Tropical Depression 46 65 NOAA NHC
12th Oct 2012 00:00:00 N 16° 0.000, W 125° 42.000 Tropical Depression 37 56 NOAA NHC
Prapiroon (22W) Pacific Ocean 08.10.2012 08.10.2012 Tropical Depression 270 ° 83 km/h 102 km/h 4.57 m JTWC Details

Tropical Storm data

Share:
Storm name: Prapiroon (22W)
Area: Pacific Ocean
Start up location: N 17° 54.000, E 135° 42.000
Start up: 08th October 2012
Status: Active
Track long: 0.00 km
Top category.:
Report by: JTWC
Useful links:

Past track
Date Time Position Speed
km/h
Wind
km/h
Gust
km/h
Category Course Wave Pressure Source
Current position
Date Time Position Speed
km/h
Wind
km/h
Gust
km/h
Category Course Wave
feet
Pressure Source
08th Oct 2012 05:04:27 N 17° 54.000, E 135° 42.000 9 83 102 Tropical Depression 270 ° 15 JTWC
Forecast track
Date Time Position Category Wind
km/h
Gust
km/h
Source
09th Oct 2012 00:00:00 N 17° 54.000, E 133° 36.000 Typhoon II 130 157 JTWC
09th Oct 2012 12:00:00 N 17° 54.000, E 133° 0.000 Typhoon III 148 185 JTWC
10th Oct 2012 00:00:00 N 17° 54.000, E 132° 30.000 Typhoon III 157 194 JTWC
11th Oct 2012 00:00:00 N 18° 12.000, E 131° 48.000 Typhoon IV 176 213 JTWC
12th Oct 2012 00:00:00 N 19° 0.000, E 131° 0.000 Typhoon IV 185 232 JTWC
13th Oct 2012 00:00:00 N 20° 12.000, E 130° 30.000 Typhoon IV 194 241 JTWC

…………………..

All 18 children confirmed dead in China landslide

by Staff Writers
Beijing (AFP)

Rescuers have found the bodies of all 18 children buried when a landslide engulfed their primary school in China as they made up classes lost due to recent deadly earthquakes, state media said Friday.

The landslide, triggered by sustained rains, buried the school and three farmhouses on Thursday in the village of Zhenhe in Yunnan province where a pair of earthquakes last month killed 81 people and injured hundreds.

Any last hope for survivors evaporated early Friday when rescuers pulled the body of the last missing child from the landslide debris, China National Radio said in a report on its website.

The disaster in the village of Zhenhe is likely to raise questions over why the children had been brought back into the school, located in a deep mountain valley, when the rest of China was on a week-long national holiday.

But local officials have said the children needed to make up class time lost due to disruptions stemming from the September 7 earthquakes.

China has a highly competitive education system built around cramming for high-stress testing that determines entry into good schools later.

A local villager also was buried under the rubble and has yet to be found by rescuers, China National Radio said.

State media reports initially identified the school as the Youfang Primary School, but subsequent reports have said its official name is the Tiantou Primary School.

School safety is a sensitive issue in China after thousands of students died when an 8.0-magnitude tremor centred in Sichuan province rocked the southwest of the country in 2008.

Many schools collapsed in that quake, which killed more than 80,000 people.

This led to accusations that corner-cutting in construction projects and possibly corruption led to shoddy buildings, especially as many buildings near such schools held firm.

There have so far been no such allegations in the Yunnan landslide.

However, like many schools, homes, and other structures in the rugged region, the disaster-hit primary school was located at the base of steep slopes.

Mountainous southwestern China is prone to deadly landslides, a threat worsened by frequent seismic activity.

The 2008 earthquake triggered giant landslides that left whole mountainsides scarred.

The students killed in Thursday’s landslide were from another school who were brought in to study because their own school had been too heavily damaged in last month’s quakes, state-run Xinhua news agency said.

The two 5.6-magnitude quakes left more than 820 people injured and 201,000 displaced in the poor region.

Thursday’s landslide also blocked a nearby river, creating a lake and forcing the evacuation of more than 800 residents living downstream, the agency said.

Almost 2,000 people had been mobilised to unblock the waterway and help in the rescue, it said.

At least 30 students had been scheduled to resume classes at the school in Zhenhe. Those who were unharmed by the landslide will resume classes at a nearby school, Xinhua said.

Related Links
Bringing Order To A World Of Disasters
A world of storm and tempest
When the Earth Quakes

07.10.2012 Landslide Italy Provincia di La Spezia, [Cinque Terre] Damage level Details

Landslide in Italy on Sunday, 07 October, 2012 at 17:41 (05:41 PM) UTC.

Description
Rescuers say a rockslide slammed into Italy’s popular Way of Love hiking trail in the coastal Cinque Terre resort area, injuring four Australian women. One was crushed by rocks and another was knocked off the steep path. Dr. Davide Battistella said those two hikers were in grave condition and two others were less seriously injured by the landslide Monday morning on the trail, which cuts into a steep hillside overlooking the Ligurian Sea south of Genoa. Battistella told The Associated Press that one woman was dug out from under the rocks and flown by helicopter to a hospital. The woman who landed on a precarious perch on the hillside was carried out by a human chain of rescuers. The Cinque Terre area is breathtakingly beautiful but geologically fragile.

****************************************************************************************************

Epidemic Hazards  / Diseases

Meningitis Outbreak: 5 Dead

ublished on Oct 5, 2012 by

Some steroid shots contaminated with a fungus incite health scare. For more: http://abcnews.go.com/Health/Wellness/meningitis-outbreak-highlights-hazards-…

Medication tied to rare meningitis outbreak reached 23 states

By Tim Ghianni

NASHVILLE, Tennessee

(Reuters) – A steroid medication linked to the death of at least five people from rare fungal meningitis may have been administered to patients in 23 states, the U.S. Centers for Disease Control said on Thursday, raising fears the rare outbreak could spread.

In a briefing for reporters, the CDC said five people had died so far and 35 had taken ill from fungal meningitis in six states. The outbreak was first reported in Tennessee, where three people have died and 25 of the cases have been reported.

The other confirmed deaths were in Virginia and Maryland.

The CDC said it had not yet determined the rate of infection among those patients who received the potentially tainted steroid. The rate of infection is an important barometer of the potential for the outbreak to spread.

The steroid is administered to patients, usually by injection, primarily to control back pain.

All the cases have so far been traced to three lots of Methylprednisolene Acetate from a pharmaceutical compounding plant in Massachusetts, according to the briefing.

The company, New England Compounding Center Inc, or NECC, in Framingham, Massachusetts, prepared the medication, which has been voluntarily recalled. The company has also voluntarily surrendered its license. NECC could not immediately be reached for comment.

“We are encouraging all health facilities to immediately cease use of any product produced by NECC,” Dr. Madeleine Biondolillo, Massachusetts public health director of safety, told reporters in a conference call from Boston.

NECC could not immediately be reached for comment.

A fungus linked to the steroid medication has been identified in specimens from five patients, according to the CDC’s Dr. Benjamin Park.

The Massachusetts Health Department said there were 17,676 vials of medication in each of the three lots under investigation. They were sent out July through September and have a shelf life of 180 days.

The CDC said the fungal contamination was detected in the examination of one of the sealed vials taken at that company.

Fungal meningitis is rare and life-threatening, but is not contagious from person to person. Meningitis can be passed to humans from steroid medications that weaken the immune system. Symptoms include a sudden onset of fever, headache, stiff neck, nausea, and vomiting, according to the CDC web site.

In addition to the 25 cases in Tennessee, one has been reported in North Carolina, two in Florida, four in Virginia, two in Maryland and one in Indiana, according to CDC’s Park.

SOME TENNESSEE PATIENTS ‘REALLY CRITICALLY ILL’

About 75 facilities could have received the steroid in the 23 states. They include California, Connecticut, Florida, Georgia, Idaho, Illinois, Indiana, Maryland, Michigan, Minnesota, North Carolina, New Hampshire, New Jersey, Nevada, New York, Ohio, Pennsylvania, Rhode Island, South Carolina, Tennessee, Virginia, Texas and West Virginia, according to Park.

In one example of how widespread the steroid was distributed, one facility in Indiana, St. Mary’s Health, said on Thursday that 560 patients had received the recalled medication. They received the steroid at the Surgicare Cross Pointe clinic in Evansville, said St. Mary’s spokeswoman Laura Forbes. It was not immediately known if any patients were infected there.

In Tennessee, the worst-hit state, Dr. John Dreyzehner, the state health commissioner, said expectations were that the number of cases would rise. “We are awaiting results of tests from other cases,” he told a news conference in Nashville.

Some Tennessee patients are “really critically ill” and in intensive care units, said Dr. Marion Kainer of the state health department. She declined to say how many were critical.

The Massachusetts Health Department said there had been several complaints against the company linked to the steroid. Complaints in 2002 and 2003 about the processing of medication resulted in an agreement with government agencies in 2006 to correct deficiencies

In 2011, there was another inspection of the facility and no deficiencies were found. In March 2012, another complaint was made about the potency of a product used in eye surgery procedures. That investigation is continuing, the state health department said.

(Additional reporting by Mary Wisniewski and Susan Guyett; Writing by Greg McCune; Editing by Cynthia Johnston and Peter Cooney)

The Next Pandemic: Why
It Will Come from Wildlife

Experts believe the next deadly human pandemic will almost certainly be a virus that spills over from wildlife to humans. The reasons why have a lot to do with the frenetic pace with which we are destroying wild places and disrupting ecosystems.

by david quammen

Emerging diseases are in the news again. Scary viruses are making themselves noticed and felt. There’s been a lot of that during the past several months — West Nile fever kills 17 people in the Dallas area, three tourists succumb to hantavirus after visiting Yosemite National Park, an Ebola outbreak in the Democratic Republic of the Congo claims 33 lives. A separate Ebola outbreak, across the border in Uganda, registers a death toll of 17. A peculiar new coronavirus, related to SARS, proves fatal for a Saudi man and puts a Qatari into critical condition, while disease scientists all over the world wonder: Is this one — or is that one — going to turn into the Next Big One?

By the Next Big One, I mean a murderous pandemic that sweeps around the planet, killing millions of people, as the so-called “Spanish” influenza did in 1918-19, as AIDS has been doing in slower motion, and as SARS might have done in 2003 if it hadn’t been stopped by fast science, rigorous

Avian bird flu test

Carl De Souza/AFP/Getty Images
An official from the Scottish Agricultural College holds a dead swan to be tested for avian flu.

measures of public health, and luck. Experts I’ve interviewed over the past six years generally agree that such a Next Big One is not only possible but probable. They agree that it will almost certainly be a zoonotic disease — one that emerges from wildlife — and that the causal agent will most likely be a virus. They agree that sheer human abundance, density, and interconnectedness make us highly vulnerable. Our population now stands above seven billion, after all, a vast multitude of potential victims, many of us living at close quarters in big cities, traveling quickly and often from place to place, sharing infections with one another; and there are dangerous new viruses lately emerging against which we haven’t been immunized. Another major pandemic seems as logically inevitable as the prospect that a very dry, very thick forest will eventually burn.

That raises serious issues in the realm of health policy, preparedness, and medical response. It also suggests a few urgent questions on the scientific side — we might even say, the conservation side — of the discussion. Those questions, in simplest form, are: Where? How? and Why? Addressing them is crucial to understanding the dynamics of emerging diseases, and understanding is crucial to preparedness and response.

First question: From where will the Next Big One emerge? Answer, as I’ve noted: Most likely from wildlife. It will be a zoonosis — an animal infection that spills over into humans.

Everything comes from somewhere. New human diseases don’t arrive from Mars. Notwithstanding the vivid anxieties of The Andromeda Strain (1969) and other such fictions, lethal microbes don’t arrive on contaminated satellites returning from deep space. (Or anyway, knock wood, they haven’t so far.) They emerge from nonhuman animals, earthly ones, and spill over into human populations, catching hold, replicating, sometimes adapting and prospering, then passing onward from human to human.

According to one study, 58 percent of all pathogen species infecting humans are zoonotic. Another study found that 72 percent of all recently emerged zoonotic pathogens have come from wildlife. That list includes

According to one study, 72 percent of all recently emerged zoonotic pathogens have come from wildlife.

everything from Ebola and Marburg and the HIVs and the influenzas to West Nile virus, monkeypox, and the SARS bug.

In Malaysia, a virus called Nipah spilled over from fruit bats in 1998. Its route into humans was indirect but efficient: The bats fed in fruit trees overshadowing factory-scale pigsties; the bat droppings carried virus, which infected many pigs; the virus replicated abundantly in the pigs, and from them infected piggery workers and employees at abattoirs. That outbreak killed 109 people and ended with the culling of 1.1 million pigs.

Second question: How do such pathogens get into humans? The particulars are various but the general answer is: contact. Contact equals opportunity, and the successful pathogens are those that seize opportunities to proliferate and to spread, not just from one host to another but from one kind of host to another.

Wild aquatic birds defecate in a village duck pond, passing a new strain of influenza to domestic ducks; the ducks pass it to a Chinese boy charged with their care, after which the boy passes it to his brother and sister. A man in Cameroon butchers a chimpanzee and, elbow deep in its blood, acquires a simian virus that becomes HIV-1. A miner in Uganda enters a shaft filled with bats carrying Marburg virus and, somehow, by ingesting or breathing bat wastes, gets infected. Contact between people and wildlife, sometime direct, sometimes with livestock as intermediaries, presents opportunities for their infections to become ours.

Third question: Whydo such spillovers seem to be happening now more than ever? There’s been a steady drumbeat of new zoonotic viruses

We are interacting with wild animals and disrupting the ecosystems they inhabit to an unprecedented degree.

emerging into the human population within recent decades: Machupo (1961), Marburg (1967), Lassa (1969), Ebola (1976), HIV-1 (inferred in 1981, first isolated in 1983), HIV-2 (1986), Sin Nombre (the first-recognized American hantavirus, 1993), Hendra (1994), the strain of influenza called “avian flu” (1997), Nipah (1998), West Nile (1999), SARS (2003), and others. These are not independent events. They are parts of a pattern. They reflect things that we’re doing, not just things that are happening to us.

What we’re doing is interacting with wild animals and disrupting the ecosystems that they inhabit — all to an unprecedented degree. Of course, humans have always killed wildlife and disrupted ecosystems, clearing and fragmenting forests, converting habitat into cropland and settlement, adding livestock to the landscape, driving native species toward extinction, introducing exotics. But now that there are seven billion of us on the planet, with greater tools, greater hungers, greater mobility, we’re pressing into the wild places like never before, and one of the things that we’re finding there is… new infections. And once we’ve acquired a new infection, the chance of spreading it globally is also greater than ever.

We cut our way through the Congo. We cut our way through the Amazon. We cut our way through Borneo and Madagascar and northeastern Australia. We shake the trees, figuratively and literally, and things fall out. We kill and butcher and eat many of the wild animals found there. We settle in those places, creating villages, work camps, towns, extractive

Evolution seizes opportunity, explores possibilities, and helps convert spillovers to pandemics.

industries, new cities. We bring in our domesticated animals, replacing the wild herbivores with livestock. We multiply our livestock as we’ve multiplied ourselves, operating huge factory-scale operations such as the piggeries in Malaysia, into which Nipah virus fell from the bats feeding in fruit trees planted nearby, after the bats’ native forest habitats had been destroyed. We export and import livestock across great distances and at high speeds. We export and import other live animals, especially primates, for medical research. We export and import animal skins, exotic pets, contraband bushmeat, and plants, some of which carry secret microbial passengers.

We travel, moving between cities and continents even more quickly than our transported livestock. We eat in restaurants where the cook may have butchered a porcupine before working on our scallops. We visit monkey temples in Asia, live markets in India, picturesque villages in South America, dusty archeological sites in New Mexico, dairy towns in the Netherlands, bat caves in East Africa, racetracks in Australia — breathing the air, feeding the animals, touching things, shaking hands with the friendly locals — and then we jump on our planes and fly home. We get bit by mosquitoes and ticks. We alter the global climate with our carbon emissions, which may in turn alter the latitudinal ranges within which those mosquitoes and ticks live. We provide an irresistible opportunity for enterprising microbes by the ubiquity and abundance of our human bodies.


Climate’s Strong Fingerprint
In Global Cholera Outbreaks

  YALE e360

Climate’s Strong Fingerprint in Global Cholera Outbreaks

For decades, deadly outbreaks of cholera were attributed to the spread of disease through poor sanitation. But recent research demonstrates how closely cholera is tied to environmental and hydrological factors and to weather patterns — all of which may lead to more frequent cholera outbreaks as the world warms.

Everything I’ve just mentioned is encompassed within this rubric: the ecology and evolutionary biology of zoonotic diseases. Ecological circumstance provides opportunity for spillover. Evolution seizes opportunity, explores possibilities, and helps convert spillovers to pandemics. But the majesty of the sheer biological phenomena involved is no consolation for the human miseries, the deaths, and the current level of risk.

There are things that can be done — research, vigilance, anticipation, fast and effective response — to stave off or at least mitigate the Next Big One. My point here is different. My point is about human ecology, not human medicine. It behooves us to remember that we too are animals, interconnected with the rest of earthly biota by shared diseases, among other ways. We should recall that salubriuous biblical warning from the Book of Proverbs: “He that troubleth his own house shall inherit the wind.” The planet is our home, but not ours only, and we’d be wise to tread a little more lightly within this wonderful, germy world.

7 dead as meningitis outbreak grows

By the CNN Wire Staff
STORY HIGHLIGHTS
  • NEW: The pharmacy that manufactured the steroid recalls all its other products
  • The number of cases grows to 64 people in 9 states
  • It is linked to contaminated steroid injections
  • The steroid is used to treat pain and inflammation

Atlanta (CNN) — The death toll from an outbreak of fungal meningitis linked to contaminated steroid injections has risen to seven, the Centers for Disease Control and Prevention said Saturday.

The total number of cases has also grown to 64 people in nine states, the CDC said. That is 17 more cases and two more states than the day before.

Patients contracted the deadly meningitis after being injected in their spine with a preservative-free steroid called methylprednisolone acetate that was contaminated by a fungus. The steroid is used to treat pain and inflammation.

What is meningitis?

The New England Compounding Center, the Massachusetts-based pharmacy that made the contaminated injections, voluntarily recalled three lots of the injected steroid last week.

On Saturday, the same pharmacy announced a voluntary nationwide recall of all its other products as well. NECC said the new recall was being announced out of an abundance of caution and that there is no indication any of its other products are contaminated.

The Food and Drug Administration has already asked doctors, clinics, and consumers to stop using any of the pharmacy’s products. The pharmacy on Wednesday voluntarily surrendered its license to operate until the FDA investigation into the contamination is complete.

Health officials say 76 medical facilities in 23 states received the contaminated steroid injections from NECC. A list of the 76 affected medical facilities is on the CDC’s website at http://www.cdc.gov/hai/outbreaks/meningitis-facilities-map.html.

The CDC raised the death toll Saturday after two people died in Michigan. Other deaths have been reported in Maryland, Tennessee, and Virginia.

Tennessee is reporting the most number of overall cases — 29 — which includes three deaths, according to the CDC.

There are also confirmed cases in Florida, Indiana, Minnesota, North Carolina and Ohio.

The other states that received the contaminated products from NECC are California, Connecticut, Georgia, Idaho, Illinois, New Hampshire, New Jersey, Nevada, New York, Pennsylvania, Rhode Island, South Carolina, Texas and West Virginia.

Federal health inspectors began inspecting the NECC plant last Monday. Inspectors found foreign particles in unopened vials, and after testing one of the unopened vials, they determined the substance was a fungus.

The investigation is still under way.

Nearly 10% of drugs administered in the United States come from compound pharmacies, according to a 2003 Government Accountability Office report.

Drugs manufactured by compound pharmacies do not have to go through FDA-mandated pre-market approval. Instead, oversight and licensing of these pharmacies comes from state health pharmacy boards.

Compound pharmacists create customized medication solutions for patients for whom manufactured pharmaceuticals won’t work, according to the International Academy of Compounding Pharmacists.

Meningitis is an inflammation of the protective membranes covering the brain and spinal cord. It is usually caused by an infection, frequently with bacteria or a virus, but it can also be caused by less common pathogens like fungi, according to the CDC.

Fungal meningitis is very rare and, unlike viral and bacterial meningitis, it is not contagious.

Symptoms of fungal meningitis are similar to symptoms from other forms of meningitis, but they often appear more gradually and can be very mild at first, the CDC says.

Dr. William Schaffner, chairman of the Department of Preventive Medicine at Vanderbilt University Medical Center, told CNN that fungal infections are not usually mild. He said when a fungus invades small blood vessels, it can cause them to clot or bleed, which can lead to symptoms of small strokes.

In addition to typical meningitis symptoms like headache, fever, nausea and stiffness of the neck, people with fungal meningitis may also experience confusion, dizziness and discomfort from bright lights. Patients might just have one or two of these symptoms, the CDC says.

Health officials say any patients who received an injection at one of the facilities beginning July 1 and who began showing symptoms between one and three weeks after being injected should see their doctor right away.

The earlier a patient gets treatment, the more likely he or she will survive.

Patients are treated with anti-fungal medication, which is given intravenously so patients have to be admitted to the hospital, the CDC said. Patients may need to be treated for months.

The FDA is urging anyone who has experienced problems following an injection with the NECC product to report it to MedWatch, the FDA’s voluntary reporting program, by phone at 1-800-FDA-1088 or online at http://www.fda.gov/medwatch/report.htm.

CNN’s Miriam Falco contributed to this report.

Today Epidemic Hazard India State of Orissa, Kandhamal Damage level Details

Epidemic Hazard in India on Monday, 08 October, 2012 at 02:58 (02:58 AM) UTC.

Description
The vector-borne disease of chicken pox has been spreading among the inmates of a government-run residential school in Kandhamal district. At least 19 inmates, aged 6 to 12 years, in the residential school at Daberi in Daringibadi block, have been infected with the disease. There are 131 inmates in the hostel at present. “The situation is under control and there is no cause to panic,” a senior medical officer said, however. District malaria officer (DMO) J N Patnaik visited the hostel along with a team of doctors on Sunday. “The infected children were segregated in a room to prevent the spread of the disease. They are being administered the required medication,” the DMO said. He said the condition of the other students, who have already left the hostel after being infected, was not known. “We are trying to bring them to the hostel for treatment. If their parents do not agree, the medical staff will go to their respective places to provide treatment,” Patnaik said. The outbreak of chicken pox was first reported in the hostel on September 29, sources said. The disease spread gradually. “It’s a viral disease which spreads through the air and after contact with the affected persons. We have advised the school authorities not to allow the affected students to venture outside the hostel,” the DFO said.
Biohazard name: Chicken pox
Biohazard level: 2/4 Medium
Biohazard desc.: Bacteria and viruses that cause only mild disease to humans, or are difficult to contract via aerosol in a lab setting, such as hepatitis A, B, and C, influenza A, Lyme disease, salmonella, mumps, measles, scrapie, dengue fever, and HIV. “Routine diagnostic work with clinical specimens can be done safely at Biosafety Level 2, using Biosafety Level 2 practices and procedures. Research work (including co-cultivation, virus replication studies, or manipulations involving concentrated virus) can be done in a BSL-2 (P2) facility, using BSL-3 practices and procedures. Virus production activities, including virus concentrations, require a BSL-3 (P3) facility and use of BSL-3 practices and procedures”, see Recommended Biosafety Levels for Infectious Agents.
Symptoms:
Status: confirmed

************************************************************************************************************

Climate Change

Arctic Sea Ice Shatters Previous Low Records; Antarctic Sea Ice Edges to Record High

ScienceDaily

This September, sea ice covering the Arctic Ocean fell to the lowest extent in the satellite record, which began in 1979. Satellite data analyzed by NSIDC scientists showed that the sea ice cover reached its lowest extent on September 16. Sea ice extent averaged for the month of September was also the lowest in the satellite record.

The near-record ice melt occurred without the unusual weather conditions that contributed to the extreme melt of 2007. In 2007, winds and weather patterns helped melt large expanses of ice. “Atmospheric and oceanic conditions were not as conducive to ice loss this year, but the melt still reached a new record low,” said NSIDC scientist Walt Meier. “This probably reflects loss of multi-year ice in the Arctic, as well as other factors that are making the ice more vulnerable.” Multi-year ice is ice that has survived more than one melt season and is thicker than first-year ice.

NSIDC Director Mark Serreze said, “It looks like the spring ice cover is so thin now that large areas melt out in summer, even without persistent extreme weather patterns.” A storm that tracked through the Arctic in August helped break up the weakened ice pack.

Arctic sea ice extent reached its lowest point this year on September 16, 2012 when sea ice extent dropped to 3.41 million square kilometers (1.32 million square miles). Averaged over the month of September, ice extent was 3.61 million square kilometers (1.39 million square miles). This places 2012 as the lowest ice extent both for the daily minimum extent and the monthly average. Ice extent was 3.29 million square kilometers (1.27 million square miles) below the 1979 to 2000 average.

The Arctic ice cap grows each winter as the sun sets for several months and shrinks each summer as the sun rises higher in the northern sky. Each year the Arctic sea ice reaches its annual minimum extent in September. It hit its previous record low in 2007. This summer’s low ice extent continued the downward trend seen over the last 33 years. Scientists attribute this trend in large part to warming temperatures caused by climate change. Since 1979, September Arctic sea ice extent has declined by 13 percent per decade. Summer sea ice extent is important because, among other things, it reflects sunlight, keeping the Arctic region cool and moderating global climate.

In addition to the decline in sea ice extent, a two-dimensional measure of the ice cover, the ice cover has grown thinner and less resistant to summer melt. Recent data on the age of sea ice, which scientists use to estimate the thickness of the ice cover, shows that the youngest, thinnest ice, which has survived only one or two melt seasons, now makes up the large majority of the ice cover.

Climate models have suggested that the Arctic could lose almost all of its summer ice cover by 2100, but in recent years, ice extent has declined faster than the models predicted. Serreze said, “The big summer ice loss in 2011 set us up for another big melt year in 2012. We may be looking at an Arctic Ocean essentially free of summer ice only a few decades from now.” NSIDC scientist Julienne Stroeve recently spent three weeks in the Arctic Ocean on an icebreaker ship, and was surprised by how thin the ice was and how much open water existed between the individual ice floes. “According to the satellite data, I expected to be in nearly 90% ice cover, but instead the ice concentrations were typically below 50%,” she said.

As the Arctic was experiencing a record low minimum extent, the Antarctic sea ice was reaching record high levels, culminating in a Southern Hemisphere winter maximum extent of 19.44 million square kilometers (7.51 million square miles) on September 26. The September 2012 monthly average was also a record high, at 19.39 million square kilometers (7.49 million square miles) slightly higher than the previous record in 2006. Temperatures over Antarctica were near average this austral winter. Scientists largely attribute the increase in Antarctic sea ice extent to stronger circumpolar winds, which blow the sea ice outward, increasing extent.

NSIDC scientist Ted Scambos said, “Antarctica’s changes — in winter, in the sea ice — are due more to wind than to warmth, because the warming does not take much of the sea ice area above the freezing point during winter. Instead, the winds that blow around the continent, the “westerlies,” have gotten stronger in response to a stubbornly cold continent, and the warming ocean and land to the north.”

Weather-Making High-Pressure Systems Predicted
To Intensify In Coming Years!


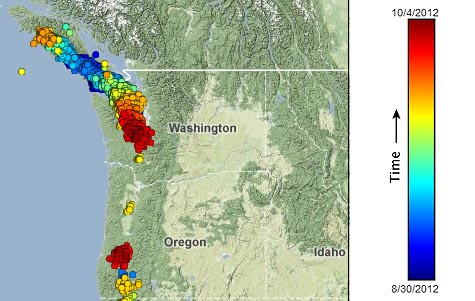
MessageToEagle.com – The intensity of two such high-pressure systems, present over the northern Pacific and Atlantic oceans during the summer, has changed in recent years.

Scientists do not know whether these changes are related to climate warming.

Conducted simulations from the Intergovernmental Panel on Climate Change Fourth Assessment Report suggest that these summertime highs are likely to intensify in the twenty-first century as a result of an increase in atmospheric greenhouse-gas concentrations, according to a Duke University-led study published online this week in Nature Geoscience.


Click on image to enlargeSouth Indian Ocean, Oval-shaped Hole in a Blanket of Marine Stratocumulus Clouds photographed off Australia on June 5, 2012. High-pressure weather systems often bring fair weather and relatively clear skies. In early June 2012, a high off the coast of Tasmania did just that…and in spectacular fashion. The Moderate Resolution Imaging Spectroradiometer (MODIS) on NASA’s Aqua satellite acquired this view of a hole in a cloud formation at 3:00 p.m. local time (05:00 Universal Time) on June 5, 2012.
The weather system over the Great Australian Bight cut out the oval-shaped hole from a blanket of marine stratocumulus clouds. The cloud hole, with a diameter that stretched as far as 1,000 kilometers (620 miles) across, was caused by sinking air associated with an area of high pressure near the surface. Credits: NASA

High-pressure systems over oceans that largely determine the tracks of tropical cyclones and hydrological extremes will posssibly play an increasingly important role regarding drought and extreme summer rainfall.

The black lines of all the historical tropical storm and hurricane paths curving around that subtropical ridge. If that ridge extends far to the west, tropical storms or hurricanes south of it can in turn be forced far to the west. Credits: http://www.weather.com

Changes in the dominant heating component between the twenty-first- and twentieth-century run. p>Blue, red and green colours denote long-wave radiative cooling, sensible heating and condensational heating, respectively, obtained from the CMIP3 multi-model ensemble mean. Credits: Duke University


A team of scientists led by Wenhong Li, assistant professor of earth and ocean sciences at Duke’s Nicholas School of the Environment, conducted a series of simulations predicting future changes in the strength of the annually occurring North Atlantic Subtropical High “subtropical ridge” (also known as the Bermuda High), and the North Pacific Subtropical High.

Based on their results, these changes will intensify over the 21st century as a result of increasing greenhouse-gas concentrations and – the difference between ocean and land heating, as Earth’s climate warms – will fuel the systems’ intensification.

Research paper

© MessageToEagle.com

See also:
Escalating Problem: Satellites See Collapse of the Greenland Glaciers!

************************************************************************************************************

Solar Activity

3MIN News October 5. 2012: Tsunamis on the Sun

Published on Oct 5, 2012 by

Pole Shift Video: http://youtu.be/uI10tKuLtFU

TODAY’S LINKS
China Landslide: http://news.xinhuanet.com/english/china/2012-10/05/c_131889256.htm
F*cking Monsanto: http://news.sciencemag.org/scienceinsider/2012/10/european-food-safety-author…
Head of NOAA: http://news.sciencemag.org/scienceinsider/2012/10/despite-tumult-noaas-lubche…

REPEAT LINKS
Spaceweather: http://spaceweather.com/ [Look on the left at the X-ray Flux and Solar Wind Speed/Density]

HAARP: http://www.haarp.alaska.edu/haarp/data.html [Click online data, and have a little fun]

CERES JPL: http://ssd.jpl.nasa.gov/sbdb.cgi?sstr=ceres;orb=1;cov=0;log=0;cad=0#orb

SDO: http://sdo.gsfc.nasa.gov/data/ [Place to find Solar Images and Videos – as seen from earth]

SOHO: http://sohodata.nascom.nasa.gov/cgi-bin/soho_movie_theater [SOHO; Lasco and EIT – as seen from earth]

Stereo: http://stereo.gsfc.nasa.gov/cgi-bin/images [Stereo; Cor, EUVI, HI – as seen from the side]

SunAEON:http://www.sunaeon.com/#/solarsystem/ [Just click it… trust me]

SOLARIMG: http://solarimg.org/artis/ [All purpose data viewing site]

iSWA: http://iswa.gsfc.nasa.gov/iswa/iSWA.html [Free Application; for advanced sun watchers]

NASA ENLIL SPIRAL: http://iswa.gsfc.nasa.gov:8080/IswaSystemWebApp/iSWACygnetStreamer?timestamp=…
NOAA ENLIL SPIRAL: http://www.swpc.noaa.gov/wsa-enlil/

US Wind Map: http://hint.fm/wind/

NOAA Bouys: http://www.ndbc.noaa.gov/

NOAA Environmental Visualization Laboratory: http://www.nnvl.noaa.gov/Default.php

RSOE: http://hisz.rsoe.hu/alertmap/index2.php [That cool alert map I use]

GOES Xray: http://www.swpc.noaa.gov/sxi/goes15/index.html

JAPAN Radiation Map: http://jciv.iidj.net/map/

LISS: http://earthquake.usgs.gov/monitoring/operations/heliplots_gsn.php

Gamma Ray Bursts: http://grb.sonoma.edu/ [Really? You can’t figure out what this one is for?]

BARTOL Cosmic Rays: http://neutronm.bartol.udel.edu//spaceweather/welcome.html [Top left box, look for BIG blue circles]

TORCON: http://www.weather.com/news/tornado-torcon-index [Tornado Forecast for the day]

GOES Weather: http://rsd.gsfc.nasa.gov/goes/ [Clouds over America]

RAIN RECORDS: http://www.cocorahs.org/ViewData/ListIntensePrecipReports.aspx

EL DORADO WORLD WEATHER MAP: http://www.eldoradocountyweather.com/satellite/ssec/world/world-composite-ir-…

PRESSURE MAP: http://www.woweather.com/cgi-bin/expertcharts?LANG=us&MENU=0000000000&…

HURRICANE TRACKER: http://www.weather.com/weather/hurricanecentral/tracker

INTELLICAST: http://www.intellicast.com/ [Weather site used by many youtubers]

NASA News: http://science.nasa.gov/science-news/science-at-nasa/

PHYSORG: http://phys.org/ [GREAT News Site!]

QUAKES LIST FULL: http://www.emsc-csem.org/Earthquake/seismologist.php

2MIN News October 6. 2012

Published on Oct 6, 2012 by

Pole Shift Video: http://youtu.be/uI10tKuLtFU
STARWATER: http://youtu.be/LiC-92YgZvQ

TODAY’S LINKS
Snow: http://www.weather.com/news/weather-winter/snow-seasons-first-average-20121004

REPEAT LINKS
Spaceweather: http://spaceweather.com/ [Look on the left at the X-ray Flux and Solar Wind Speed/Density]

HAARP: http://www.haarp.alaska.edu/haarp/data.html [Click online data, and have a little fun]

CERES JPL: http://ssd.jpl.nasa.gov/sbdb.cgi?sstr=ceres;orb=1;cov=0;log=0;cad=0#orb

SDO: http://sdo.gsfc.nasa.gov/data/ [Place to find Solar Images and Videos – as seen from earth]

SOHO: http://sohodata.nascom.nasa.gov/cgi-bin/soho_movie_theater [SOHO; Lasco and EIT – as seen from earth]

Stereo: http://stereo.gsfc.nasa.gov/cgi-bin/images [Stereo; Cor, EUVI, HI – as seen from the side]

SunAEON:http://www.sunaeon.com/#/solarsystem/ [Just click it… trust me]

SOLARIMG: http://solarimg.org/artis/ [All purpose data viewing site]

iSWA: http://iswa.gsfc.nasa.gov/iswa/iSWA.html [Free Application; for advanced sun watchers]

NASA ENLIL SPIRAL: http://iswa.gsfc.nasa.gov:8080/IswaSystemWebApp/iSWACygnetStreamer?timestamp=…
NOAA ENLIL SPIRAL: http://www.swpc.noaa.gov/wsa-enlil/

US Wind Map: http://hint.fm/wind/

NOAA Bouys: http://www.ndbc.noaa.gov/

NOAA Environmental Visualization Laboratory: http://www.nnvl.noaa.gov/Default.php

RSOE: http://hisz.rsoe.hu/alertmap/index2.php [That cool alert map I use]

GOES Xray: http://www.swpc.noaa.gov/sxi/goes15/index.html

JAPAN Radiation Map: http://jciv.iidj.net/map/

LISS: http://earthquake.usgs.gov/monitoring/operations/heliplots_gsn.php

Gamma Ray Bursts: http://grb.sonoma.edu/ [Really? You can’t figure out what this one is for?]

BARTOL Cosmic Rays: http://neutronm.bartol.udel.edu//spaceweather/welcome.html [Top left box, look for BIG blue circles]

TORCON: http://www.weather.com/news/tornado-torcon-index [Tornado Forecast for the day]

GOES Weather: http://rsd.gsfc.nasa.gov/goes/ [Clouds over America]

RAIN RECORDS: http://www.cocorahs.org/ViewData/ListIntensePrecipReports.aspx

EL DORADO WORLD WEATHER MAP: http://www.eldoradocountyweather.com/satellite/ssec/world/world-composite-ir-…

PRESSURE MAP: http://www.woweather.com/cgi-bin/expertcharts?LANG=us&MENU=0000000000&…

HURRICANE TRACKER: http://www.weather.com/weather/hurricanecentral/tracker

INTELLICAST: http://www.intellicast.com/ [Weather site used by many youtubers]

NASA News: http://science.nasa.gov/science-news/science-at-nasa/

PHYSORG: http://phys.org/ [GREAT News Site!]

QUAKES LIST FULL: http://www.emsc-csem.org/Earthquake/seismologist.php

3MIN News October 7. 2012

Published on Oct 7, 2012 by

Pole Shift Video: http://youtu.be/uI10tKuLtFU
STARWATER: http://youtu.be/LiC-92YgZvQ

TODAY’S LINKS
Colombia Landslide: http://au.news.yahoo.com/world/a/-/world/15055199/13-missing-in-colombia-muds…
Australia cold: http://www.weatherzone.com.au/news/record-cold-october-day-across-nsw-and-vic…
Canary Quake List: http://www.01.ign.es/ign/layoutIn/volcaListadoTerremotos.do?zona=2&cantid…
Draconid Meteors: http://earthsky.org/tonight/legendary-draconids-boom-or-bust

REPEAT LINKS
Spaceweather: http://spaceweather.com/ [Look on the left at the X-ray Flux and Solar Wind Speed/Density]

HAARP: http://www.haarp.alaska.edu/haarp/data.html [Click online data, and have a little fun]

CERES JPL: http://ssd.jpl.nasa.gov/sbdb.cgi?sstr=ceres;orb=1;cov=0;log=0;cad=0#orb

SDO: http://sdo.gsfc.nasa.gov/data/ [Place to find Solar Images and Videos – as seen from earth]

SOHO: http://sohodata.nascom.nasa.gov/cgi-bin/soho_movie_theater [SOHO; Lasco and EIT – as seen from earth]

Stereo: http://stereo.gsfc.nasa.gov/cgi-bin/images [Stereo; Cor, EUVI, HI – as seen from the side]

SunAEON:http://www.sunaeon.com/#/solarsystem/ [Just click it… trust me]

SOLARIMG: http://solarimg.org/artis/ [All purpose data viewing site]

iSWA: http://iswa.gsfc.nasa.gov/iswa/iSWA.html [Free Application; for advanced sun watchers]

NASA ENLIL SPIRAL: http://iswa.gsfc.nasa.gov:8080/IswaSystemWebApp/iSWACygnetStreamer?timestamp=…
NOAA ENLIL SPIRAL: http://www.swpc.noaa.gov/wsa-enlil/

US Wind Map: http://hint.fm/wind/

NOAA Bouys: http://www.ndbc.noaa.gov/

NOAA Environmental Visualization Laboratory: http://www.nnvl.noaa.gov/Default.php

RSOE: http://hisz.rsoe.hu/alertmap/index2.php [That cool alert map I use]

GOES Xray: http://www.swpc.noaa.gov/sxi/goes15/index.html

JAPAN Radiation Map: http://jciv.iidj.net/map/

LISS: http://earthquake.usgs.gov/monitoring/operations/heliplots_gsn.php

Gamma Ray Bursts: http://grb.sonoma.edu/ [Really? You can’t figure out what this one is for?]

BARTOL Cosmic Rays: http://neutronm.bartol.udel.edu//spaceweather/welcome.html [Top left box, look for BIG blue circles]

TORCON: http://www.weather.com/news/tornado-torcon-index [Tornado Forecast for the day]

GOES Weather: http://rsd.gsfc.nasa.gov/goes/ [Clouds over America]

RAIN RECORDS: http://www.cocorahs.org/ViewData/ListIntensePrecipReports.aspx

EL DORADO WORLD WEATHER MAP: http://www.eldoradocountyweather.com/satellite/ssec/world/world-composite-ir-…

PRESSURE MAP: http://www.woweather.com/cgi-bin/expertcharts?LANG=us&MENU=0000000000&…

HURRICANE TRACKER: http://www.weather.com/weather/hurricanecentral/tracker

INTELLICAST: http://www.intellicast.com/ [Weather site used by many youtubers]

NASA News: http://science.nasa.gov/science-news/science-at-nasa/

PHYSORG: http://phys.org/ [GREAT News Site!]

QUAKES LIST FULL: http://www.emsc-csem.org/Earthquake/seismologist.php

The Past 99 Days

Published on Oct 7, 2012 by

July 1st to October 7th

************************************************************************************************************

Space

 Earth approaching objects (objects that are known in the next 30 days)

Object Name Apporach Date Left AU Distance LD Distance Estimated Diameter* Relative Velocity
(2012 QE50) 09th October 2012 1 day(s) 0.0809 31.5 450 m – 1.0 km 11.47 km/s 41292 km/h
(1994 EK) 14th October 2012 6 day(s) 0.1356 52.8 230 m – 520 m 12.22 km/s 43992 km/h
(2012 PA20) 15th October 2012 7 day(s) 0.1502 58.5 100 m – 230 m 10.36 km/s 37296 km/h
(2012 RV16) 18th October 2012 10 day(s) 0.1270 49.4 310 m – 700 m 16.14 km/s 58104 km/h
214869 (2007 PA8) 05th November 2012 28 day(s) 0.0433 16.8 1.5 km – 3.3 km 10.79 km/s 38844 km/h
(2011 UG21) 06th November 2012 29 day(s) 0.1784 69.4 340 m – 760 m 19.73 km/s 71028 km/h
1 AU = ~150 million kilometers,1 LD = Lunar Distance = ~384,000 kilometers Source: NASA-NEO

NIWAKA Japanese Minisatellite Is Sending A Morse Code Beacon Signal 

MessageToEagle.com – Scientists from Fukuoka Institute of Technology, Japan developed a small artificial satellite named FITSAT-1. It also has the nickname “NIWAKA”.

The shape is a 10cm cube, and the weight is 1.33kg.

The main mission of this satellite is to demonstrate the high speed transmitter developed. It can send a jpeg VGA-picture(480×640) within 6 sec.

NIWAKA, which is now in a regular orbit, was launched from the International Space Station 390 kilometres (242 miles) above Earth at 15:44 on 4th October 2012 (UTC).

NIWAKA will write messages in the night sky with Morse code as:


Click on image to enlargeA Morse code in the night sky – transmitted by a palm sized satellite, NIWAKA designed by scientists from Fukuoka Institute of Technology. Credits: Fukuoka Institute of Technology, Japan

NIWAKA will test the possibility of optical communication by satellite. It will actually twinkle as an artificial star.

The minisatellite’s high power LEDs, which is driven with more than 200W pulses to produce extremely bright flashes, will be observable by the unaided eye or with small binoculars.


Click on image to enlargeThe beacon signal is a standard Morse code CW signal. The signal starts with “HI DE NIWAKA …” and telemetry data follows. Credits: Fukuoka Institute of Technology

The LEDs will also be driven in detecting faint light mode. The light will received by a photo-multiplier equipped telescope linked to the 5.8 GHz parabolic antenna.


Duty 30%, 10Hz signal is modulated with also duty 30%, 5kHz signal. So the average input power will be 220W x 0.3 x 0.3 = 20W. In order to detect the faint light, a high gain amplifier with 5kHz filter may be useful.

While, the Morse code is modulated with duty 15%, 1kHz signal. So, the signal can directly drive a speaker with AF-amplifier to hear Morse sound.


Click on image to enlargeFlight Model – Credits: Fukuoka Institute of Technology

The NIWAKA body is made by cutting a section of 10cm square aluminum pipe. Both ends of the cut pipe are covered with aluminum plates. The surface of the body is finished with black anodic coating.


Click on image to enlargeBottom View of The Model – Credits: Fukuoka Institute of Technology

The CubeSat slide rails and side plates are not separate; they are made as a single unit. The thickness of the square pipe is 3mm, but the surfaces attached by solar cells are thinned to 1.5mm because of weight limit.

In order to make the 8.5mm square CubeSat rails, 5.5mm square aluminum sticks are attached to the four corners of the square pipe.


Click on image to enlargeCredits: Fukuoka Institute of Technology

The trajectory of the ISS is inclined 51.6 deg from the equator, so NIWAKA will travel between 51.6 degrees south latitude and 51.6 degrees north latitude.

NIWAKA minisatellite will carry a mounted neodymium magnet to force it to always point to magnetic north like a compass. When NIWAKA rises above the horizon, it will be to the south of the Fukuoka ground station, and both the 5.8 GHz antenna and the LEDs will be aimed accurately enough by the magnet aligning itself and the satellite with the earth’s magnetic field that the Fukuoka ground station will be within the main beams.


Click on image to enlargeScientists perform both 5.8 GHz high-speed and optical communication experiments for about 3 minutes as the satellite travels along the orbit shown as the red line in the figure. Credits: Fukuoka Institute of Technology

After Deployment from NASA pictures:


Click on image to enlargeCredits: Fukuoka Institute of Technology


Click on image to enlargeCredits: Fukuoka Institute of Technology


Click on image to enlargeProfessor Takushi Tanaka holding a palm sized satellite at his laboratory in Fukuoka. Credits: Fukuoka Institute of Technology

Scientists will perform both 5.8 GHz high-speed and optical communication experiments for about 3 minutes as the satellite travels along the orbit shown as the red line in the figure.

MessageToEagle.com

See also:
Dawn Spacecraft Is Heading Towards Dwarf Planet Ceres To Investigate The Formation Of Our Solar System

X-Ray Nova Reveals A New Black Hole 

MessageToEagle.com – A new stellar-mass black hole has been discovered in our Milky Way galaxy by NASA’s Swift satellite.

The presence of a previously unknown black hole, was revealed by high-energy X-rays emanating from a source towards the center of our galaxy.

“Bright X-ray novae are so rare that they’re essentially once-a- mission events and this is the first one Swift has seen,” according to Neil Gehrels, the mission’s principal investigator at NASA’s Goddard Space Flight Center.


Click on image to enlargeCredit: NASA’s Goddard Space Flight Center

“This is really something we’ve been waiting for.”

An X-ray nova is a short-lived X-ray source that appears suddenly, reaches its emission peak in a few days and then fades out over a period of months. The outburst arises when a torrent of stored gas suddenly rushes toward one of the most compact objects known.


The nova – dubbed Swift J1745-26 – is located a few degrees from the center of our galaxy toward the constellation Sagittarius. While astronomers do not know its precise distance, they think the object resides about 20,000 to 30,000 light-years away in the galaxy’s inner region.

The nova peaked in X-rays — energies above 10,000 electron volts, or several thousand times that of visible light — on September 18, when it reached an intensity equivalent to that of the famous Crab Nebula, a supernova remnant that serves as a calibration target for high-energy observatories and is considered one of the brightest sources beyond the solar system at these energies.


Click on image to enlargeCredit: NASA’s Goddard Space Flight Center

As it dimmed at higher energies, the nova brightened in the lower-energy emissions detected by Swift’s X-ray Telescope.

“The pattern we’re seeing is observed in X-ray novae where the central object is a black hole,” said Boris Sbarufatti, an astrophysicist at Brera Observatory in Milan, who currently is working with other Swift team members at Pennsylvania State

“Once the X-rays fade away, we hope to measure its mass and confirm its black hole status.”

MessageToEagle.com

See also:
Halo Of Hot Gas Surrounds The Milky Way

*************************************************************************************************************

Biological Hazards / Wildlife /Hazmat

Officials baffled as Nearly 8,500 Deer found Dead in Michigan in recent weeks due to mystery Virus

Published on Oct 4, 2012 by

(Oct 4, 2012) Almost 8,500 deer across Michigan have died from EHD according to the Michigan Department of Natural Resources. EHD is a disease that causes deer to suffer a high fever and internal bleeding. The DNR says a small fly known as a midge bites the deer transferring the disease. Officials say nearly half of the deer that have died from EHD have been found in Ionia County. Just two days into bow hunting season and many are talking about the problem. Steve Hayes, a manager at Bob’s Gun and Tackle Shop in Barry County, says people are not putting away their bows just yet.”Our customers are concerned, they are also concerned sportsman too. They’re deciding if they are going to back off on the number of deer they are going to shoot this year, but what we are seeing so far is most people are still interested in going out and doing some deer hunting,” said Hayes. James Waller says the outbreak will cause him to cutback because he has a concern of wiping out too many prize game. Waller says he usually gets out around 15-20 times per season.”A lot of the big bucks, the DNA that is there, we are losing that gene of that deer. We’re trying to create a really good herd to raise some nice deer,” said Waller. “Something like this comes along and it wipes out a lot of work, time and effort.””We’re going to be carefully watching the situation to and watching how it affects business, so we can react to that going forward,” says Hayes. A frost is expected to hit as early as this weekend, leaving many hopeful it will put an end to the disease and see hunting season can return to normal. http://www.wlns.com/story/19724898/dnr-over-8000-deer-dead-in-michigan

(Zephaniah 1:2-3) “I will utterly consume all things from off the land, saith the Lord.I will consume man and beast; I will consume the fowls of the heaven, and the fishes of the sea, and the stumbling blocks with the wicked: and I will cut off man from off the land, saith the Lord.”

(Hosea 4:3) “Therefore shall the land mourn, and every one that dwelleth therein shall languish, with the beasts of the field, and with the fowls of heaven; yea, the fishes of the sea also shall be taken away.”

06.10.2012 HAZMAT USA State of Texas, Halliburton Damage level Details


HAZMAT in USA on Friday, 14 September, 2012 at 03:03 (03:03 AM) UTC.

Back

Updated: Saturday, 06 October, 2012 at 03:42 UTC
Description
A small radioactive cylinder that went missing from a Halliburton (HAL) truck last month was found on a Texas road late Thursday, the company said, ending a weeks-long hunt for the device that involved local, state and federal authorities. The seven-inch stainless steel tube, which contained a small amount of radioactive material, was lost by an oil-and-gas crew somewhere along the 130-mile journey from the vicinity of Pecos to Odessa, in West Texas. A Halliburton spokesman said Friday that the device was found late Thursday on a road in Reeves County, Texas. The company first reported it missing to the state health department on Sept. 11, according to another report to the U.S. Nuclear Regulatory Commission. State officials, company inspectors and members of a Texas National Guard unit had combed the area for the device, which is used in the process of measuring and evaluating conditions within oil and gas wells. The Nuclear Regulatory Commission report stated that the tube was a “category 3” radioactive device, a class that includes some pacemakers.
07.10.2012 HAZMAT India State of Maharashtra, Jalgaon Damage level Details

HAZMAT in India on Sunday, 07 October, 2012 at 14:18 (02:18 PM) UTC.

Description
Over 50 labourers fell ill on Sunday in an industrial area of Jalgaon city in Maharashtra owing to a chlorine gas leak from a factory, police said. “The workers belonged to a factory called Tulsi Pipes. They suffered from breathing problems and acute vomiting as one of the 25 chlorine cylinders stacked in the adjoining Kalpataru Agro-Chem Industries leaked,” an official from Jalgaon police station said. The manager of Kalpataru Agro-Chem told police that the cylinders were kept on the factory premises for being taken to another plant. He said that he did not know how the chlorine leaked from one of the cylinders, police said. “All victims have been sent to hospital. While 10 labourers are still under medical care, others have been discharged,” the official added. A complaint has been registered by one of the labourers, Mohammed Aslam Mehboob Ilahi, against owners of Kalpataru Agro-Chem under Indian Penal Code Sections 284 (negligent conduct with respect to poisonous substance), 336 (act endangering life or personal safety of other), 337 (causing hurt by act endangering life or personal safety of other) and 338 (causing grievous hurt by act endangering life or personal safety of other), the official said.

*************************************************************************************************************

[In accordance with Title 17 U.S.C. Section 107, this material is distributed without profit, for research and/or educational purposes. This constitutes ‘FAIR USE’ of any such copyrighted material.]

Earthquakes

USGS

MAG UTC DATE-TIME
y/m/d h:m:s
LAT
deg
LON
deg
DEPTH
km
 Region
MAP  3.2 2012/09/27 23:59:40   18.546   -68.963 101.0  DOMINICAN REPUBLIC
MAP  6.0   2012/09/27 23:53:49   -8.825   157.557 10.0  SOLOMON ISLANDS
MAP  4.8   2012/09/27 22:18:21  -22.905   -68.620 86.1  ANTOFAGASTA, CHILE
MAP  3.3 2012/09/27 21:06:05   19.631   -64.225 62.0  VIRGIN ISLANDS REGION
MAP  5.0   2012/09/27 16:54:44  -24.893  -179.256 515.1  SOUTH OF THE FIJI ISLANDS
MAP  4.8   2012/09/27 16:39:00  -20.066   -69.068 94.3  TARAPACA, CHILE
MAP  4.2 2012/09/27 15:36:08   24.693  -110.239 14.8  GULF OF CALIFORNIA
MAP  4.5   2012/09/27 13:14:30   15.442   -91.632 228.7  GUATEMALA
MAP  4.5   2012/09/27 12:38:43   37.629   95.888 32.9  NORTHERN QINGHAI, CHINA
MAP  4.0 2012/09/27 11:24:11   24.419  -110.135 10.2  GULF OF CALIFORNIA
MAP  3.5 2012/09/27 10:41:15   61.984  -154.418 36.4  SOUTHERN ALASKA
MAP  4.8   2012/09/27 10:28:41   -9.422   123.543 98.1  TIMOR REGION, INDONESIA
MAP  2.6 2012/09/27 09:44:48   19.410  -155.304 4.0  ISLAND OF HAWAII, HAWAII
MAP  3.2 2012/09/27 08:36:34   36.890  -117.414 7.6  CENTRAL CALIFORNIA
MAP  2.5 2012/09/27 08:04:29   63.355  -151.197 10.6  CENTRAL ALASKA
MAP  4.5   2012/09/27 07:16:10   51.653  -177.636 35.7  ANDREANOF ISLANDS, ALEUTIAN IS., ALASKA
MAP  2.7 2012/09/27 05:58:59   38.827  -122.851 2.7  NORTHERN CALIFORNIA
MAP  2.6 2012/09/27 05:39:23   39.417  -123.535 3.2  NORTHERN CALIFORNIA
MAP  2.5 2012/09/27 05:21:53   39.467  -123.110 3.9  NORTHERN CALIFORNIA
MAP  2.8 2012/09/27 05:02:20   59.693  -152.430 67.9  SOUTHERN ALASKA
MAP  3.2 2012/09/27 04:23:58   19.694   -64.231 50.0  VIRGIN ISLANDS REGION
MAP  3.7 2012/09/27 04:12:45   62.877  -150.522 92.1  CENTRAL ALASKA
MAP  3.1 2012/09/27 04:03:04   19.676   -64.369 36.0  VIRGIN ISLANDS REGION
MAP  2.7 2012/09/27 03:50:39   18.045   -66.858 22.0  PUERTO RICO
MAP  2.6 2012/09/27 03:45:04   61.149  -150.911 50.8  SOUTHERN ALASKA
MAP  4.5   2012/09/27 03:28:52   51.728  -177.860 44.5  ANDREANOF ISLANDS, ALEUTIAN IS., ALASKA
MAP  4.7   2012/09/27 01:36:29  -23.208   -66.655 190.3  JUJUY, ARGENTINA
MAP  4.7   2012/09/27 01:08:24   41.218   15.026 5.0  SOUTHERN ITALY
MAP  4.5   2012/09/27 00:56:04   38.412   46.709 10.0  NORTHWESTERN IRAN

…………………………………..

6.0 magnitude quake hits off Solomon Islands: USGS

Agencies : Sydney,

A quake measuring magnitude 6.0 hit off the Solomon Islands today, but Australian seismologists said there was little risk of a tsunami.

The US Geological Survey put the quake at 6.0-magnitude some 272 kilometres west-northwest of the capital Honiara. With a depth of about 9 kilometres, it was about 112 kilometres southeast of the western city of Gizo.

Geoscience Australia measured the quake at about 6.2-magnitude but said it was unlikely to create a tsunami or cause serious damage in the capital.

“It’s just off the plate boundary so it’s a normal-sized earthquake and positioning for the area,” seismologist Hugh Glanville told AFP.

“It’s not too close to Honiara. There’s a local city with a population of about 6,000 or so that might get a bit of damage,” he said in reference to Gizo.

“But the majority of the population is a bit too far away to suffer more than a bit of shaking. And the population in the area is pretty sparse really.”

Glanville also said the quake was too small to generate a tsunami.

“Generally a local tsunami starts at about 6.5 (magnitude). It’s always possible, but it’s just extremely rare that it would generate a tsunami,” he said.

“It’s just one of the plate boundary earthquakes along the Ring of Fire that normally happens in this area.”

The Solomon Islands form part of the Ring of Fire, a zone of tectonic activity around the Pacific Ocean that is subject to earthquakes and volcanic eruptions.

In 2007 a tsunami following an 8.1-magnitude earthquake killed at least 52 people in the Solomons and left thousands homeless.

Matt Burrows Reporting
    The San Andreas, Calaveras, and Hayward fault lines -which run underneath Silicon Valley – could set off tremors and aftershocks globally, according to a new study.
Researchers at UC Berkeley and the U.S. Geological Survey found that fault lines of the “strike-slip” type, where plates of land slide past each other, were more likely to set off the worldwide aftershocks.
As an example, the researchers found the 8.6 earthquake in Indonesia this April set off 16 earthquakes with a magnitude of 5.5 or greater within days.
Not only could these “strike slip” faults like the San Andreas, Calaveras, and Hayward faults set off worldwide aftershocks, but the researchers indicate the faults could also be set off if another earthquake’s tremors struck when the fault was ready to rupture.
However, the study indicates a quake powerful enough to do that only happens once every 50 years or so.

Sumatran quakes in April were part of tectonic plate breakup

Scientists document an episode in the breakup of the Indo-Australian plate into two pieces, an epic process that began roughly 50 million years ago and isn’t done yet.

 Sumatran earthquakeA woman and her baby evacuate to higher ground after a strong earthquake in Sumatra in April. (Heri Juanda / Associated Press / April 11, 2012)

By Monte Morin, Los Angeles Times

Planet Earth may be 4.5 billion years old, but that doesn’t mean it can’t serve up a shattering surprise now and again.

Such was the case on April 11 when two massive earthquakes erupted beneath the Indian Ocean off the coast of the Indonesian island of Sumatra, far from the usual danger zones. Now scientists say the seafloor ruptures are part of a long suspected, yet never before observed, event: the slow-motion splitting of a vast tectonic plate.

The first of the quakes, a magnitude 8.7, was 20 times more powerful than California’s long anticipated “big one” and tore a complex network of faults deep in the ocean floor. The violence also triggered unusually large aftershocks thousands of miles away, including four off North America’s western coast.

“It was jaw-dropping,” said Thorne Lay, a professor of Earth and planetary sciences at UC Santa Cruz. “It was like nothing we’d ever seen.”

At first, Lay wondered whether the computer code he used to analyze earthquakes was wrong. Eventually, he and other scientists realized that they had documented the breakup of the Indo-Australian plate into two pieces, an epic process that began roughly 50 million years ago and will continue for tens of millions more. Lay and other scientists reported their findings online Wednesday in the journal Nature.

Most great earthquakes occur along plate borders, where one plate dives beneath the adjoining plate and sinks deep into Earth’s mantle, a process called subduction. The April 11 quakes, however, occurred in the middle of the plate and involved a number of strike-slip faults, meaning the ground on one side of the fault moves horizontally past ground on the other side.

Scientists say the 8.7 main shock broke four faults. The quake lasted 2 minutes and 40 seconds — most last just seconds — and was followed by a second main shock, of magnitude 8.2, two hours later.

Unlike the magnitude 9.1 temblor that struck in the same region on Dec. 26, 2004, and created a deadly tsunami, the April 11 quakes did not cause similar destruction. That’s because horizontally moving strike-slip faults do not induce the massive, vertical displacement of water that thrust faults do on the borders of plates.

The type of interplate faults involved in the Sumatran quakes are the result of monumental forces, some of which drove the land mass of India into Asia millions of years ago and lifted the Himalayan Mountains. As the Indo-Australian plate continues to slide northwest, the western portion of the plate, where India is, has been grinding against and underneath Asia. But the eastern portion of the plate, which contains Australia, keeps on moving without the same obstruction. That difference creates squeezing pressure in the area where the quakes occurred.

The study authors say that over time, as more quakes occur and new ruptures appear, the cracks will eventually coalesce into a single fissure.

“This is part of the messy business of breaking up a plate,” said University of Utah seismologist Keith Koper, senior author of one of the studies. “Most likely it will take thousands of similar large quakes for that to happen.”

The quakes were also notable for triggering powerful aftershocks thousands of miles away. Though major quakes have been known to trigger aftershocks at great distance, they are usually less than 5.5 in magnitude. The April earthquakes triggered 11 aftershocks that measured 5.5 or greater in the six days that followed, including a magnitude 7. Remote shocks were felt 6,000 to 12,000 miles from the main quakes.

Fred Pollitz, a geophysicist with the U.S. Geological Survey in Menlo Park, Calif., and lead author of one of the studies, said the quakes were extremely effective in transmitting seismic wave radiation around the world. Though Pollitz said the magnitude of the larger Sumatran quake is No. 10 on the list of quakes since 1900, no other temblor has triggered so many strong aftershocks so far away.

“It’s the most powerful earthquake ever in terms of capability of putting stress on other fault zones around the world,” he said.

Pollitz said the quakes were likely to teach seismologists about the physics of earthquakes, particularly those along strike-slip faults. That knowledge, he said, would certainly apply to California’s San Andreas fault, which is also a strike-slip fault.

Lay said that the Sumatran quakes were most surprising in that they were completely unanticipated by seismologists and that he did not expect the event to repeat any time soon.

monte.morin@latimes.com

Big quake was part of crustal plate breakup

by Staff Writers
Salt Lake City UT (SPX)


This map of the Indian Ocean region shows boundaries of Earth’s tectonic plates in the area, and the epicenters (red stars) of two great earthquakes that happened April 11, 2012. A new study from the University of Utah and University of California, Santa Cruz, says the main shock measured 8.7 in magnitude, about 40 times larger than the previous estimate of 8.6. An 8.2-magnitude quake followed two hours later.The scientists explain how at least four faults ruptured during the 8.7 main shock, and how both great quakes are likely part of the breakup of the Indo-Australian Plate into separate subplates. The northeastward-moving plate is breaking up over scores of millions of years because the western part of the plate is bumping into Asia and slowing down, while the eastern part is sliding more easily beneath Sumatra and the Sunda plate. Credit: Keith Koper, University of Utah Seismograph Stations.

Seismologists have known for years that the Indo-Australian plate of Earth’s crust is slowly breaking apart, but they saw it in action last April when at least four faults broke in a magnitude-8.7 earthquake that may be the largest of its type ever recorded.

The great Indian Ocean quake of April 11, 2012 previously was reported as 8.6 magnitude, and the new estimate means the quake was 40 percent larger than had been believed, scientists from the University of Utah and University of California, Santa Cruz, report in the Sept. 27 issue of the journal Nature.

The quake was caused by at least four undersea fault ruptures southwest of Sumatra, Indonesia, within a 2-minute, 40-second period. It killed at least two people, and eight others died from heart attacks. The quake was felt from India to Australia, including throughout South Asia and Southeast Asia.

If the four ruptures were considered separate quakes, their magnitudes would have been 8.5, 7.9, 8.3 and 7.8 on the “moment magnitude” scale used to measure the largest quakes, the scientists report.

The 8.7 main shock broke three faults that were parallel but offset from each other – known as en echelon faults – and a fourth fault that was perpendicular to and crossed the first fault.

The new study concludes that the magnitude-8.7 quake and an 8.2 quake two hours later were part of the breakup of the Indian and Australian subplates along a yet-unclear boundary beneath the Indian Ocean west of Sumatra and southeast of India – a process that started roughly 50 million years ago and that will continue for millions more.

“We’ve never seen an earthquake like this,” says study co-author Keith Koper, an associate professor geophysics and director of the University of Utah Seismograph Stations.

“This is part of the messy business of breaking up a plate. … This is a geologic process. It will take millions of years to form a new plate boundary and, most likely, it will take thousands of similar large quakes for that to happen.”

All four faults that broke in the 8.7 quake and the fifth fault that ruptured in the 8.2 quake were strike-slip faults, meaning ground on one side of the fault moves horizontally past ground on the other side.

The great quake of last April 11 “is possibly the largest strike-slip earthquake ever seismically recorded,” although a similar size quake in Tibet in 1950 was of an unknown type, according to the new study, which was led by two University of California, Santa Cruz, seismologists: graduate student Han Yue and Thorne Lay, a professor of Earth and planetary sciences. The National Science Foundation funded the study.

The 8.7 jolt also “is probably the largest intraplate [within a single tectonic plate of Earth’s crust] ever seismically recorded,” Lay, Yue and Koper add. Most of Earth’s earthquakes occur at existing plate boundaries.

The researchers cannot be certain the April great quake was the largest intraplate quake or the largest strike-slip quake because “we are comparing it against historic earthquakes long before we had modern seismometers,” says Koper.

Why the Great Quake Didn’t Unleash Major Tsunamis
Koper says the 2012 quakes likely were triggered, at least in part, by changes in crustal stresses caused by the magnitude-9.1 Sumatra-Andaman earthquake of Dec. 26, 2004 – a jolt that generated massive tsunamis that killed most of the 228,000 victims in the Indian Ocean region.

The fact the 8.7 and 8.2 quakes were generated by horizontal movements along seafloor strike-slip faults – not by vertical motion along thrust faults – explains why they didn’t generate major tsunamis. The 8.7 quake caused small tsunamis, the largest of which measured about 12 inches in height at Meulaboh, Indonesia, according to the U.S. Geological Survey.

Without major tsunamis, the great earthquake caused “very little damage and death, especially for this size of an earthquake, because it happened in the ocean and away from coastlines,” and on strike-slip faults, says Koper.

The researchers studied the quake using a variety of methods to analyze the seismic waves it generated. Because the same data can be interpreted in various ways, Koper says it is conceivable that more than four fault segments broke during the 8.7 quake – conceivably five or even six – although four fault ruptures is most likely.

Breaking Up is Hard to Do
The Indo-Australian plate is breaking into two or perhaps three pieces (some believe a Capricorn subplate is separating from the west side of the Indian subplate). The magnitude-8.7 and 8.2 great quakes on April 11 occurred over a broad area where the India and Australian subplates are being sheared apart.

“What we’re seeing here is the Indo-Australian plate fragmenting into two separate plates,” says Lay.

The breakup of the northeast-moving Indo-Australian plate is happening because it is colliding with Asia in the northwest, which slows down the western part of the plate, while the eastern part of the plate continues moving more easily by diving or “subducting” under the island of Sumatra to the northeast. The subduction zone off Sumatra caused the catastrophic 2004 magnitude-9.1 quake and tsunami.

Seismic analysis shows the April 11 quakes “involve rupture of a very complex network of faults, for which we have no documented precedent in recorded seismic history,” the researchers write.

The analysis revealed this sequence for the faults ruptures that generated the 8.7 quake, and the estimated fault rupture lengths and slippage amounts:

+ The quake began with the 50-second rupture of a fault extending west-northwest to east-southeast, with an epicenter a few hundred miles southwest of Sumatra. The fault ruptured along a roughly 90-mile length, breaking “bilaterally” both west-northwestward and east-southeastward, and also at least 30 miles deep, “almost ripping through the whole plate,” Koper says. The seafloor on one side of the fault slipped about 100 feet past the seafloor on the fault’s other side.

+ The second fault, which slipped about 25 feet, began to rupture 40 seconds after the quake began. This rupture extended an estimated 60 miles to 120 miles north-northeast to south-southwest – perpendicular to the first fault and crossing it.

+ The third fault was parallel to the first fault and about 90 to the miles southwest of it. It started breaking 70 seconds after the quake began and ruptured along a length of about 90 miles. This fault slipped about 70 feet.

+ The fourth fault paralleled the first and third faults, but was to the northwest of both of them. It began to rupture 145 seconds after the quake began and continued to do so for 15 seconds until the quake ended after a total time of 2 minutes and 40 seconds. The fault rupture was roughly 30 miles to 60 miles long. The ground on one side of this fault slipped about 20 feet past ground on the other side.

Related Links
University of Utah
Tectonic Science and News

LISS – Live Internet Seismic Server

GSN Stations

These data update automatically every 30 minutes. Last update: September 28, 2012 10:49:03 UTC

Seismograms may take several moments to load. Click on a plot to see larger image.

CU/ANWB, Willy Bob, Antigua and Barbuda

 ANWB 24hr plot

CU/BBGH, Gun Hill, Barbados

 BBGH 24hr plot

CU/BCIP, Isla Barro Colorado, Panama

 BCIP 24hr plot

CU/GRGR, Grenville, Grenada

 GRGR 24hr plot

CU/GRTK, Grand Turk, Turks and Caicos Islands

 GRTK 24hr plot

CU/GTBY, Guantanamo Bay, Cuba

 GTBY 24hr plot

CU/MTDJ, Mount Denham, Jamaica

 MTDJ 24hr plot

CU/SDDR, Presa de Sabaneta, Dominican Republic

 SDDR 24hr plot

CU/TGUH, Tegucigalpa, Honduras

 TGUH 24hr plot

IC/BJT, Baijiatuan, Beijing, China

 BJT 24hr plot

IC/ENH, Enshi, China

 ENH 24hr plot

IC/HIA, Hailar, Neimenggu Province, China

 HIA 24hr plot

IC/LSA, Lhasa, China

 LSA 24hr plot

IC/MDJ, Mudanjiang, China

 MDJ 24hr plot

IC/QIZ, Qiongzhong, Guangduong Province, China

 QIZ 24hr plot

IU/ADK, Aleutian Islands, Alaska, USA

 ADK 24hr plot

IU/AFI, Afiamalu, Samoa

 AFI 24hr plot

IU/ANMO, Albuquerque, New Mexico, USA

 ANMO 24hr plot

IU/ANTO, Ankara, Turkey

 ANTO 24hr plot

IU/BBSR, Bermuda

 BBSR 24hr plot

IU/BILL, Bilibino, Russia

 BILL 24hr plot

IU/CASY, Casey, Antarctica

 CASY 24hr plot

IU/CCM, Cathedral Cave, Missouri, USA

 CCM 24hr plot

IU/CHTO, Chiang Mai, Thailand

 CHTO 24hr plot

IU/COLA, College Outpost, Alaska, USA

 COLA 24hr plot

IU/COR, Corvallis, Oregon, USA

 COR 24hr plot

IU/CTAO, Charters Towers, Australia

 CTAO 24hr plot

IU/DAV,Davao, Philippines

 DAV 24hr plot

IU/DWPF,Disney Wilderness Preserve, Florida, USA

 DWPF 24hr plot

IU/FUNA,Funafuti, Tuvalu

 FUNA 24hr plot

IU/FURI, Mt. Furi, Ethiopia

 FURI 24hr plot

IU/GNI, Garni, Armenia

 GNI 24hr plot

IU/GRFO, Grafenberg, Germany

 GRFO 24hr plot

IU/GUMO, Guam, Mariana Islands

 GUMO 24hr plot

IU/HKT, Hockley, Texas, USA

 HKT 24hr plot

IU/HNR, Honiara, Solomon Islands

 HNR 24hr plot

IU/HRV, Adam Dziewonski Observatory (Oak Ridge), Massachusetts, USA

 HRV 24hr plot

IU/INCN, Inchon, Republic of Korea

 INCN 24hr plot

IU/JOHN, Johnston Island, Pacific Ocean

 JOHN 24hr plot

IU/KBS, Ny-Alesund, Spitzbergen, Norway

 KBS 24hr plot

IU/KEV, Kevo, Finland

 KEV 24hr plot

IU/KIEV, Kiev, Ukraine

 KIEV 24hr plot

IU/KIP, Kipapa, Hawaii, USA

 KIP 24hr plot

IU/KMBO, Kilima Mbogo, Kenya

 KMBO 24hr plot

IU/KNTN, Kanton Island, Kiribati

 KNTN 24hr plot

IU/KONO, Kongsberg, Norway

 KONO 24hr plot

IU/KOWA, Kowa, Mali

 KOWA 24hr plot

IU/LCO, Las Campanas Astronomical Observatory, Chile

 LCO 24hr plot

IU/LSZ, Lusaka, Zambia

 LSZ 24hr plot

IU/LVC, Limon Verde, Chile

 LVC 24hr plot

IU/MA2, Magadan, Russia

 MA2 24hr plot

IU/MAJO, Matsushiro, Japan

 MAJO 24hr plot

IU/MAKZ,Makanchi, Kazakhstan

 MAKZ 24hr plot

IU/MBWA, Marble Bar, Western Australia

 MBWA 24hr plot

IU/MIDW, Midway Island, Pacific Ocean, USA

 MIDW 24hr plot

IU/MSKU, Masuku, Gabon

 MSKU 24hr plot

IU/NWAO, Narrogin, Australia

 NWAO 24hr plot

IU/OTAV, Otavalo, Equador

 OTAV 24hr plot

IU/PAB, San Pablo, Spain

 PAB 24hr plot

IU/PAYG Puerto Ayora, Galapagos Islands

 PAYG 24hr plot

IU/PET, Petropavlovsk, Russia

 PET 24hr plot

IU/PMG, Port Moresby, Papua New Guinea

 PMG 24hr plot

IU/PMSA, Palmer Station, Antarctica

 PMSA 24hr plot

IU/POHA, Pohakaloa, Hawaii

 POHA 24hr plot

IU/PTCN, Pitcairn Island, South Pacific

 PTCN 24hr plot

IU/PTGA, Pitinga, Brazil

 PTGA 24hr plot

IU/QSPA, South Pole, Antarctica

 QSPA 24hr plot

IU/RAO, Raoul, Kermandec Islands

 RAO 24hr plot

IU/RAR, Rarotonga, Cook Islands

 RAR 24hr plot

IU/RCBR, Riachuelo, Brazil

 RCBR 24hr plot

IU/RSSD, Black Hills, South Dakota, USA

 RSSD 24hr plot

IU/SAML, Samuel, Brazil

 SAML 24hr plot

IU/SBA, Scott Base, Antarctica

 SBA 24hr plot

IU/SDV, Santo Domingo, Venezuela

 SDV 24hr plot

IU/SFJD, Sondre Stromfjord, Greenland

 SFJD 24hr plot

IU/SJG, San Juan, Puerto Rico

 SJG 24hr plot

IU/SLBS, Sierra la Laguna Baja California Sur, Mexico

 SLBS 24hr plot

IU/SNZO, South Karori, New Zealand

 SNZO 24hr plot

IU/SSPA, Standing Stone, Pennsylvania USA

 SSPA 24hr plot

IU/TARA, Tarawa Island, Republic of Kiribati

 TARA 24hr plot

IU/TATO, Taipei, Taiwan

 TATO 24hr plot

IU/TEIG, Tepich, Yucatan, Mexico

 TEIG 24hr plot

IU/TIXI, Tiksi, Russia

 TIXI 24hr plot

IU/TRIS, Tristan da Cunha, Atlantic Ocean

 TRIS 24hr plot

IU/TRQA, Tornquist, Argentina

 TRQA 24hr plot

IU/TSUM, Tsumeb, Namibia

 TSUM 24hr plot

IU/TUC, Tucson, Arizona

 TUC 24hr plot

IU/ULN, Ulaanbaatar, Mongolia

 ULN 24hr plot

IU/WAKE, Wake Island, Pacific Ocean

 WAKE 24hr plot

IU/WCI, Wyandotte Cave, Indiana, USA

 WCI 24hr plot

IU/WVT, Waverly, Tennessee, USA

 WVT 24hr plot

IU/XMAS, Kiritimati Island, Republic of Kiribati

 XMAS 24hr plot

IU/YAK, Yakutsk, Russia

 YAK 24hr plot

IU/YSS, Yuzhno Sakhalinsk, Russia

 YSS 24hr plot

**********************************************************************************************************

Volcanic Activity

Volcano erupts with smoke on Sumatra

A volcano has erupted on Indonesia’s Sumatra island, spewing thick grey smoke up to 1.5 kilometres into the sky.

Monitoring official Suparno says Mount Marapi’s eruption on Wednesday is its strongest since August last year, when its status was raised to level three out of four.

Suparno, who uses one name, says there is no plan for an evacuation because the nearest villages are far beyond the danger zone of three kilometres from the crater.

Marapi is among about 129 active volcanos in Indonesia, which is located on the Pacific Ring of Fire, an arc of volcanos and fault lines encircling the Pacific Basin.

Its last major eruption in 1992 killed a climber and injured several others, including two American tourists.

Today Volcano Activity China Baekdu Mountain, [Changbaishan Volcano] Damage level Details

Volcano Activity in China on Friday, 28 September, 2012 at 02:31 (02:31 AM) UTC.

Description
A volcano on the border of China and North Korea is showing signs of increasing activity and could erupt in the next few decades, Chinese researchers say. A massive eruption of Changbaishan around 1,100 years ago spread ash and volcanic gases for 30 miles and left a 3-mile-wide crater atop the volcano, scientists said. Three smaller eruptions have occurred since then, the most recent in 1903, they said. Seismic activity, ground deformation and gas emissions recorded in a period of heightened activity from 2002 to 2006 suggests the magma chamber beneath the volcano is growing. This activity suggests an explosion could occur in the next couple of decades, researchers said. “We need to upgrade our current monitoring system in order to be able to meet the need for the early warning system for Changbaishan,” Jiandong Xu, a vulcanologist at the China Earthquake Administration in Beijing. Of the dozen or so volcanoes located in mainland China Changbaishan is the most likely to experience an eruption with potential catastrophic effects, Xu said.
27.09.2012 Volcano Eruption Indonesia West Sumatra, [Mount Marapi Volcano] Damage level Details

Volcano Eruption in Indonesia on Wednesday, 26 September, 2012 at 18:03 (06:03 PM) UTC.

Description
A volcano has erupted on Indonesia’s Sumatra island, spewing thick grey smoke up to 1.5 kilometres into the sky. Monitoring official Suparno says Mount Marapi’s eruption on Wednesday is its strongest since August last year, when its status was raised to level three out of four. Suparno, who uses one name, says there is no plan for an evacuation because the nearest villages are far beyond the danger zone of three kilometres from the crater.
27.09.2012 Volcano Eruption Mexico States of Puebla and Mexico, [Popocatepetl Volcano] Damage level Details

Volcano Eruption in Mexico on Wednesday, 26 September, 2012 at 03:15 (03:15 AM) UTC.

Description
At least 26 eruptions accompanied by steam and gas, as well as a volcano tectonic quake were registered as a consequence of the Mexican volcano Popocatépetl activity during the last hours, it was reported Tuesday. The National Center of Disaster Prevention (Cenapred) said eruptions were of low and medium intensity with no ash expulsion in any of them. According to the institution, the volcano tectonic quake was registered at 11.54 local time (16:54 GMT). At this moment, the alert light of volcano activity remains yellow phase 2 and the surrounding population to keep informed as to alerts on the activity of the volcano also known as Don Goyo. Traffic between Santiago Xalitzintla and San Pedro Nexapa, via the Cortes passage, is under control. The Popo is located at the center of the country, in the territorial limits of the Morelos, Puebla and Mexico states. Located 55 kilometers Southeast of the Federal District, the Popocatépetl is the second highest volcano in Mexico, with a maximum height of five thousand 458 meters above sea level, only second to the Pico de Orizaba (Veracruz) with five thousand 610 meters.

***********************************************************************************************************

Storms / Flooding / Tornadoes

 Active tropical storm system(s)
Name of storm system Location Formed Last update Last category Course Wind Speed Gust Wave Source Details
Nadine (AL14) Atlantic Ocean 11.09.2012 27.09.2012 Tropical Depression 240 ° 93 km/h 111 km/h 4.88 m NOAA NHC Details

Tropical Storm data

Share:
Storm name: Nadine (AL14)
Area: Atlantic Ocean
Start up location: N 16° 18.000, W 43° 6.000
Start up: 11th September 2012
Status: 22nd September 2012
Track long: 1,092.58 km
Top category.:
Report by: NOAA NHC
Useful links:

Past track
Date Time Position Speed
km/h
Wind
km/h
Gust
km/h
Category Course Wave Pressure Source
12th Sep 2012 05:01:17 N 17° 48.000, W 45° 12.000 24 65 83 Tropical Storm 300 13 1004 MB NOAA NHC
12th Sep 2012 10:46:22 N 18° 36.000, W 46° 36.000 28 74 93 Tropical Storm 300 15 1001 MB NOAA NHC
13th Sep 2012 05:34:52 N 20° 42.000, W 50° 6.000 26 111 139 Tropical Storm 305 17 990 MB NOAA NHC
13th Sep 2012 11:12:43 N 21° 30.000, W 51° 18.000 26 111 139 Tropical Storm 305 17 990 MB NOAA NHC
14th Sep 2012 05:11:31 N 25° 0.000, W 53° 42.000 24 111 139 Tropical Storm 330 17 989 MB NOAA NHC
15th Sep 2012 06:55:17 N 30° 0.000, W 52° 48.000 22 120 148 Hurricane I. 25 17 985 MB NOAA NHC
15th Sep 2012 10:59:20 N 30° 42.000, W 51° 24.000 24 120 148 Hurricane I. 50 13 985 MB NOAA NHC
16th Sep 2012 05:13:53 N 30° 36.000, W 46° 36.000 28 130 157 Hurricane I. 95 15 983 MB NOAA NHC
17th Sep 2012 05:22:55 N 31° 24.000, W 38° 6.000 30 111 139 Tropical Storm 75 16 987 MB NOAA NHC
17th Sep 2012 10:47:47 N 32° 0.000, W 36° 24.000 28 111 139 Tropical Storm 65 15 985 MB NOAA NHC
18th Sep 2012 05:15:16 N 33° 54.000, W 34° 12.000 15 93 111 Tropical Storm 45 18 989 MB NOAA NHC
18th Sep 2012 10:46:51 N 34° 18.000, W 33° 36.000 13 93 111 Tropical Storm 45 14 990 MB NOAA NHC
19th Sep 2012 05:31:59 N 35° 48.000, W 32° 12.000 11 83 102 Tropical Storm 25 15 993 MB NOAA NHC
19th Sep 2012 11:00:20 N 36° 24.000, W 32° 6.000 7 83 102 Tropical Storm 360 9 993 MB NOAA NHC
20th Sep 2012 05:12:41 N 37° 6.000, W 31° 24.000 6 83 102 Tropical Storm 60 9 990 MB NOAA NHC
20th Sep 2012 11:02:24 N 36° 48.000, W 30° 36.000 15 83 102 Tropical Storm 120 18 983 MB NOAA NHC
21st Sep 2012 10:40:35 N 35° 6.000, W 27° 12.000 13 102 120 Tropical Storm 140 14 981 MB NOAA NHC
22nd Sep 2012 06:38:52 N 31° 54.000, W 26° 36.000 20 93 111 Tropical Storm 165 15 984 MB NOAA NHC
27th Sep 2012 04:58:41 N 29° 30.000, W 31° 24.000 9 83 102 Tropical Storm 220 15 993 MB NOAA NHC
27th Sep 2012 12:03:57 N 28° 54.000, W 31° 30.000 9 93 111 Tropical Storm 220 10 992 MB NOAA NHC
Current position
Date Time Position Speed
km/h
Wind
km/h
Gust
km/h
Category Course Wave
feet
Pressure Source
27th Sep 2012 16:47:10 N 28° 42.000, W 32° 24.000 11 93 111 Tropical Depression 240 ° 16 993 MB NOAA NHC
Forecast track
Date Time Position Category Wind
km/h
Gust
km/h
Source
29th Sep 2012 00:00:00 N 30° 0.000, W 35° 48.000 Hurricane I 102 120 NOAA NHC
30th Sep 2012 00:00:00 N 33° 0.000, W 36° 48.000 Tropical Depression 93 111 NOAA NHC
01st Oct 2012 00:00:00 N 35° 30.000, W 37° 30.000 Tropical Depression 93 111 NOAA NHC
02nd Oct 2012 00:00:00 N 36° 0.000, W 37° 30.000 Tropical Depression 83 102 NOAA NHC
Jelewat (18W) Pacific Ocean 20.09.2012 28.09.2012 SuperTyphoon 15 ° 232 km/h 278 km/h 4.27 m JTWC Details

Tropical Storm data

Share:
Storm name: Jelewat (18W)
Area: Pacific Ocean
Start up location: N 13° 42.000, E 132° 18.000
Start up: 20th September 2012
Status: Active
Track long: 805.87 km
Top category.:
Report by: JTWC
Useful links:

Past track
Date Time Position Speed
km/h
Wind
km/h
Gust
km/h
Category Course Wave Pressure Source
22nd Sep 2012 06:41:44 N 11° 42.000, E 129° 54.000 6 93 120 Tropical Storm 200 9 JTWC
23rd Sep 2012 06:04:26 N 11° 48.000, E 128° 54.000 7 139 167 Typhoon I. 270 11 JTWC
24th Sep 2012 08:06:11 N 13° 36.000, E 128° 30.000 9 241 296 Typhoon IV. 350 10 JTWC
24th Sep 2012 10:43:47 N 14° 12.000, E 128° 12.000 13 232 278 Typhoon IV. 335 14 JTWC
25th Sep 2012 05:16:53 N 15° 42.000, E 127° 48.000 7 259 315 Super Typhoon 360 9 JTWC
25th Sep 2012 10:29:06 N 16° 24.000, E 127° 30.000 15 259 278 Super Typhoon 340 18 JTWC
26th Sep 2012 05:26:43 N 17° 18.000, E 126° 36.000 6 250 306 Typhoon IV. 305 17 JTWC
26th Sep 2012 10:56:11 N 18° 0.000, E 126° 6.000 15 250 306 Typhoon IV. 325 18 JTWC
27th Sep 2012 05:36:14 N 19° 42.000, E 124° 42.000 17 241 296 Typhoon IV. 310 19 JTWC
27th Sep 2012 10:57:01 N 20° 12.000, E 124° 24.000 15 250 306 Typhoon IV. 330 16 JTWC
Current position
Date Time Position Speed
km/h
Wind
km/h
Gust
km/h
Category Course Wave
feet
Pressure Source
28th Sep 2012 04:38:56 N 22° 24.000, E 124° 6.000 13 232 278 SuperTyphoon 15 ° 14 JTWC
Forecast track
Date Time Position Category Wind
km/h
Gust
km/h
Source
29th Sep 2012 12:00:00 N 27° 36.000, E 129° 0.000 Typhoon IV 176 213 JTWC
29th Sep 2012 00:00:00 N 25° 42.000, E 126° 48.000 Typhoon IV 204 250 JTWC
30th Sep 2012 12:00:00 N 32° 54.000, E 135° 18.000 Typhoon I 111 139 JTWC
01st Oct 2012 12:00:00 N 39° 6.000, E 144° 12.000 Tropical Depression 65 83 JTWC
Miriam (EP 13) Pacific Ocean – East 22.09.2012 27.09.2012 Tropical Depression 315 ° 65 km/h 83 km/h 4.57 m NOAA NHC Details

Tropical Storm data

Share:
Storm name: Miriam (EP 13)
Area: Pacific Ocean – East
Start up location: N 13° 42.000, W 107° 30.000
Start up: 22nd September 2012
Status: Active
Track long: 822.92 km
Top category.:
Report by: NOAA NHC
Useful links:

Past track
Date Time Position Speed
km/h
Wind
km/h
Gust
km/h
Category Course Wave Pressure Source
22nd Sep 2012 06:35:22 N 13° 42.000, W 107° 30.000 19 56 74 Tropical Depression 275 10 1005 MB NOAA NHC
23rd Sep 2012 06:07:18 N 14° 54.000, W 108° 30.000 13 74 93 Tropical Storm 300 15 1002 MB NOAA NHC
24th Sep 2012 08:09:13 N 16° 48.000, W 111° 18.000 19 148 185 Hurricane I. 305 15 979 MB NOAA NHC
25th Sep 2012 05:19:32 N 18° 30.000, W 113° 54.000 13 167 204 Hurricane II. 305 14 968 MB NOAA NHC
25th Sep 2012 10:37:14 N 18° 42.000, W 114° 18.000 9 167 204 Hurricane II. 310 10 968 MB NOAA NHC
26th Sep 2012 05:24:31 N 19° 6.000, W 115° 12.000 7 130 157 Hurricane I. 310 9 983 MB NOAA NHC
26th Sep 2012 10:58:11 N 19° 30.000, W 115° 30.000 9 111 139 Tropical Storm 320 15 990 MB NOAA NHC
27th Sep 2012 05:38:27 N 21° 30.000, W 115° 42.000 11 74 93 Tropical Storm 345 12 999 MB NOAA NHC
27th Sep 2012 12:04:18 N 21° 48.000, W 116° 0.000 9 74 93 Tropical Storm 330 15 999 MB NOAA NHC
Current position
Date Time Position Speed
km/h
Wind
km/h
Gust
km/h
Category Course Wave
feet
Pressure Source
27th Sep 2012 16:46:34 N 22° 12.000, W 116° 18.000 9 65 83 Tropical Depression 315 ° 15 1000 MB NOAA NHC
Forecast track
Date Time Position Category Wind
km/h
Gust
km/h
Source
29th Sep 2012 00:00:00 N 22° 54.000, W 117° 18.000 Tropical Depression 37 56 NOAA NHC
30th Sep 2012 00:00:00 N 22° 54.000, W 117° 36.000 Tropical Depression 37 56 NOAA NHC
01st Oct 2012 00:00:00 N 22° 30.000, W 118° 0.000 Tropical Depression 28 37 NOAA NHC
Ewiniar (19W) Pacific Ocean 24.09.2012 28.09.2012 Tropical Depression 55 ° 83 km/h 102 km/h 4.57 m JTWC Details

  Tropical Storm data

Share:
Storm name: Ewiniar (19W)
Area: Pacific Ocean
Start up location: N 18° 30.000, E 139° 0.000
Start up: 24th September 2012
Status: Active
Track long: 927.85 km
Top category.:
Report by: JTWC
Useful links:

Past track
Date Time Position Speed
km/h
Wind
km/h
Gust
km/h
Category Course Wave Pressure Source
24th Sep 2012 08:04:10 N 18° 30.000, E 139° 0.000 26 46 65 Tropical Depression 335 17 JTWC
24th Sep 2012 10:42:45 N 19° 36.000, E 138° 54.000 20 56 74 Tropical Depression 350 17 JTWC
25th Sep 2012 05:14:15 N 21° 48.000, E 138° 18.000 15 74 93 Tropical Storm 355 15 JTWC
25th Sep 2012 10:28:32 N 22° 48.000, E 138° 30.000 19 74 93 Tropical Storm 10 10 JTWC
26th Sep 2012 05:25:41 N 25° 24.000, E 141° 18.000 15 93 120 Tropical Storm 60 16 JTWC
26th Sep 2012 10:53:51 N 26° 24.000, E 142° 12.000 24 93 120 Tropical Storm 40 19 JTWC
27th Sep 2012 05:35:33 N 30° 18.000, E 142° 18.000 22 81 130 Tropical Storm 350 17 JTWC
27th Sep 2012 10:56:30 N 31° 18.000, E 142° 12.000 19 102 130 Tropical Storm 355 15 JTWC
Current position
Date Time Position Speed
km/h
Wind
km/h
Gust
km/h
Category Course Wave
feet
Pressure Source
28th Sep 2012 04:37:59 N 31° 36.000, E 142° 18.000 9 83 102 Tropical Depression 55 ° 15 JTWC
Forecast track
Date Time Position Category Wind
km/h
Gust
km/h
Source
29th Sep 2012 12:00:00 N 38° 48.000, E 150° 18.000 Tropical Depression 83 102 JTWC
29th Sep 2012 00:00:00 N 36° 0.000, E 146° 18.000 Typhoon I 93 120 JTWC
30th Sep 2012 12:00:00 N 43° 6.000, E 161° 36.000 Tropical Depression 74 93 JTWC

Taiwan issues warning against Typhoon Jelawat

by Staff Writers
Taipei (AFP)

Taiwan on Thursday issued a warning over a strong typhoon approaching the island which could bring torrential rains and trigger landslides, a month after another heavy storm left six dead.

Residents in the north and east of the island were asked to take precautions against Typhoon Jelawat which is gaining momentum and approaching the island, the Central Weather Bureau said in a statement.

As of 0900 GMT, Jelawat was 380 kilometres (236 miles) southeast of the island’s southern-most tip.

With a radius of 250 kilometres and packing winds of up to 191 kilometres an hour, the typhoon was moving north-northwest at 14 kilometres per hour.

Typhoon Saola pounded Taiwan with fierce winds and torrential rain in August that left six people dead and forced nearly the entire island to shut down.

Related Links
Bringing Order To A World Of Disasters
When the Earth Quakes
A world of storm and tempest

Storms deluge historic British city

by Staff Writers
London (AFP)

Britain’s most severe September storms for 30 years flooded homes and businesses in the historic city of York on Thursday and threatened chaos for much of northern England.

Residents took to boats to navigate the picturesque streets of the city dating from Roman times but officials said flood defences would cope as the River Ouse reached near record levels, three metres (10 feet) higher than normal.

City of York Council insisted the centre was “very much open for business” despite 80 properties being flooded while defences in the nearby village of Cawood were bolstered overnight by 4,000 sandbags.

“Loads of staff have been working through the night to protect the city,” said Sally Burns from the council, who said experts believed the river levels had peaked.

“We need to be careful and make sure we are giving (sandbags) to the people who are a priority, we can see on the monitors where the problems are.”

The Met Office issued more than 50 flood warnings — indicating flooding is expected — and 80 flood alerts – meaning flooding is possible — in England and Wales.

Further rain was forecast for Thursday, putting thousands of home in northern England at risk.

In Newburn, northeast England, a four-storey block of flats teetered on the brink of collapse after floodwaters destroyed its foundations.

Police arrested a man and a woman in connection with the looting of �20,000 ($32,300, 25,000 euros) worth of bicycles from a nearby shop.

Elsewhere, police were investigating the discovery of two bodies on the banks of the swollen River Clywedog in north Wales.

The body of a 27-year-old woman was found on Wednesday and the second body, believed to be male, was discovered on Thursday. Police believe they are linked.

An 11-year-old boy was fighting for his life after being struck by lightning in storms in Swindon, southwest England.

The storms have been caused by an unusually deep area of low pressure but conditions are expected to improve over the next 24 hours.

Related Links
Bringing Order To A World Of Disasters
When the Earth Quakes
A world of storm and tempest

……………………………….

Today Tornado Tonga [Island of Nuiatoputapu] Damage level Details

Tornado in Tonga on Friday, 28 September, 2012 at 10:05 (10:05 AM) UTC.

Description
A family that fled to Tonga’s main island Tongatapu after the devastating tsunami hit the northern island of Nuiatoputapu three years ago had its house destroyed by a tornado on Wednesday. The house in the village of Makaunga was wrecked but no one was hurt. Radio Tonga says the family is now living in tents provided by the Red Cross. The town officer, Siosifa Lamipeti, says the tornado also damaged five power poles affecting supply for about 24 hours. He says there was minor damage to four other houses.

************************************************************************************************************

Epidemic Hazards / Diseases

Today Epidemic Hazard Democratic Republic of the Congo Eastern Province, Mangala Damage level Details

Epidemic Hazard in Democratic Republic of the Congo on Friday, 28 September, 2012 at 02:25 (02:25 AM) UTC.

Description
Bas-Congo virus after the province where it was found just west of Kinshasa, the teeming capital of the Democratic Republic of Congo. The discovery was announced today in the journal PLoS Pathogens. So far only three people in the remote village of Mangala are known to have contracted Bas-Congo hemorrhagic fever, two of whom died. One was a health care worker who cared for the other two villagers, which means it can apparently be transmitted from person to person, although no one knows how easily. But the small number of known cases is actually one of the important things about this finding. It signifies that scientists may have found an emerging disease very soon after it made its jump from whatever species it came from into humans. We’ll come back to its most likely origins a little later. The reason for thinking Bas-Congo only recently began infecting humans is that researchers have run blood tests on people throughout the DRC and found no evidence of antibodies that would indicate any of them has been exposed to the new virus. “It doesn’t appear to be widespread throughout the Congo,” study co-author Charles Chiu of the University of California San Francisco told Shots. He says the team is planning to do more blood tests on people in the DRC and neighboring countries, such as Congo-Brazzaville right next to Bas-Congo province. “I would say we caught it fairly quickly,” said another study author, Joseph Fair, in a telephone interview from the other side of the DRC, where he’s helping to track down the origin of an ongoing outbreak of Ebola hemorrhagic fever that has so far afflicted 51 people and killed 20.

“This wasn’t HIV, where we’re 15 years into a pandemic before we actually find that we have a pandemic,” says Fair, who’s with a group called Metabiota that contracts with governments and health agencies to track disease outbreaks. The three known cases of Bas-Congo fever actually occurred three years ago. But tissue samples from the victims languished in a laboratory freezer in Kinshasa until an astute doctor called the cases to Fair’s attention. That time lag, along with the inability to keep some tissue samples from thawing out, has hampered the researchers’ ability to track the virus through other possible cases in Mangala village. There are some other striking things about the new virus. It doesn’t belong to any of the four families of previously known hemorrhagic viruses – Arenaviridae, Bunyaviridae, Filoviridae and Flaviviridae. These families harbor such notorious bugs as Ebola, Marburg, Lassa fever, Crimean-Congo hemorrhagic fever, dengue fever and Rift Valley Fever. Instead, Bas-Congo belongs to the Rhabdovirus family, which has never been known to include human hemorrhagic fever viruses, although it does contain one that affects fish. “That in itself is astonishing,” Chiu says, “but even within the rhabdovirus family, it’s very divergent.” That is, it doesn’t resemble any other rhabdovirus.

Biohazard name: Bas-Congo hemorrhagic fever
Biohazard level: 4/4 Hazardous
Biohazard desc.: Viruses and bacteria that cause severe to fatal disease in humans, and for which vaccines or other treatments are not available, such as Bolivian and Argentine hemorrhagic fevers, H5N1(bird flu), Dengue hemorrhagic fever, Marburg virus, Ebola virus, hantaviruses, Lassa fever, Crimean-Congo hemorrhagic fever, and other hemorrhagic or unidentified diseases. When dealing with biological hazards at this level the use of a Hazmat suit and a self-contained oxygen supply is mandatory. The entrance and exit of a Level Four biolab will contain multiple showers, a vacuum room, an ultraviolet light room, autonomous detection system, and other safety precautions designed to destroy all traces of the biohazard. Multiple airlocks are employed and are electronically secured to prevent both doors opening at the same time. All air and water service going to and coming from a Biosafety Level 4 (P4) lab will undergo similar decontamination procedures to eliminate the possibility of an accidental release.
Symptoms:
Status: confirmed

************************************************************************************************************

Climate Change

Global Grain Production at Record High Despite Extreme Climatic Events

by Staff Writers
Washington DC (SPX)


File image.

Global grain production is expected to reach a record high of 2.4 billion tons in 2012, an increase of 1 percent from 2011 levels, according to new research conducted by the Worldwatch Institute’s Nourishing the Planet project (www.worldwatch.org) for the Institute’s Vital Signs Online service.

According to the United Nations Food and Agriculture Organization (FAO), the production of grain for animal feed is growing the fastest – a 2.1 percent increase from 2011. Grain for direct human consumption grew 1.1 percent from 2011, write report authors Danielle Nierenberg and Katie Spoden.

In 2011, the amount of grain used for food totaled 571 million tons, with India consuming 89 million tons, China 87 million tons, and the United States 28 million tons, according to the International Grains Council.

The world relies heavily on wheat, maize (corn), and rice for daily sustenance: of the 50,000 edible plants in the world, these three grains account for two-thirds of global food energy intake. Grains provide the majority of calories in diets worldwide, ranging from a 23 percent share in the United States to 60 percent in Asia and 62 percent in North Africa.

Maize production in the United States – the largest producer – was expected to reach a record 345 million tons in 2012; however, drought in the Great Plains has altered this estimate severely. Maize yields for the 2012-13 growing season are now expected to decrease 13 percent from 2011 production, for a total production of 274.3 million tons.

The reliance on grain crops for food security is threatened by more-extreme climatic events, especially droughts and floods. According to the United Nations International Strategy for Disaster Risk Reduction, the World Food Programme, and Oxfam International, some 375 million people will be affected by climate change-related disasters by 2015.

By 2050, the FAO notes, 10-20 percent more people will be subject to hunger based on the changing climate’s effects on agriculture, and 24 million more children are expected to be malnourished – 21 percent more than if there were no climate change.

“The relationship between food security, grain production, and climate change is especially important in 2012,” said Nierenberg, a Worldwatch senior researcher and Nourishing the Planet project director.

“The recent drought affecting the United States and the rest of the world show the need to reduce price volatility, move away from fossil fuel-based agriculture, and recognize the importance of women farmers to increase resilience to climate change.”

The drought taking place in the Midwest and Great Plains of the United States is considered the country’s worst in 50 years, coming close to matching the late-1930s Dust Bowl.

The drought is expected to cost many billions of dollars and could top the list as one of the most expensive weather-related disasters in U.S. history. The global market will be most affected by this drought, as so much of the developing world relies on U.S. corn and soybean production.

Food prices have already begun to increase due to lower yields, and price fluctuations will inevitably affect food security around the globe.

Further highlights from the report:

+ The FAO expects global maize production to increase 4.1 percent from 2011, reaching an estimated 916 million tons in 2012.

+ Global rice production achieved an all-time high of 480 million tons in 2011, a 2.6 percent increase from 2010.

+ World wheat production is projected to drop to 675.1 million tons in 2012, down 3.6 percent from 2011, with the largest declines in feed and biofuel utilization.

+ Since 1961, grain production has increased 269 percent and grain yield has increased 157 percent, while the grain harvest area has increased only 25 percent.

+ This is due largely to the Green Revolution and the introduction of high-yielding grain varieties.

Related Links
Worldwatch Institute
Farming Today – Suppliers and Technology

Loss of species makes nature more sensitive to climate change

by Staff Writers
Gothenburg, Sweden (SPX)


File image.

High biodiversity acts as an insurance policy for nature and society alike as it increases the likelihood that at least some species will be sufficiently resilient to sustain important functions such as water purification and crop pollination in a changing environment.

“It’s the same principle as an investment portfolio – you’d be mad to put all your eggs in one basket,” says researcher Johan Eklof.

Experiments with eelgrass meadows in shallow inlets on the west coast of Sweden are now showing that climate change can exacerbate the negative effects of losing sensitive species, and that the insurance effect of biodiversity may be weaker than what we typically assume.

Eelgrass meadows in shallow inlets are important nursery habitats for cod, for example. Since the early 1980s the prevalence of eelgrass has fallen dramatically along the Bohuslan coast.

This is thought to be due partly to eutrophication, which favours mats of filamentous “nuisance” algae which shade and suffocate the eelgrass, and partly to the loss of cod, which has resulted in a huge increase in numbers of smaller predatory fish.

These predatory fish, in turn, reduce numbers of Grammarus locusta, herbivorous crustaceans which are effective grazers that normally control the filamentous algae.

This type of cascade effect has become increasingly common both onshore and off as many types of predator have been wiped out by hunting or fishing. Worryingly, theory and observations would indicate that these effects could magnify the effects of global warming, which favours heat-tolerant but grazing-sensitive plants such as filamentous algae.

At the Sven Loven Centre for Marine Sciences’ Kristineberg research station on Gullmarsfjorden, researchers from the University of Gothenburg’s Department of Biology and Environmental Sciences have developed miniature ecosystems in outdoor aquariums and have been investigating how future ocean warming and ocean acidification could affect the balance between eelgrass and filamentous algae.

The effects were unexpectedly clear and unambiguous: it was the diversity of algal herbivores that determined the extent to which the ecosystem was affected by warming and acidification.

“High diversity meant that neither warming nor acidification had any real effect as the algae were eaten before they managed to grow and shade the eelgrass,” says researcher and biologist Johan Eklof, who headed up the study.

“But when we simultaneously simulated the effects of fishing and removed the effective but vulnerable herbivor Grammarus locusta, the algae took over the ecosystem – especially in the warmer conditions.”

The researchers believe that we should be concerned about the results.

“Most management is based on the assumption that we afford to lose the most sensitive species because other, more resilient species will take their place,” says Johan Eklof. “But this may not be the case with future climate changes, as it can reduce the net efficiency of the resilient species – without directly affecting them.”

However, the researchers are also careful to point out that there is still hope if society does decide to take action.

“If we protect the local biodiversity we still have, and restore the diversity we’ve lost, by for example protecting predatory fish stocks in coastal areas and reducing nutrient loading, then we’ll probably be able to increase the ecosystems’ resilience to climate change.”

Related Links
University of Gothenburg
Climate Science News – Modeling, Mitigation Adaptation

************************************************************************************************************

Solar Activity

.

3MIN News Sept 27. 2012

Published on Sep 27, 2012 by

TODAY’S LINKS
Global Aftershocks: http://phys.org/news/2012-09-sumatra-earthquake-triggered-temblors-worldwide….
The Ripping Fault Lines: http://phys.org/news/2012-09-sumatra-quake-crustal-plate-breakup.html
[Old Article] Croatian Scientist says Earth Ripping Apart: http://www.croatiantimes.com/news/Around_the_World/2012-04-15/26423/Quake_Exp…
ISS Debris Threat: http://phys.org/news/2012-09-space-debris-threatens-iss.html
Russia Suspends Monsanto: http://phys.org/news/2012-09-russia-monsanto-corn-imports.html
100M Dead in 18 Years: http://www.weather.com/news/100-million-could-die-due-to-climate-20120926

REPEAT LINKS
Spaceweather: http://spaceweather.com/ [Look on the left at the X-ray Flux and Solar Wind Speed/Density]

HAARP: http://www.haarp.alaska.edu/haarp/data.html [Click online data, and have a little fun]

SDO: http://sdo.gsfc.nasa.gov/data/ [Place to find Solar Images and Videos – as seen from earth]

SOHO: http://sohodata.nascom.nasa.gov/cgi-bin/soho_movie_theater [SOHO; Lasco and EIT – as seen from earth]

Stereo: http://stereo.gsfc.nasa.gov/cgi-bin/images [Stereo; Cor, EUVI, HI – as seen from the side]

SunAEON:http://www.sunaeon.com/#/solarsystem/ [Just click it… trust me]

SOLARIMG: http://solarimg.org/artis/ [All purpose data viewing site]

iSWA: http://iswa.gsfc.nasa.gov/iswa/iSWA.html [Free Application; for advanced sun watchers]

NASA ENLIL SPIRAL: http://iswa.gsfc.nasa.gov:8080/IswaSystemWebApp/iSWACygnetStreamer?timestamp=…
NOAA ENLIL SPIRAL: http://www.swpc.noaa.gov/wsa-enlil/

US Wind Map: http://hint.fm/wind/

NOAA Bouys: http://www.ndbc.noaa.gov/

NOAA Environmental Visualization Laboratory: http://www.nnvl.noaa.gov/Default.php

RSOE: http://hisz.rsoe.hu/alertmap/index2.php [That cool alert map I use]

GOES Xray: http://www.swpc.noaa.gov/sxi/goes15/index.html

JAPAN Radiation Map: http://jciv.iidj.net/map/

LISS: http://earthquake.usgs.gov/monitoring/operations/heliplots_gsn.php

Gamma Ray Bursts: http://grb.sonoma.edu/ [Really? You can’t figure out what this one is for?]

BARTOL Cosmic Rays: http://neutronm.bartol.udel.edu//spaceweather/welcome.html [Top left box, look for BIG blue circles]

TORCON: http://www.weather.com/news/tornado-torcon-index [Tornado Forecast for the day]

GOES Weather: http://rsd.gsfc.nasa.gov/goes/ [Clouds over America]

RAIN RECORDS: http://www.cocorahs.org/ViewData/ListIntensePrecipReports.aspx

EL DORADO WORLD WEATHER MAP: http://www.eldoradocountyweather.com/satellite/ssec/world/world-composite-ir-…

PRESSURE MAP: http://www.woweather.com/cgi-bin/expertcharts?LANG=us&MENU=0000000000&…

HURRICANE TRACKER: http://www.weather.com/weather/hurricanecentral/tracker

INTELLICAST: http://www.intellicast.com/ [Weather site used by many youtubers]

NASA News: http://science.nasa.gov/science-news/science-at-nasa/

PHYSORG: http://phys.org/ [GREAT News Site!]

QUAKES LIST FULL: http://www.emsc-csem.org/Earthquake/seismologist.php

************************************************************************************************************

Space

  Earth approaching objects (objects that are known in the next 30 days)

Object Name Apporach Date Left AU Distance LD Distance Estimated Diameter* Relative Velocity
(2012 SY49) 28th September 2012 0 day(s) 0.0067 2.6 19 m – 42 m 15.84 km/s 57024 km/h
(2012 SJ32) 28th September 2012 0 day(s) 0.0297 11.6 26 m – 59 m 8.11 km/s 29196 km/h
(2012 SM50) 30th September 2012 2 day(s) 0.1074 41.8 36 m – 81 m 8.68 km/s 31248 km/h
(2012 RH10) 03rd October 2012 5 day(s) 0.1260 49.0 98 m – 220 m 12.90 km/s 46440 km/h
(2012 QE50) 09th October 2012 11 day(s) 0.0809 31.5 450 m – 1.0 km 11.47 km/s 41292 km/h
(1994 EK) 14th October 2012 16 day(s) 0.1356 52.8 230 m – 520 m 12.22 km/s 43992 km/h
(2012 PA20) 15th October 2012 17 day(s) 0.1502 58.5 100 m – 230 m 10.36 km/s 37296 km/h
(2012 RV16) 18th October 2012 20 day(s) 0.1270 49.4 310 m – 700 m 16.14 km/s 58104 km/h
1 AU = ~150 million kilometers,1 LD = Lunar Distance = ~384,000 kilometers Source: NASA-NEO


*************************************************************************************************************

Biological Hazards / Wildlife / Hazmat

HAZMAT in USA on Thursday, 27 September, 2012 at 18:30 (06:30 PM) UTC.

Description
Nine people were taken to the hospital following a chemical spill at West Knox Co. Veteran’s Home. All of the victims were suffering from respiratory problems, one of them was being treated as an emergency. Authorities called it a concentrated chlorine spill. They said it happened shortly after 9:30 a.m. at Ben Atchley State Veterans’ Home in Karns. The home was evacuated and the scene is being treated as a hazmat situation.


*************************************************************************************************************

[In accordance with Title 17 U.S.C. Section 107, this material is distributed without profit, for research and/or educational purposes. This constitutes ‘FAIR USE’ of any such copyrighted material.]

Earthquakes

USGS

MAG UTC DATE-TIME
y/m/d h:m:s
LAT
deg
LON
deg
DEPTH
km
 Region
MAP  3.1 2012/09/21 23:07:02   19.037   -64.288 42.0  VIRGIN ISLANDS REGION
MAP  4.2 2012/09/21 22:59:26   36.262   70.287 113.1  HINDU KUSH REGION, AFGHANISTAN
MAP  3.2 2012/09/21 20:44:55   18.706   -68.224 27.0  DOMINICAN REPUBLIC REGION
MAP  4.6   2012/09/21 19:36:51   36.785   142.333 24.7  OFF THE EAST COAST OF HONSHU, JAPAN
MAP  3.1 2012/09/21 17:24:05   19.457   -64.165 72.0  VIRGIN ISLANDS REGION
MAP  4.6   2012/09/21 17:19:04   36.526   71.273 90.2  HINDU KUSH REGION, AFGHANISTAN
MAP  2.6 2012/09/21 15:56:48   56.983  -154.121 19.3  KODIAK ISLAND REGION, ALASKA
MAP  4.6   2012/09/21 15:39:16   35.520   22.734 46.1  CENTRAL MEDITERRANEAN SEA
MAP  3.2 2012/09/21 12:22:29   19.739   -64.121 30.0  VIRGIN ISLANDS REGION
MAP  5.4   2012/09/21 12:17:26  -19.654   -69.149 98.8  TARAPACA, CHILE
MAP  4.9   2012/09/21 11:59:38   -8.979   157.978 35.1  SOLOMON ISLANDS
MAP  4.3 2012/09/21 11:12:05   12.167   -88.743 35.2  OFF THE COAST OF EL SALVADOR
MAP  2.8 2012/09/21 10:39:00   17.974   -67.086 6.0  PUERTO RICO
MAP  4.5   2012/09/21 10:09:26   40.459   77.421 29.6  SOUTHERN XINJIANG, CHINA
MAP  4.4 2012/09/21 09:22:26  -32.965   -69.678 100.9  MENDOZA, ARGENTINA
MAP  5.0   2012/09/21 08:47:40   35.300   22.679 15.1  CENTRAL MEDITERRANEAN SEA
MAP  3.3 2012/09/21 08:28:29   19.648   -64.203 60.0  VIRGIN ISLANDS REGION
MAP  3.4 2012/09/21 08:11:28   19.499   -64.109 75.0  VIRGIN ISLANDS REGION
MAP  4.1 2012/09/21 06:37:01   10.225   -85.594 25.7  COSTA RICA
MAP  3.0 2012/09/21 05:08:30   57.197  -157.848 2.7  ALASKA PENINSULA
MAP  4.8   2012/09/21 05:01:57   9.939   126.099 35.3  MINDANAO, PHILIPPINES
MAP  3.1 2012/09/21 04:53:33   54.716  -154.315 12.4  SOUTH OF ALASKA
MAP  2.7 2012/09/21 04:36:16   63.037  -148.469 76.5  CENTRAL ALASKA
MAP  4.6   2012/09/21 03:28:36   32.099   58.499 25.9  EASTERN IRAN
MAP  4.7   2012/09/21 03:25:50  -25.646   178.468 572.0  SOUTH OF THE FIJI ISLANDS
MAP  2.8 2012/09/21 03:16:45   61.735  -149.718 37.0  SOUTHERN ALASKA
MAP  3.2 2012/09/21 02:18:45   19.292   -66.159 73.0  PUERTO RICO REGION
MAP  4.5   2012/09/21 02:14:50  -10.836   113.985 8.8  SOUTH OF JAVA, INDONESIA
MAP  4.3 2012/09/21 00:30:44   -8.364   121.227 31.5  FLORES REGION, INDONESIA
MAP  4.3 2012/09/21 00:03:54   35.248   135.388 370.4  WESTERN HONSHU, JAPAN

MAG UTC DATE-TIME
y/m/d h:m:s
LAT
deg
LON
deg
DEPTH
km
 Region
MAP  2.6 2012/09/20 22:42:33   51.949  -177.631 9.8  ANDREANOF ISLANDS, ALEUTIAN IS., ALASKA
MAP  2.8 2012/09/20 22:17:41   51.121   179.245 23.6  RAT ISLANDS, ALEUTIAN ISLANDS, ALASKA
MAP  5.4   2012/09/20 21:21:06   5.978   126.383 111.2  MINDANAO, PHILIPPINES
MAP  5.7   2012/09/20 21:03:40  -20.753  -178.373 544.2  FIJI REGION
MAP  3.8 2012/09/20 20:47:36   62.692  -149.807 10.1  CENTRAL ALASKA
MAP  3.4 2012/09/20 20:01:18   52.472  -170.057 127.2  FOX ISLANDS, ALEUTIAN ISLANDS, ALASKA
MAP  4.9   2012/09/20 17:44:51   -5.735   149.821 120.5  NEW BRITAIN REGION, PAPUA NEW GUINEA
MAP  2.9 2012/09/20 17:21:58   19.006   -64.557 65.0  VIRGIN ISLANDS REGION
MAP  3.4 2012/09/20 17:15:06   19.633   -64.434 17.0  VIRGIN ISLANDS REGION
MAP  4.3 2012/09/20 16:58:43   17.569   -94.854 114.1  VERACRUZ, MEXICO
MAP  4.9   2012/09/20 16:32:43   10.657   126.978 35.0  PHILIPPINE ISLANDS REGION
MAP  5.0   2012/09/20 15:52:34   2.178   126.830 83.3  MOLUCCA SEA
MAP  4.7   2012/09/20 12:42:40   10.332   126.205 46.6  PHILIPPINE ISLANDS REGION
MAP  2.5 2012/09/20 12:13:12   33.452  -116.441 2.3  SOUTHERN CALIFORNIA
MAP  2.5 2012/09/20 11:42:15   18.557   -64.535 1.0  VIRGIN ISLANDS REGION
MAP  4.7   2012/09/20 10:07:06  -34.271   -72.226 17.5  OFFSHORE LIBERTADOR O’HIGGINS, CHILE
MAP  4.1 2012/09/20 09:29:52   13.981   -91.017 71.3  GUATEMALA
MAP  3.3 2012/09/20 08:44:31   19.271   -64.047 94.0  VIRGIN ISLANDS REGION
MAP  2.6 2012/09/20 08:40:16   40.378  -125.146 0.0  OFFSHORE NORTHERN CALIFORNIA
MAP  2.5 2012/09/20 07:57:51   56.912  -154.004 46.1  KODIAK ISLAND REGION, ALASKA
MAP  3.4 2012/09/20 07:31:29   56.909  -154.095 43.4  KODIAK ISLAND REGION, ALASKA
MAP  3.4 2012/09/20 07:15:03   19.427   -64.198 87.0  VIRGIN ISLANDS REGION
MAP  4.8   2012/09/20 06:23:43   52.586   -32.043 9.8  REYKJANES RIDGE
MAP  4.9   2012/09/20 06:08:05  -13.927   -72.699 66.5  CENTRAL PERU
MAP  5.2   2012/09/20 05:40:20  -20.537  -176.155 209.6  FIJI REGION
MAP  3.0 2012/09/20 05:39:35   19.701   -64.203 25.0  VIRGIN ISLANDS REGION
MAP  2.7 2012/09/20 05:37:39   17.854   -65.536 16.0  PUERTO RICO REGION
MAP  4.7   2012/09/20 03:32:41  -20.259   167.190 31.9  LOYALTY ISLANDS
MAP  2.5 2012/09/20 01:52:20   35.301  -117.094 20.1  SOUTHERN CALIFORNIA
MAP  4.3 2012/09/20 01:51:15   13.296   -89.807 77.4  OFFSHORE EL SALVADOR
MAP  4.5   2012/09/20 00:20:33   0.069   92.070 10.2  OFF THE WEST COAST OF NORTHERN SUMATRA

LISS – Live Internet Seismic Server

GSN Stations

These data update automatically every 30 minutes. Last update: September 22, 2012 08:18:43 UTC

Seismograms may take several moments to load. Click on a plot to see larger image.

CU/ANWB, Willy Bob, Antigua and Barbuda

 ANWB 24hr plot

CU/BBGH, Gun Hill, Barbados

 BBGH 24hr plot

CU/BCIP, Isla Barro Colorado, Panama

 BCIP 24hr plot

CU/GRGR, Grenville, Grenada

 GRGR 24hr plot

CU/GRTK, Grand Turk, Turks and Caicos Islands

 GRTK 24hr plot

CU/GTBY, Guantanamo Bay, Cuba

 GTBY 24hr plot

CU/MTDJ, Mount Denham, Jamaica

 MTDJ 24hr plot

CU/SDDR, Presa de Sabaneta, Dominican Republic

 SDDR 24hr plot

CU/TGUH, Tegucigalpa, Honduras

 TGUH 24hr plot

IC/BJT, Baijiatuan, Beijing, China

 BJT 24hr plot

IC/ENH, Enshi, China

 ENH 24hr plot

IC/HIA, Hailar, Neimenggu Province, China

 HIA 24hr plot

IC/LSA, Lhasa, China

 LSA 24hr plot

IC/MDJ, Mudanjiang, China

 MDJ 24hr plot

IC/QIZ, Qiongzhong, Guangduong Province, China

 QIZ 24hr plot

IU/ADK, Aleutian Islands, Alaska, USA

 ADK 24hr plot

IU/AFI, Afiamalu, Samoa

 AFI 24hr plot

IU/ANMO, Albuquerque, New Mexico, USA

 ANMO 24hr plot

IU/ANTO, Ankara, Turkey

 ANTO 24hr plot

IU/BBSR, Bermuda

 BBSR 24hr plot

IU/BILL, Bilibino, Russia

 BILL 24hr plot

IU/CASY, Casey, Antarctica

 CASY 24hr plot

IU/CCM, Cathedral Cave, Missouri, USA

 CCM 24hr plot

IU/CHTO, Chiang Mai, Thailand

 CHTO 24hr plot

IU/COLA, College Outpost, Alaska, USA

 COLA 24hr plot

IU/COR, Corvallis, Oregon, USA

 COR 24hr plot

IU/CTAO, Charters Towers, Australia

 CTAO 24hr plot

IU/DAV,Davao, Philippines

 DAV 24hr plot

IU/DWPF,Disney Wilderness Preserve, Florida, USA

 DWPF 24hr plot

IU/FUNA,Funafuti, Tuvalu

 FUNA 24hr plot

IU/FURI, Mt. Furi, Ethiopia

 FURI 24hr plot

IU/GNI, Garni, Armenia

 GNI 24hr plot

IU/GRFO, Grafenberg, Germany

 GRFO 24hr plot

IU/GUMO, Guam, Mariana Islands

 GUMO 24hr plot

IU/HKT, Hockley, Texas, USA

 HKT 24hr plot

IU/HNR, Honiara, Solomon Islands

 HNR 24hr plot

IU/HRV, Adam Dziewonski Observatory (Oak Ridge), Massachusetts, USA

 HRV 24hr plot

IU/INCN, Inchon, Republic of Korea

 INCN 24hr plot

IU/JOHN, Johnston Island, Pacific Ocean

 JOHN 24hr plot

IU/KBS, Ny-Alesund, Spitzbergen, Norway

 KBS 24hr plot

IU/KEV, Kevo, Finland

 KEV 24hr plot

IU/KIEV, Kiev, Ukraine

 KIEV 24hr plot

IU/KIP, Kipapa, Hawaii, USA

 KIP 24hr plot

IU/KMBO, Kilima Mbogo, Kenya

 KMBO 24hr plot

IU/KNTN, Kanton Island, Kiribati

 KNTN 24hr plot

IU/KONO, Kongsberg, Norway

 KONO 24hr plot

IU/KOWA, Kowa, Mali

 KOWA 24hr plot

IU/LCO, Las Campanas Astronomical Observatory, Chile

 LCO 24hr plot

IU/LSZ, Lusaka, Zambia

 LSZ 24hr plot

IU/LVC, Limon Verde, Chile

 LVC 24hr plot

IU/MA2, Magadan, Russia

 MA2 24hr plot

IU/MAJO, Matsushiro, Japan

 MAJO 24hr plot

IU/MAKZ,Makanchi, Kazakhstan

 MAKZ 24hr plot

IU/MBWA, Marble Bar, Western Australia

 MBWA 24hr plot

IU/MIDW, Midway Island, Pacific Ocean, USA

 MIDW 24hr plot

IU/MSKU, Masuku, Gabon

 MSKU 24hr plot

IU/NWAO, Narrogin, Australia

 NWAO 24hr plot

IU/OTAV, Otavalo, Equador

 OTAV 24hr plot

IU/PAB, San Pablo, Spain

 PAB 24hr plot

IU/PAYG Puerto Ayora, Galapagos Islands

 PAYG 24hr plot

IU/PET, Petropavlovsk, Russia

 PET 24hr plot

IU/PMG, Port Moresby, Papua New Guinea

 PMG 24hr plot

IU/PMSA, Palmer Station, Antarctica

 PMSA 24hr plot

IU/POHA, Pohakaloa, Hawaii

 POHA 24hr plot

IU/PTCN, Pitcairn Island, South Pacific

 PTCN 24hr plot

IU/PTGA, Pitinga, Brazil

 PTGA 24hr plot

IU/QSPA, South Pole, Antarctica

 QSPA 24hr plot

IU/RAO, Raoul, Kermandec Islands

 RAO 24hr plot

IU/RAR, Rarotonga, Cook Islands

 RAR 24hr plot

IU/RCBR, Riachuelo, Brazil

 RCBR 24hr plot

IU/RSSD, Black Hills, South Dakota, USA

 RSSD 24hr plot

IU/SAML, Samuel, Brazil

 SAML 24hr plot

IU/SBA, Scott Base, Antarctica

 SBA 24hr plot

IU/SDV, Santo Domingo, Venezuela

 SDV 24hr plot

IU/SFJD, Sondre Stromfjord, Greenland

 SFJD 24hr plot

IU/SJG, San Juan, Puerto Rico

 SJG 24hr plot

IU/SLBS, Sierra la Laguna Baja California Sur, Mexico

 SLBS 24hr plot

IU/SNZO, South Karori, New Zealand

 SNZO 24hr plot

IU/SSPA, Standing Stone, Pennsylvania USA

 SSPA 24hr plot

IU/TARA, Tarawa Island, Republic of Kiribati

 TARA 24hr plot

IU/TATO, Taipei, Taiwan

 TATO 24hr plot

IU/TEIG, Tepich, Yucatan, Mexico

 TEIG 24hr plot

IU/TIXI, Tiksi, Russia

 TIXI 24hr plot

IU/TRIS, Tristan da Cunha, Atlantic Ocean

 TRIS 24hr plot

IU/TRQA, Tornquist, Argentina

 TRQA 24hr plot

IU/TSUM, Tsumeb, Namibia

 TSUM 24hr plot

IU/TUC, Tucson, Arizona

 TUC 24hr plot

IU/ULN, Ulaanbaatar, Mongolia

 ULN 24hr plot

IU/WAKE, Wake Island, Pacific Ocean

 WAKE 24hr plot

IU/WCI, Wyandotte Cave, Indiana, USA

 WCI 24hr plot

IU/WVT, Waverly, Tennessee, USA

 WVT 24hr plot

IU/XMAS, Kiritimati Island, Republic of Kiribati

 XMAS 24hr plot

IU/YAK, Yakutsk, Russia

 YAK 24hr plot

IU/YSS, Yuzhno Sakhalinsk, Russia

 YSS 24hr plot

**********************************************************************************************************

Volcanic Activity

China’s Changbaishan volcano showing signs of increased activity

Roughly 1,100 years ago, the Changbaishan volcano that lies along the border between northeastern China and North Korea erupted, sending pyroclastic flows dozens of kilometers and blasting a 5-kilometer (3-mile) wide chunk off of the tip of the stratovolcano.

The eruption, known as the Millennium eruption because of its proximity to the turn of the first millennium, was one of the largest volcanic events in the Common Era. In the subsequent period, there have been three smaller eruptions, the most recent of which took place in 1903. Starting in 1999, spurred by signs of resumed activity, scientists established the Changbaishan Volcano Observatory, a network to track changing gas compositions, seismic activity, and ground deformation. Reporting on the data collected over the past 12 years, Xu et al. find that these volcanic indices each leapt during a period of heightened activity from 2002 to 2006. The authors find that during this brief active period, earthquake occurrences increased dramatically. From 1999 to 2002, and from 2006 to 2011, they registered 7 earthquakes per month using 11 seismometers. From 2002 to 2006, this rate increased to 72 earthquakes per month, peaking in November 2003 with 243 events. Further, tracking the source of the earthquakes, the authors tie the bulk of the events to a region located 5 kilometers (3 miles) beneath the volcanic caldera, a source that slowly crept upward throughout the study period, suggestive of an ongoing magmatic intrusion. Gas composition measurements collected from hot springs near the volcano showed spikes in carbon dioxide, hydrogen, helium, and nitrogen gases, which the authors suggest could be related to magmatic outgassing. Ground deformation studies, too, show a brief period of rapid expansion. The authors suggest that though Changbaishan is likely not gearing up for an imminent eruption, one could be expected in the next couple of decades. More information: Recent unrest of Changbaishan volcano, northeast China: A precursor of a future eruption? Geophysical Research Letters, doi:10.1029/2012GL052600 , 2012

21.09.2012 Volcano Eruption Indonesia Sulawesi, [Mount Lokon] Damage level Details

Volcano Eruption in Indonesia on Friday, 21 September, 2012 at 18:56 (06:56 PM) UTC.

Description
A volcano in northern Indonesia has spewed hot smoke and ash thousands of metres into the air in two new eruptions. Mount Lokon on Sulawesi island had been dormant before rumbling back to life last year. Government volcanologist Hendrasto says it unleashed two strong eruptions on Friday. Residents have been put on alert, but no evacuations are planned since the nearest villages are beyond the danger area about 2.5 kilometres from the crater. Mount Lokon’s last major eruption in 1991 killed a Swiss hiker and forced thousands to flee. The volcano is one of five on high alert in Indonesia. The archipelago straddles the “Pacific Ring of Fire” and has more active volcanoes than any other nation.

***********************************************************************************************************

Extreme Temperatures/ Weather

21.09.2012 Extreme Weather USA State of New York, [New York City region] Damage level Details

Extreme Weather in USA on Friday, 21 September, 2012 at 18:51 (06:51 PM) UTC.

Description
Heavy rains and wind gusts knocked down trees and flooded roads in Long Island and Westchester County, leaving thousands without power. The band of storms on Tuesday prompted the National Weather Service to issue a tornado warning for southwestern Suffolk County. The warning was in effect until 10 p.m. A tornado watch expired at 11 p.m. for Suffolk and Nassau counties.


Global Sea Surface Temperature – Wunderground.com


***********************************************************************************************************

Storms /  Flooding

 Active tropical storm system(s)
Name of storm system Location Formed Last update Last category Course Wind Speed Gust Wave Source Details
Nadine (AL14) Atlantic Ocean 11.09.2012 22.09.2012 Tropical Depression 165 ° 93 km/h 111 km/h 4.57 m NOAA NHC Details

Tropical Storm data

Share:
Storm name: Nadine (AL14)
Area: Atlantic Ocean
Start up location: N 16° 18.000, W 43° 6.000
Start up: 11th September 2012
Status: Active
Track long: 1,489.96 km
Top category.:
Report by: NOAA NHC
Useful links:

Past track
Date Time Position Speed
km/h
Wind
km/h
Gust
km/h
Category Course Wave Pressure Source
12th Sep 2012 05:01:17 N 17° 48.000, W 45° 12.000 24 65 83 Tropical Storm 300 13 1004 MB NOAA NHC
12th Sep 2012 10:46:22 N 18° 36.000, W 46° 36.000 28 74 93 Tropical Storm 300 15 1001 MB NOAA NHC
13th Sep 2012 05:34:52 N 20° 42.000, W 50° 6.000 26 111 139 Tropical Storm 305 17 990 MB NOAA NHC
13th Sep 2012 11:12:43 N 21° 30.000, W 51° 18.000 26 111 139 Tropical Storm 305 17 990 MB NOAA NHC
14th Sep 2012 05:11:31 N 25° 0.000, W 53° 42.000 24 111 139 Tropical Storm 330 17 989 MB NOAA NHC
15th Sep 2012 06:55:17 N 30° 0.000, W 52° 48.000 22 120 148 Hurricane I. 25 17 985 MB NOAA NHC
15th Sep 2012 10:59:20 N 30° 42.000, W 51° 24.000 24 120 148 Hurricane I. 50 13 985 MB NOAA NHC
16th Sep 2012 05:13:53 N 30° 36.000, W 46° 36.000 28 130 157 Hurricane I. 95 15 983 MB NOAA NHC
17th Sep 2012 05:22:55 N 31° 24.000, W 38° 6.000 30 111 139 Tropical Storm 75 16 987 MB NOAA NHC
17th Sep 2012 10:47:47 N 32° 0.000, W 36° 24.000 28 111 139 Tropical Storm 65 15 985 MB NOAA NHC
18th Sep 2012 05:15:16 N 33° 54.000, W 34° 12.000 15 93 111 Tropical Storm 45 18 989 MB NOAA NHC
18th Sep 2012 10:46:51 N 34° 18.000, W 33° 36.000 13 93 111 Tropical Storm 45 14 990 MB NOAA NHC
19th Sep 2012 05:31:59 N 35° 48.000, W 32° 12.000 11 83 102 Tropical Storm 25 15 993 MB NOAA NHC
19th Sep 2012 11:00:20 N 36° 24.000, W 32° 6.000 7 83 102 Tropical Storm 360 9 993 MB NOAA NHC
20th Sep 2012 05:12:41 N 37° 6.000, W 31° 24.000 6 83 102 Tropical Storm 60 9 990 MB NOAA NHC
20th Sep 2012 11:02:24 N 36° 48.000, W 30° 36.000 15 83 102 Tropical Storm 120 18 983 MB NOAA NHC
21st Sep 2012 10:40:35 N 35° 6.000, W 27° 12.000 13 102 120 Tropical Storm 140 14 981 MB NOAA NHC
Current position
Date Time Position Speed
km/h
Wind
km/h
Gust
km/h
Category Course Wave
feet
Pressure Source
22nd Sep 2012 06:38:52 N 31° 54.000, W 26° 36.000 20 93 111 Tropical Depression 165 ° 15 984 MB NOAA NHC
Forecast track
Date Time Position Category Wind
km/h
Gust
km/h
Source
23rd Sep 2012 12:00:00 N 30° 42.000, W 24° 30.000 Tropical Depression 83 102 NOAA NHC
23rd Sep 2012 00:00:00 N 30° 30.000, W 25° 12.000 Tropical Depression 83 102 NOAA NHC
24th Sep 2012 00:00:00 N 31° 24.000, W 24° 30.000 Tropical Depression 83 102 NOAA NHC
25th Sep 2012 00:00:00 N 32° 30.000, W 24° 30.000 Tropical Depression 93 111 NOAA NHC
26th Sep 2012 00:00:00 N 32° 30.000, W 23° 0.000 Hurricane I 102 120 NOAA NHC
27th Sep 2012 00:00:00 N 33° 0.000, W 20° 0.000 Tropical Depression 93 111 NOAA NHC
Jelewat (18W) Pacific Ocean 20.09.2012 22.09.2012 Typhoon I 200 ° 93 km/h 120 km/h 2.74 m JTWC Details

Tropical Storm data

Share:
Storm name: Jelewat (18W)
Area: Pacific Ocean
Start up location: N 13° 42.000, E 132° 18.000
Start up: 20th September 2012
Status: Active
Track long: 212.69 km
Top category.:
Report by: JTWC
Useful links:

Past track
Date Time Position Speed
km/h
Wind
km/h
Gust
km/h
Category Course Wave Pressure Source
Current position
Date Time Position Speed
km/h
Wind
km/h
Gust
km/h
Category Course Wave
feet
Pressure Source
22nd Sep 2012 06:41:44 N 11° 42.000, E 129° 54.000 6 93 120 Typhoon I 200 ° 9 JTWC
Forecast track
Date Time Position Category Wind
km/h
Gust
km/h
Source
23rd Sep 2012 12:00:00 N 12° 6.000, E 128° 48.000 Typhoon II 130 157 JTWC
24th Sep 2012 12:00:00 N 12° 30.000, E 128° 18.000 Typhoon III 148 185 JTWC
25th Sep 2012 12:00:00 N 13° 18.000, E 127° 54.000 Typhoon IV 176 213 JTWC
EP 13 Pacific Ocean – East 22.09.2012 22.09.2012 Tropical Depression 275 ° 56 km/h 74 km/h 3.05 m NOAA NHC Details

Tropical Storm data

Share:
Storm name: EP 13
Area: Pacific Ocean – East
Start up location: N 13° 42.000, W 107° 30.000
Start up: 22nd September 2012
Status: Active
Track long: 0.00 km
Top category.:
Report by: NOAA NHC
Useful links:

Past track
Date Time Position Speed
km/h
Wind
km/h
Gust
km/h
Category Course Wave Pressure Source
Current position
Date Time Position Speed
km/h
Wind
km/h
Gust
km/h
Category Course Wave
feet
Pressure Source
22nd Sep 2012 06:35:22 N 13° 42.000, W 107° 30.000 19 56 74 Tropical Depression 275 ° 10 1005 MB NOAA NHC
Forecast track
Date Time Position Category Wind
km/h
Gust
km/h
Source
23rd Sep 2012 00:00:00 N 14° 18.000, W 110° 24.000 Tropical Depression 83 102 NOAA NHC
23rd Sep 2012 12:00:00 N 14° 54.000, W 111° 48.000 Hurricane I 102 120 NOAA NHC
24th Sep 2012 00:00:00 N 15° 42.000, W 113° 6.000 Hurricane I 111 139 NOAA NHC
25th Sep 2012 00:00:00 N 17° 30.000, W 116° 0.000 Hurricane II 139 167 NOAA NHC
26th Sep 2012 00:00:00 N 18° 30.000, W 118° 0.000 Hurricane II 130 157 NOAA NHC
27th Sep 2012 00:00:00 N 19° 30.000, W 120° 0.000 Hurricane I 120 148 NOAA NHC

………………………..

Today Flash Flood India State of Assam, [13 districts] Damage level Details

Flash Flood in India on Saturday, 22 September, 2012 at 05:11 (05:11 AM) UTC.

Description
Army and the National Disaster Response Force (NDRF) rescue teams were deployed in upper Assam’s Tinsukia and Dhemaji districts on Friday to rescue thousands of people marooned by flood waters as the overall flood situation turned critical in the State following incessant rain for past more than a week. A swollen Brahmaputra has submerged vast areas of Majuli following a breach in an embankment at Sonowal Kachari village of the island on Thursday. The administration cautioned the residents of the river-island to stay alert. Principal Secretary, Revenue and Disaster Management, V.K. Pipersenia, told The Hindu that six columns of the Army have been deployed for rescuing marooned people at Sadiya in Tinsukia district and in Jonai sub-division. Four NDRF teams were deployed for rescue operations. Army and NDRF boats tried to negotiate the strong current of flood waters in Sadiya. As strong current prevented them from reaching out to the marooned people in Sadiya from Tinsukia side, the rescue teams approached the flood-hit areas from Arunachal Pradesh side and rescued some people. Mr. Pipersenia said the services of Indian Air Force (IAF) were requisitioned but the IAF choppers could not carry out any operation during the day because of bad weather. Over five lakh people in 13 districts have been affected in the current and fourth wave of floods in the State. In addition to the breach in the embankment in Majuli, the Brahmaputra has breached an embankment at Dolopa in Sivasagar district and a ring bund at Chawalkhowa near Bogibeel in Dibrugarh district, while river Nona breached an embankment in Kamrup district. Flood situation was also critical in lower Assam’s Kamrup, Baksa and Barpeta districts.
22.09.2012 Flood USA State of Alaska, [Southcentral Alaska] Damage level Details

Flood in USA on Friday, 21 September, 2012 at 03:14 (03:14 AM) UTC.

Description
Flooding continues to cause problems throughout Southcentral Alaska. Jeremy Zidek, spokesman for the state Division of Homeland Security and Emergency Management, says in a release that there have been reports of flooding, landslides and road closures throughout the area. But there has been no report of major injuries. Residents in East Talkeetna are being told to evacuate because of flooding. The Red Cross has established three shelters in the Matanuska-Susitna Borough and helped with another in Seward. Weather problems are not confined to Southcentral Alaska. Zidek says a landslide has blocked access from the village of Chenega to its airport, and state transportation officials are working to restore access. And an assessment team is in Tanacross to evaluate damage from Sunday’s wind storm.

Flood in USA on Friday, 21 September, 2012 at 03:14 (03:14 AM) UTC.

Back

Updated: Saturday, 22 September, 2012 at 04:46 UTC
Description
Residents of Talkeetna are being asked to evacuate the town after its dike system against heavy flooding failed Friday, according to local firefighters. The evacuation is now voluntary, although an initial order was mandatory. Talkeetna Fire Department Battalion Chief Johnny Murdoch, the incident commander for flooding in the area, says the Susitna River started backing up to the Talkeetna River, causing the dike to fail. According to local officials the decision to evacuate Talkeetna was made by Alaska State Troopers, with authorities expecting water to continue rising Friday afternoon. The Associated Press reports that overnight rains in Talkeetna ranged from half an inch to 1 1/2 inches over a 6- to 8-hour period. The Talkeetna River was within a foot of its record stage of 17.4 feet, with officials telling the AP about 35 percent of Talkeetna has some form of water coverage. Students from Talkeetna’s elementary school were being bused to the local high school Friday. Traffic was blocked from entering Talkeetna until the evacuation was no longer mandatory, a change made shortly before 2 p.m. In a flood warning effective through 10 p.m. Friday, the National Weather Service says a levee protecting the town was breached as of 1 p.m. The Talkeetna River is 4 feet above flood stage, and expected to crest Friday evening. “All persons in the vicinity of Talkeetna should take precautions now to protect life and property,” meteorologists wrote. The NWS advises people to avoid crossing flowing streams — even small ones – on foot, or driving across flooded roadways in cars, under the slogan “Turn around, don’t drown.”


************************************************************************************************************

Epidemic Hazards / Diseases

Today Epidemic Hazard USA State of California, San Francisco [San Francisco State University] Damage level Details

Epidemic Hazard in USA on Saturday, 22 September, 2012 at 05:15 (05:15 AM) UTC.

Description
Students at San Francisco State University are being warned to look for symptoms of the chicken pox after a third person came down with the disease this week. School officials say it involves a student who lives on campus and uses the dining facilities. To prevent an outbreak, SFSU held a mass vaccination Friday. Chicken pox is highly contagious. Symptoms can pop up two to three weeks after contact and include fever and a rash that develops into blisters.
Biohazard name: Chickenpox
Biohazard level: 2/4 Medium
Biohazard desc.: Bacteria and viruses that cause only mild disease to humans, or are difficult to contract via aerosol in a lab setting, such as hepatitis A, B, and C, influenza A, Lyme disease, salmonella, mumps, measles, scrapie, dengue fever, and HIV. “Routine diagnostic work with clinical specimens can be done safely at Biosafety Level 2, using Biosafety Level 2 practices and procedures. Research work (including co-cultivation, virus replication studies, or manipulations involving concentrated virus) can be done in a BSL-2 (P2) facility, using BSL-3 practices and procedures. Virus production activities, including virus concentrations, require a BSL-3 (P3) facility and use of BSL-3 practices and procedures”, see Recommended Biosafety Levels for Infectious Agents.
Symptoms:
Status: confirmed
Today Epidemic Hazard USA State of New York, New Paltz [Mountain Laurel Waldorf School] Damage level Details

Epidemic Hazard in USA on Saturday, 22 September, 2012 at 05:13 (05:13 AM) UTC.

Description
A case of measles has been confirmed in a student who attends the Mountain Laurel Waldorf School in New Paltz, according to the Dutchess County Department of Health. The measles case was reported by Dutchess County Health Commissioner Dr. Michael Caldwell in a press release emailed to local media outlets late Friday. It was not immediately clear why the release came from a Dutchess County official rather than one in Ulster County, where the private school is located, and the name and hometown of the infected person were not provided. Caldwell said his office has “been in close communication” with the Ulster County Department of Health and the state Department of Health. Caldwell said anyone who has visited the school since Sept. 10 or has had contact with anyone from the school since that date should make sure their measles vaccinations are up to date. Those who lack proper vaccinations should consult with a doctor. Caldwell said his department has learned that a number of students at the New Paltz school have not been vaccinated for measles, meaning they could become ill and put others at risk. Caldwell said all medical practices and laboratories in the area should be on high alert that there may be a number of children and family members who have been exposed and could spread the disease further. Incidents of measles, which is highly contagious, have increased in the United States recently due to a growing number of unvaccinated individuals who travel to countries where measles is prevalent, Caldwell said.
Biohazard name: Measles
Biohazard level: 2/4 Medium
Biohazard desc.: Bacteria and viruses that cause only mild disease to humans, or are difficult to contract via aerosol in a lab setting, such as hepatitis A, B, and C, influenza A, Lyme disease, salmonella, mumps, measles, scrapie, dengue fever, and HIV. “Routine diagnostic work with clinical specimens can be done safely at Biosafety Level 2, using Biosafety Level 2 practices and procedures. Research work (including co-cultivation, virus replication studies, or manipulations involving concentrated virus) can be done in a BSL-2 (P2) facility, using BSL-3 practices and procedures. Virus production activities, including virus concentrations, require a BSL-3 (P3) facility and use of BSL-3 practices and procedures”, see Recommended Biosafety Levels for Infectious Agents.
Symptoms:
Status: confirmed
Today Epidemic Hazard USA State of Montana, [Florence Carlton School Distric] Damage level Details

Epidemic Hazard in USA on Saturday, 22 September, 2012 at 04:48 (04:48 AM) UTC.

Description
Administrators at the Florence Carlton School District report that between 20 and 30 students are sick with an undiagnosed illness. Most of the reports come from younger students between kindergarten and 6th grades. They’re reporting symptoms like nausea, vomiting and diarrhea. It’s not unlike what the district dealt with in March. Back then, the schools closed for several days to deal with a strain of the stomach flu. Right now, Superintendent John McGee says the district is watching and waiting to see what develops. Ravalli County Health Officials are investigating the causes for the illness. Judy Griffin Ravalli County Health Director says if your child is showing any symptoms of any sickness please take them to your primary physician.
Biohazard name: Unidentified illness
Biohazard level: 0/4 —
Biohazard desc.: This does not included biological hazard category.
Symptoms: nausea, vomiting and diarrhea
Status:
21.09.2012 Epidemic Hazard United Kingdom England, [Cumbria Region] Damage level Details

Epidemic Hazard in United Kingdom on Friday, 21 September, 2012 at 03:01 (03:01 AM) UTC.

Description
Around 6,000 children in Cumbria are at risk of getting measles because they have not had the MMR vaccination, health chiefs have said. NHS Cumbria said 95% of babies in the county had been immunised but that thousands aged between five and 16 had not had the jab. Teenagers moving to Cumbria are also being urged to get protected. In recent months 20 cases of measles – which can leave victims deaf – have been reported in the county. The MMR vaccine is given in two doses, the first after the age of one, the second before the child starts school. Dr Rebecca Wagstaff, the county’s deputy director of public health, said: “Measles is highly infectious and anyone who has not previously been vaccinated is at risk when it gets into a community, as it has done here.”
Biohazard name: Measles
Biohazard level: 2/4 Medium
Biohazard desc.: Bacteria and viruses that cause only mild disease to humans, or are difficult to contract via aerosol in a lab setting, such as hepatitis A, B, and C, influenza A, Lyme disease, salmonella, mumps, measles, scrapie, dengue fever, and HIV. “Routine diagnostic work with clinical specimens can be done safely at Biosafety Level 2, using Biosafety Level 2 practices and procedures. Research work (including co-cultivation, virus replication studies, or manipulations involving concentrated virus) can be done in a BSL-2 (P2) facility, using BSL-3 practices and procedures. Virus production activities, including virus concentrations, require a BSL-3 (P3) facility and use of BSL-3 practices and procedures”, see Recommended Biosafety Levels for Infectious Agents.
Symptoms:
Status: confirmed
20.09.2012 Epidemic Hazard Somalia State of Lower Juba, Hoosingo [District of Badade] Damage level Details

Epidemic Hazard in Somalia on Tuesday, 18 September, 2012 at 18:35 (06:35 PM) UTC.

Back

Updated: Thursday, 20 September, 2012 at 04:50 UTC
Description
A suspected cholera outbreak has killed at least 19 people since the beginning of September, with 12 still sick in the southern Somali village of Hoosingo in Lower Juba, the United Nations IRIN news service reported Tuesday (September 18th). “One of the biggest problems we have is that we do not know what this disease is,” said Hoosingo village commissioner Aden Ibrahim Dhaqane. Schools, religious centres and restaurants have been closed to prevent the outbreak from spreading, he said. “We call [on] the aid agencies to help us in the following areas: provision of a steady supply of medicine, [the] identification of the disease and the setting up of health centres,” he said, adding that the village does not have a health facility. An emergency weekly update on Somalia from the World Health Organisation reported 107 cases of the disease across the country September 5th-13th. “With the ongoing conflict and subsequent population displacement and disruption of the existing health service access points in the region, the risk of sporadic cholera outbreaks in the southern zone cannot be excluded,” the WHO report said.

************************************************************************************************************

Climate Change

Antarctic Ice Area Sets Record High

Press Release: New Zealand Climate Science Coalition


ANTARCTIC ICE AREA SETS RECORD HIGH

“Day 258 of 2012 is the highest for this date since satellite scanning of Antarctic ice areas commenced 33 years ago” the New Zealand Climate Science Coalition announced today. “It is also the fifth highest daily value on record.”

Coalition chairman, Hon Barry Brill, says the most remarkable aspect is the extent to which the 2012 area exceeds normal Antarctica averages. “The sea ice cover yesterday was 311,000 square kilometres above the 1979-2012 average. The surplus ice is more than twice the area of New Zealand”.

“The Antarctic dimensions come partly at the expense of Arctic sea ice” said Mr Brill. “Over the 33-year period aggregate global sea ice volumes have remained steady, but there are fluctuations between the two polar areas from year to year. The fluctuations are the result of ocean currents and wind patterns, rather than temperatures”.

“Antarctic ice is much more important than that of the Arctic. The area of its sea ice is a million square kilometres larger than the highest value ever recorded in the Arctic. Then, of course, the Antarctic is an entire continent, with more than 90% of the earth’s glacial ice” said Mr Brill.

“It is appropriate that this record should occur in a week that The Listener carries a cover story featuring the winter low point of Arctic ice, along with multiple pictures of calving glaciers and forlorn polar bears,” said Mr Brill. “The magazine has little to say about the Antarctic apart from complaining that it is “poorly understood”. The author also avoids mentioning the glaring facts that no significant global warming has been recorded in the past 16 years, and that sea level rise is apparently decelerating.

“It is unfortunate that under-informed writers, albeit unwittingly, mislead their readers who should be helped to understand the difference between sea ice extent and ice cap ice, both thickness and extent as regards the latter. The ice cap in the Arctic is small compared to the Antarctic. The cap of the Antarctic is increasing in thickness in most places, except around the Antarctic Peninsula.
Sea ice extent is largely a consequence of sea surface temperature, ocean currents and wind,” said Mr Brill, who advised those interested in graphic confirmation of Antarctic sea ice readings to refer to:
http://arctic.atmos.uiuc.edu/cryosphere/IMAGES/seaice.anomaly.antarctic.png
and:
http://arctic.atmos.uiuc.edu/cryosphere/IMAGES/seaice.anomaly.antarctic.png

The Arctic’s Record Breaking Ice Melt

Published on Sep 17, 2012 by

The sea ice in the Arctic Ocean dropped below the previous all-time record set in 2007. This year also marks the first time that there has been less than 4 million square kilometers (1.54 million square miles) of sea ice since satellite observations began in 1979. This animation shows the 2012 time-series of ice extent using sea ice concentration data from the DMSP SSMI/S satellite sensor. The black area represents the daily average (median) sea ice extent over the 1979-2000 time period. Layered over top of that are the daily satellite measurements from January 1 — September 14, 2012. A rapid melt begins in July, whereby the 2012 ice extents fall far below the historical average. The National Snow and Ice Data Center (www.nsidc.org) will confirm the final minimum ice extent data and area once the melt stabilizes, usually in mid-September.

************************************************************************************************************

Solar Activity

2MIN News Sept 21. 2012

Published on Sep 21, 2012 by

2012 Pole Shift Video: http://youtu.be/uI10tKuLtFU

TODAY’S LINKS
Planetary Emergency: http://phys.org/news/2012-09-planetary-emergency-due-arctic-experts.html
China Volcano: http://phys.org/news/2012-09-china-changbaishan-volcano.html
Coronal Caities: http://phys.org/news/2012-09-solar-fleet-peers-coronal-cavities.html
France vs Monsanto: http://phys.org/news/2012-09-france-gm-cancer-threat.html
UK vs Oil: http://phys.org/news/2012-09-uk-lawmakers-moratorium-arctic-drilling.html
Paraguay Storm: http://www.weather.com/news/south-american-storm-causes-death-damage-20120920
IRI Forecasts: http://portal.iri.columbia.edu/portal/server.pt?open=512&objID=944&Pa…
NOAA forecasts: http://www.cpc.ncep.noaa.gov/products/predictions/90day/
China Weather-Modification: http://www.canadafreepress.com/index.php/article/49672 — Historical Ref: http://www.guardian.co.uk/environment/blog/2009/oct/01/china-cloud-seeding-pa…
Tropical TRacker: http://www.wunderground.com/tropical/
Drought Update: http://www.weather.com/news/drought-update-20120920

REPEAT LINKS
Spaceweather: http://spaceweather.com/ [Look on the left at the X-ray Flux and Solar Wind Speed/Density]

HAARP: http://www.haarp.alaska.edu/haarp/data.html [Click online data, and have a little fun]

SDO: http://sdo.gsfc.nasa.gov/data/ [Place to find Solar Images and Videos – as seen from earth]

SOHO: http://sohodata.nascom.nasa.gov/cgi-bin/soho_movie_theater [SOHO; Lasco and EIT – as seen from earth]

Stereo: http://stereo.gsfc.nasa.gov/cgi-bin/images [Stereo; Cor, EUVI, HI – as seen from the side]

SunAEON:http://www.sunaeon.com/#/solarsystem/ [Just click it… trust me]

SOLARIMG: http://solarimg.org/artis/ [All purpose data viewing site]

iSWA: http://iswa.gsfc.nasa.gov/iswa/iSWA.html [Free Application; for advanced sun watchers]

NASA ENLIL SPIRAL: http://iswa.gsfc.nasa.gov:8080/IswaSystemWebApp/iSWACygnetStreamer?timestamp=…
NOAA ENLIL SPIRAL: http://www.swpc.noaa.gov/wsa-enlil/

US Wind Map: http://hint.fm/wind/

NOAA Bouys: http://www.ndbc.noaa.gov/

NOAA Environmental Visualization Laboratory: http://www.nnvl.noaa.gov/Default.php

RSOE: http://hisz.rsoe.hu/alertmap/index2.php [That cool alert map I use]

GOES Xray: http://www.swpc.noaa.gov/sxi/goes15/index.html

JAPAN Radiation Map: http://jciv.iidj.net/map/

LISS: http://earthquake.usgs.gov/monitoring/operations/heliplots_gsn.php

Gamma Ray Bursts: http://grb.sonoma.edu/ [Really? You can’t figure out what this one is for?]

BARTOL Cosmic Rays: http://neutronm.bartol.udel.edu//spaceweather/welcome.html [Top left box, look for BIG blue circles]

TORCON: http://www.weather.com/news/tornado-torcon-index [Tornado Forecast for the day]

GOES Weather: http://rsd.gsfc.nasa.gov/goes/ [Clouds over America]

RAIN RECORDS: http://www.cocorahs.org/ViewData/ListIntensePrecipReports.aspx

EL DORADO WORLD WEATHER MAP: http://www.eldoradocountyweather.com/satellite/ssec/world/world-composite-ir-…

PRESSURE MAP: http://www.woweather.com/cgi-bin/expertcharts?LANG=us&MENU=0000000000&…

HURRICANE TRACKER: http://www.weather.com/weather/hurricanecentral/tracker

INTELLICAST: http://www.intellicast.com/ [Weather site used by many youtubers]

NASA News: http://science.nasa.gov/science-news/science-at-nasa/

PHYSORG: http://phys.org/ [GREAT News Site!]

QUAKES LIST FULL: http://www.emsc-csem.org/Earthquake/seismologist.php

3MIN News Sept 20. 2012

Published on Sep 20, 2012 by

2012 Pole Shift Video: http://youtu.be/uI10tKuLtFU

TODAY’S LINKS
Okeechobee Overflowing: http://www.weather.com/news/lake-okeechobee-drained-20120919
Quantum Physics Changes: http://www.sciencedaily.com/releases/2012/09/120919135312.htm
Climate Change Australia: http://www.sciencedaily.com/releases/2012/09/120919103616.htm
Dust Storm: http://www.weather.com/weather/videos/news-41/top-stories-169/watch-incredibl…
Warm Australia: http://www.weatherzone.com.au/news/early-season-heat-scorches-outback/22446

REPEAT LINKS
Spaceweather: http://spaceweather.com/ [Look on the left at the X-ray Flux and Solar Wind Speed/Density]

HAARP: http://www.haarp.alaska.edu/haarp/data.html [Click online data, and have a little fun]

SDO: http://sdo.gsfc.nasa.gov/data/ [Place to find Solar Images and Videos – as seen from earth]

SOHO: http://sohodata.nascom.nasa.gov/cgi-bin/soho_movie_theater [SOHO; Lasco and EIT – as seen from earth]

Stereo: http://stereo.gsfc.nasa.gov/cgi-bin/images [Stereo; Cor, EUVI, HI – as seen from the side]

SunAEON:http://www.sunaeon.com/#/solarsystem/ [Just click it… trust me]

SOLARIMG: http://solarimg.org/artis/ [All purpose data viewing site]

iSWA: http://iswa.gsfc.nasa.gov/iswa/iSWA.html [Free Application; for advanced sun watchers]

NASA ENLIL SPIRAL: http://iswa.gsfc.nasa.gov:8080/IswaSystemWebApp/iSWACygnetStreamer?timestamp=…
NOAA ENLIL SPIRAL: http://www.swpc.noaa.gov/wsa-enlil/

US Wind Map: http://hint.fm/wind/

NOAA Bouys: http://www.ndbc.noaa.gov/

NOAA Environmental Visualization Laboratory: http://www.nnvl.noaa.gov/Default.php

RSOE: http://hisz.rsoe.hu/alertmap/index2.php [That cool alert map I use]

GOES Xray: http://www.swpc.noaa.gov/sxi/goes15/index.html

JAPAN Radiation Map: http://jciv.iidj.net/map/

LISS: http://earthquake.usgs.gov/monitoring/operations/heliplots_gsn.php

Gamma Ray Bursts: http://grb.sonoma.edu/ [Really? You can’t figure out what this one is for?]

BARTOL Cosmic Rays: http://neutronm.bartol.udel.edu//spaceweather/welcome.html [Top left box, look for BIG blue circles]

TORCON: http://www.weather.com/news/tornado-torcon-index [Tornado Forecast for the day]

GOES Weather: http://rsd.gsfc.nasa.gov/goes/ [Clouds over America]

RAIN RECORDS: http://www.cocorahs.org/ViewData/ListIntensePrecipReports.aspx

EL DORADO WORLD WEATHER MAP: http://www.eldoradocountyweather.com/satellite/ssec/world/world-composite-ir-…

PRESSURE MAP: http://www.woweather.com/cgi-bin/expertcharts?LANG=us&MENU=0000000000&…

HURRICANE TRACKER: http://www.weather.com/weather/hurricanecentral/tracker

INTELLICAST: http://www.intellicast.com/ [Weather site used by many youtubers]

NASA News: http://science.nasa.gov/science-news/science-at-nasa/

PHYSORG: http://phys.org/ [GREAT News Site!]

QUAKES LIST FULL: http://www.emsc-csem.org/Earthquake/seismologist.php

************************************************************************************************************

Space

Today Event into space United Kingdom Scotland, [Between Airdrie and Arbroath] Damage level Details

Event into space in United Kingdom on Saturday, 22 September, 2012 at 04:54 (04:54 AM) UTC.

Description
A suspected meteorite shower over Scotland has prompted a flurry of 999 calls from worried members of the public. Concerned callers from Airdrie to Arbroath likened the lights they saw in the sky to flares, fireworks and even a plane crash. Coastguard and police forces up and down the country were inundated with reports from around 11pm on Friday night. A spokesman for Forth Coastguard said: “From talking to other stations and to the RAF it’s almost certainly meteorite activity. “Calls came in from all over the place, thick and fast. We’ve had people report possible plane crashes, and others the weirdest fireworks they’ve ever seen. “Folk just haven’t known how to describe what they’ve seen. It’s quite extraordinary.” The spokesman said reports had come from Crail, Johnshaven and Arbroath. Clyde Coastguard said it had received a “flurry” of calls reporting flares seen in Drummore, Airdrie and Brodick on Arran. A spokeswoman said: “When we get it all over and at the same time then we attribute them to meteorites. There was meteorite activity forecast from September 15 to 21.” Shetland Coastguard said a report of a flare at 11.10pm at Duncansby Head near John O’Groats was thought to be part of the meteorite shower.

 Earth approaching objects (objects that are known in the next 30 days)

Object Name Apporach Date Left AU Distance LD Distance Estimated Diameter* Relative Velocity
(2009 SH2) 24th September 2012 2 day(s) 0.1462 56.9 28 m – 62 m 7.52 km/s 27072 km/h
333578 (2006 KM103) 25th September 2012 3 day(s) 0.0626 24.4 250 m – 560 m 8.54 km/s 30744 km/h
(2002 EZ2) 26th September 2012 4 day(s) 0.1922 74.8 270 m – 610 m 6.76 km/s 24336 km/h
(2009 SB170) 29th September 2012 7 day(s) 0.1789 69.6 200 m – 440 m 32.39 km/s 116604 km/h
(2011 OJ45) 29th September 2012 7 day(s) 0.1339 52.1 18 m – 39 m 4.24 km/s 15264 km/h
(2012 JS11) 30th September 2012 8 day(s) 0.0712 27.7 270 m – 600 m 12.60 km/s 45360 km/h
137032 (1998 UO1) 04th October 2012 12 day(s) 0.1545 60.1 1.3 km – 2.9 km 32.90 km/s 118440 km/h
(2012 GV11) 05th October 2012 13 day(s) 0.1830 71.2 100 m – 230 m 6.96 km/s 25056 km/h
(2009 XZ1) 05th October 2012 13 day(s) 0.1382 53.8 120 m – 280 m 16.87 km/s 60732 km/h
(2006 TD) 06th October 2012 14 day(s) 0.1746 68.0 88 m – 200 m 13.03 km/s 46908 km/h
(2009 TK) 06th October 2012 14 day(s) 0.0450 17.5 100 m – 230 m 11.10 km/s 39960 km/h
(2004 UB) 08th October 2012 16 day(s) 0.1995 77.6 240 m – 530 m 14.65 km/s 52740 km/h
277830 (2006 HR29) 11th October 2012 19 day(s) 0.1917 74.6 190 m – 440 m 7.88 km/s 28368 km/h
(2008 BW2) 11th October 2012 19 day(s) 0.1678 65.3 3.1 m – 6.8 m 11.10 km/s 39960 km/h
(2005 GQ21) 12th October 2012 20 day(s) 0.1980 77.0 620 m – 1.4 km 23.86 km/s 85896 km/h
(2012 GV17) 12th October 2012 20 day(s) 0.1500 58.4 160 m – 370 m 16.11 km/s 57996 km/h
256004 (2006 UP) 14th October 2012 22 day(s) 0.1374 53.5 65 m – 140 m 3.06 km/s 11016 km/h
(2005 ST1) 14th October 2012 22 day(s) 0.1319 51.3 230 m – 510 m 12.88 km/s 46368 km/h
(2011 OB57) 14th October 2012 22 day(s) 0.1553 60.4 17 m – 37 m 4.95 km/s 17820 km/h
(2012 KB4) 14th October 2012 22 day(s) 0.1271 49.4 22 m – 49 m 4.98 km/s 17928 km/h
(2004 RX10) 15th October 2012 23 day(s) 0.0819 31.9 150 m – 340 m 11.86 km/s 42696 km/h
(2006 WV1) 15th October 2012 23 day(s) 0.0910 35.4 17 m – 39 m 6.15 km/s 22140 km/h
(2012 LA) 16th October 2012 24 day(s) 0.0449 17.5 8.3 m – 19 m 1.86 km/s 6696 km/h
329275 (1999 VP6) 17th October 2012 25 day(s) 0.1766 68.7 300 m – 670 m 7.15 km/s 25740 km/h
136993 (1998 ST49) 18th October 2012 26 day(s) 0.0737 28.7 790 m – 1.8 km 16.63 km/s 59868 km/h
(2002 TR190) 19th October 2012 27 day(s) 0.1712 66.6 430 m – 960 m 13.58 km/s 48888 km/h
(1998 XX2) 20th October 2012 28 day(s) 0.1356 52.8 290 m – 650 m 10.62 km/s 38232 km/h
(2003 UC5) 21st October 2012 29 day(s) 0.1750 68.1 260 m – 580 m 35.80 km/s 128880 km/h
1 AU = ~150 million kilometers,1 LD = Lunar Distance = ~384,000 kilometers Source: NASA-NEO


*************************************************************************************************************

Biological Hazards / Wildlife / Environmental Pollution

Biological Hazard in USA on Saturday, 22 September, 2012 at 05:21 (05:21 AM) UTC.

Description
A mysterious coral die-off on Kauai’s north shore is prompting a team of scientists to take a closer look at what may be killing large areas of coral reef. Marine biologist Terry Lilley has been monitoring and documenting Kauai’s marine environment for the last decade or more. This summer he was struck at how fast he was seeing something kill off what he estimates are millions of coral colonies. Lilley contacted scientists with the U.S. Geological Survey who’ve determined the diseased coral is different from what killed coral heads in Kaneohe Bay last year. The Kauai outbreak is believed to be due to a type of cyano bacteria and fungus which has compromised the health of the reef, according to researcher Thierry Work. Work said he took samples from the reef earlier this month and will be back to collect more coral and fish to conduct toxicology tests. Lilley has sounded the alarm which he hopes will trigger action to get the disease in check, and prevent its spread. “We have a billion dollar industry tourist industry in Hawaii with snorkels who want to see the reefs. If we let them die on the north shore of Kauai, that’s going to be a huge impact financially on the resources, and the money coming in,” said Lilley. The Kauai resident is also concerned about what he saw on a recent dive where he documented evidence of diseased turtles and fish.
Biohazard name: Mass. Die-off (corals)
Biohazard level: 0/4 —
Biohazard desc.: This does not included biological hazard category.
Symptoms:
Status: confirmed
21.09.2012 Biological Hazard Pakistan State of Sindh, [Malir District] Damage level Details

Biological Hazard in Pakistan on Friday, 21 September, 2012 at 03:10 (03:10 AM) UTC.

Description
The Department of Livestock Sindh has said that evidence has been gathered that points to the dead Australian sheep’s being affected by the deadly Anthrax infection. The day-to-day developments in connection with the Australian sheep’s import to Pakistan continue to give a new twist to the story. Only yesterday, the discovery of thousands of these sheep from a private compound in Malir District had raised new questions. Out of these, six were found dead with bleeding mouths. This is not it. More dead sheep were also discovered buried under ground and these had mouths infested with parasites. Now a fresh disclosure hints at the dead sheep’s being infected by the deadly Anthrax virus. Originally, it was believed that the sheep suffered from scabby mouth disease. Due to the possible presence of Anthrax, the Department of Livestock has refused to get the post-mortem done on the dead sheep. The reason is clear. The deadly Anthrax virus can even kill the staff carrying out the post-mortem of the sheep. Director Department of Livestock, Nazir Kalhoro has said that after the evidence hinting at presence of Anthrax, arrangements are now geing made to burry these sheep with the help of machines. Only those dead sheep will be put through post-mortem which had not contracted Anthrax, he added. Meanwhile, as many as 1800 samples from the sheep have been sent for tests to the Livestock laboratories in Tando Jam, Karachi and Islamabad. According to sources, the company that had imported the sheep has been served a letter in which it has been directed to prove the Anthrax claims of the investigation team wrong or get ready for a legal action.
Biohazard name: Anthrax (sheep)
Biohazard level: 4/4 Hazardous
Biohazard desc.: Viruses and bacteria that cause severe to fatal disease in humans, and for which vaccines or other treatments are not available, such as Bolivian and Argentine hemorrhagic fevers, H5N1(bird flu), Dengue hemorrhagic fever, Marburg virus, Ebola virus, hantaviruses, Lassa fever, Crimean-Congo hemorrhagic fever, and other hemorrhagic or unidentified diseases. When dealing with biological hazards at this level the use of a Hazmat suit and a self-contained oxygen supply is mandatory. The entrance and exit of a Level Four biolab will contain multiple showers, a vacuum room, an ultraviolet light room, autonomous detection system, and other safety precautions designed to destroy all traces of the biohazard. Multiple airlocks are employed and are electronically secured to prevent both doors opening at the same time. All air and water service going to and coming from a Biosafety Level 4 (P4) lab will undergo similar decontamination procedures to eliminate the possibility of an accidental release.
Symptoms:
Status: confirmed

………………………..

Today Environment Pollution USA State of Hawaii, [Coastal of Waimanalo] Damage level Details

Environment Pollution in USA on Saturday, 22 September, 2012 at 05:03 (05:03 AM) UTC.

Description
A large plastic bin is the first confirmed piece of marine debris from last year’s Japan tsunamis to arrive in Hawaii, the National Oceanic and Atmospheric Administration said Friday. Japanese consular officials confirmed that the blue bin found earlier this week floating in the ocean is from Fukushima, said Ben Sherman, a NOAA spokesman in Washington, D.C. It’s the 12th confirmed piece to hit U.S. or Canada waters, he said. The bin was spotted off Waimanalo, on the southeast coast of Oahu, by Makai Ocean Engineering staff and was retrieved by the Hawaii Undersea Research Laboratory. Used for transporting seafood, the 4-by-4-foot cube bears the name Y.K. Suisan Co. Ltd., the state Department of Land and Natural Resources said. Nikolai Maximenko, a University of Hawaii researcher and ocean currents expert who is studying the trajectory of the tsunami debris, said the bin’s arrival is consistent with his predictions for when the first pieces would get to Hawaii. “It came at the right time, according to our model,” he said. “But in some sense, it could just be a coincidence.” One million to 2 million tons of debris remain in the ocean, but only 1 to 5 percent of that could reach American and Canadian shorelines, Maximenko has said. Crabs and barnacles were found on the bin, the state said, along with five local seabirds. Two flew away and three were found dead inside the bin. There were no foreign plant or animal species in or on the bin, which state officials put in quarantine. Meanwhile, Hawaii fishermen spotted a large dock drifting toward Oahu that may also be tsunami debris. A Maui fisherman climbed on the dock and saw Japanese writing. The 30-feet by 50-feet dock was spotted Wednesday off Molokai, heading toward Oahu. The Coast Guard was notifying mariners of the debris.

**************************************************************************************************************

Articles of Interest

Swollen Lake Okeechobee Drained

EDT Associated Press1

Getty Images

Water levels in the Lake Okeechobee top 15 feet and are still rising from rains dumped by Tropical Storm Isaac.

MIAMI — Federal engineers are draining storm-swollen Lake Okeechobee.

Water levels in the South Florida lake top 15 feet and are still rising from rains dumped by Tropical Storm Isaac. Draining the lake will ease pressure on its aging dike.

It also means sending polluted waters down the Caloosahatchee and St. Lucie rivers. Draining the lake in the past has triggered fish-killing algae blooms in both rivers.

Lt. Col. Thomas Greco of the U.S. Army Corps of Engineers tells the Miami Herald that, starting Wednesday, engineers will release small amounts of water to minimize environmental impacts.

According to the Corps plan, the lake’s water levels are supposed to stay between 12.5 feet and 15.5 feet.

Lake Okeechobee functions as a flood control basin, a regional water reservoir and a fishing destination.

Experiment Corrects Prediction in Quantum Theory

ScienceDaily

An international team of scientists is rewriting a page from the quantum physics rulebook using a University of Florida laboratory once dubbed the coldest spot in the universe.

Scientists are rewriting a page from the quantum physics rulebook using a laboratory once dubbed the coldest spot in the universe. (Credit: iStockphoto/Nick Schlax)

Much of what we know about quantum mechanics is theoretical and tested via computer modeling because quantum systems, like electrons whizzing around the nucleus of an atom, are difficult to pin down for observation. One can, however, slow particles down and catch them in the quantum act by subjecting them to extremely cold temperatures. New research, published in the Sept. 20 edition of the journal Nature, describes how this freeze-frame approach was recently used to overturn an accepted rule of thumb in quantum theory.

“We are in the age of quantum mechanics,” said Neil Sullivan, a UF physics professor and director of the National High Magnetic Field Laboratory High B/T Facility on the UF campus — home of the Microkelvin lab where experiments can be conducted in near-absolute zero temperatures. “If you’ve had an MRI, you have made use of a quantum technology.”

The magnet that powers an MRI scanner is a superconducting coil transformed into a quantum state by very cold liquid helium. Inside the coil, electric current flows friction free.

Quantum magnets and other strange, almost otherworldly occurrences in quantum mechanics could inspire the next big breakthroughs in computing, alternative energy and transportation technologies such as magnetic levitating trains, Sullivan said. But innovation cannot proceed without a proper set of guidelines to help engineers navigate the quantum road.

That’s where the Microkelvin lab comes in. It is one of the few facilities in the world equipped to deliver the extremely cold temperatures needed to slow what Sullivan calls the “higgledy-piggledy” world of quantum systems at normal temperatures to a manageable pace where it can be observed and manipulated.

“Room temperature is approximately 300 kelvin,” Sullivan said. “Liquid hydrogen pumped into a rocket at the Kennedy Space Center is at 20 kelvin.”

Physicists need to cool things down to 1 millikelvin, one thousandth of a kelvin above absolute zero, or -459.67 degrees Fahrenheit, to bring matter into a different realm where quantum properties can be explored.

One fundamental state of quantum mechanics that scientists are keen to understand more fully is a fragile, ephemeral phase of matter called a Bose-Einstein Condensate. In this state, individual particles that make up a material begin to act as a single coherent unit. It’s a tricky condition to induce in a laboratory setting, but one that researchers need to explore if technology is ever to fully exploit the properties of the quantum world.

Two theorists, Tommaso Roscilde at the University of Lyon, France, and Rong Yu from Rice University in Houston, developed the underlying ideas for the study and asked a colleague, Armando Paduan-Filho from the University of Sao Paulo in Brazil, to engineer the crystalline sample used in the experiment.

“Our measurements definitively tested an important prediction about a particular behavior in a Bose-Einstein Condensate,” said Vivien Zapf, a staff scientist at the National High Magnetic Field Laboratory at Los Alamos and a driving force behind the international collaboration.

The experiment monitored the atomic spin of subatomic particles called bosons in the crystal to see when the transition to Bose-Einstein Condensate was achieved, and then further cooled the sample to document the exact point where the condensate properties decayed. They observed the anticipated phenomenon when they took the sample down to 1 millikelvin.

The crystal used in the experiment had been doped with impurities in an effort to create more of a real world scenario, Zapf said. “It’s nice to know what happens in pure samples, but the real world, is messy and we need to know what the quantum rules are in those situations.”

Having performed a series of simulations in advance, they knew that the experiment would require them to generate temperatures down to 1 millikelvin.

“You have to go to the Microkelvin Laboratory at UF for that,” she said. The lab is housed within the National High Magnetic Field Laboratory High B/T Facility at UF, funded by the National Science Foundation. Other laboratories can get to the extreme temperature required, but none of them can sustain it long enough to collect all of the data needed for the experiment.

“It took six months to get the readings,” said Liang Yin, an assistant scientist in the UF physics department who operated the equipment in the Microkelvin lab. “Because the magnetic field we used to control the wave intensity in the sample also heats it up. You have to adjust it very slowly.”

Their findings literally rewrote the rule for predicting the conditions under which the transition would occur between the two quantum states.

“All the world should be watching what happens as we uncover properties of systems at these extremely low temperatures,” Sullivan said. “A superconducting wire is superconducting because of this Bose-Einstein Condensation concept. If we are ever to capitalize on it for quantum computing or magnetic levitation for trains, we have to thoroughly understand it.”

*************************************************************************************************************

[In accordance with Title 17 U.S.C. Section 107, this material is distributed without profit, for research and/or educational purposes. This constitutes ‘FAIR USE’ of any such copyrighted material.]

Earthquakes

USGS     Southern California
Apr 29 23:37 PM
2.6     5.3     MAP

GEOFON     Kermadec Islands, New Zealand
Apr 29 23:02 PM
4.8     0.0     MAP

GEOFON     Fox Islands, Aleutian Islands
Apr 29 22:54 PM
4.5     0.0     MAP

USGS     Southern California
Apr 29 22:53 PM
2.8     6.9     MAP

EMSC     Eastern Turkey
Apr 29 22:51 PM
2.4     6.0     MAP

GEOFON     Sumbawa Region, Indonesia
Apr 29 22:50 PM
4.7     0.0     MAP

EMSC     Eastern Turkey
Apr 29 22:39 PM
2.6     7.0     MAP

USGS     Kermadec Islands, New Zealand
Apr 29 22:35 PM
4.9     48.2     MAP

EMSC     Kermadec Islands, New Zealand
Apr 29 22:35 PM
4.8     40.0     MAP

EMSC     Fyr Of Macedonia
Apr 29 22:26 PM
2.6     1.0     MAP

USGS     Fox Islands, Aleutian Islands, Alaska
Apr 29 22:00 PM
4.5     52.6     MAP

EMSC     Fox Islands, Aleutian Islands
Apr 29 22:00 PM
4.5     49.0     MAP

GEONET     Canterbury
Apr 29 21:16 PM
3.1     5.0     MAP

GEONET     Otago    , New Zealand
Apr 29 21:14 PM
4.4     5.0     MAP

USGS     Southern Alaska
Apr 29 20:48 PM
3.2     95.8     MAP

USGS     Central Alaska
Apr 29 20:46 PM
2.5     83.6     MAP

EMSC     Carlsberg Ridge
Apr 29 20:07 PM
4.7     10.0     MAP

EMSC     Dodecanese Islands, Greece
Apr 29 19:57 PM
2.9     5.0     MAP

EMSC     Crete, Greece
Apr 29 19:44 PM
3.0     5.0     MAP

EMSC     Eastern Turkey
Apr 29 19:37 PM
2.6     5.0     MAP

EMSC     Southern Greece
Apr 29 19:21 PM
2.6     29.0     MAP

EMSC     Iran-iraq Border Region
Apr 29 19:03 PM
3.8     5.0     MAP

EMSC     Greece
Apr 29 18:50 PM
2.5     5.0     MAP

EMSC     Turkey-iran Border Region
Apr 29 18:31 PM
2.6     5.0     MAP

EMSC     Turkey-iran Border Region
Apr 29 18:16 PM
2.4     5.0     MAP

USGS     Island Of Hawaii, Hawaii
Apr 29 17:49 PM
2.7     8.6     MAP

EMSC     Off East Coast Of Honshu, Japan
Apr 29 17:28 PM
4.6     10.0     MAP

USGS     Off The East Coast Of Honshu, Japan
Apr 29 17:28 PM
4.5     37.3     MAP

GEOFON     Off East Coast Of Honshu, Japan
Apr 29 17:28 PM
4.5     0.0     MAP

EMSC     Western Turkey
Apr 29 16:57 PM
2.6     5.0     MAP

EMSC     Eastern Turkey
Apr 29 16:52 PM
2.9     5.0     MAP

EMSC     Eastern Turkey
Apr 29 16:15 PM
2.8     5.0     MAP

USGS     Long Valley Area, California
Apr 29 16:05 PM
2.6     4.6     MAP

EMSC     Northern Italy
Apr 29 16:01 PM
2.4     9.0     MAP

EMSC     Volcano Islands, Japan Region
Apr 29 15:45 PM
4.9     47.0     MAP

USGS     Volcano Islands, Japan Region
Apr 29 15:45 PM
4.9     41.7     MAP

GEOFON     Volcano Islands, Japan Region
Apr 29 15:45 PM
4.9     0.0     MAP

EMSC     Near East Coast Of Honshu, Japan
Apr 29 15:02 PM
5.4     10.0     MAP

USGS     Near The East Coast Of Honshu, Japan
Apr 29 15:02 PM
5.8     10.0     MAP

GEOFON     Near East Coast Of Honshu, Japan
Apr 29 15:02 PM
5.3     0.0     MAP

GEOFON     Carlsberg Ridge
Apr 29 13:54 PM
4.7     0.0     MAP

EMSC     Greece
Apr 29 13:23 PM
2.7     10.0     MAP

EMSC     Western Turkey
Apr 29 13:23 PM
2.6     16.0     MAP

EMSC     Western Turkey
Apr 29 12:56 PM
2.5     12.0     MAP

USGS     San Francisco Bay Area, California
Apr 29 12:53 PM
2.7     10.6     MAP

EMSC     Albania
Apr 29 12:50 PM
2.7     25.0     MAP

GEOFON     South Of Fiji Islands
Apr 29 12:46 PM
4.7     0.0     MAP

USGS     South Of The Fiji Islands
Apr 29 12:46 PM
4.6     212.1     MAP

EMSC     South Of Fiji Islands
Apr 29 12:46 PM
4.6     220.0     MAP

EMSC     Eastern Honshu, Japan
Apr 29 12:16 PM
4.6     48.0     MAP

GEOFON     Eastern Honshu, Japan
Apr 29 12:16 PM
4.8     0.0     MAP

USGS     Near The East Coast Of Honshu, Japan
Apr 29 12:16 PM
4.6     61.7     MAP

EMSC     Southern Iran
Apr 29 11:58 AM
4.4     103.0     MAP

USGS     Southern Iran
Apr 29 11:58 AM
4.5     97.8     MAP

GEOFON     Southern Iran
Apr 29 11:58 AM
4.5     0.0     MAP

GEOFON     North Indian Ocean
Apr 29 11:34 AM

EMSC     Azores Islands, Portugal
Apr 29 11:15 AM
3.1     1.0     MAP

USGS     Southern Alaska
Apr 29 10:57 AM
3.2     5.4     MAP

EMSC     Western Turkey
Apr 29 10:46 AM
2.8     14.0     MAP

USGS     Near The East Coast Of Honshu, Japan
Apr 29 10:28 AM
5.8     39.9     MAP

EMSC     Near East Coast Of Honshu, Japan
Apr 29 10:28 AM
5.8     40.0     MAP

GEOFON     Near East Coast Of Honshu, Japan
Apr 29 10:28 AM
5.8     0.0     MAP

GEONET     Gisborne   , New Zealand
Apr 29 10:05 AM
3.8     25.0     MAP

EMSC     Western Turkey
Apr 29 10:04 AM
3.0     7.0     MAP

EMSC     Eastern Turkey
Apr 29 09:51 AM
2.6     18.0     MAP

EMSC     Western Turkey
Apr 29 09:40 AM
3.0     5.0     MAP

EMSC     Western Turkey
Apr 29 09:03 AM
2.7     3.0     MAP

USGS     South Of Tonga
Apr 29 09:01 AM
4.5     35.8     MAP

EMSC     South Of Tonga
Apr 29 09:01 AM
4.5     36.0     MAP

EMSC     France
Apr 29 08:59 AM
2.5     2.0     MAP

USGS     Off The West Coast Of Northern Sumatra
Apr 29 08:09 AM
5.4     23.3     MAP

EMSC     Off W Coast Of Northern Sumatra
Apr 29 08:09 AM
5.7     10.0     MAP

GEOFON     Off West Coast Of Northern Sumatra
Apr 29 08:09 AM
5.7     0.0     MAP

EMSC     Dodecanese Islands, Greece
Apr 29 07:18 AM
3.2     10.0     MAP

USGS     Guerrero, Mexico
Apr 29 07:17 AM
4.5     12.8     MAP

EMSC     Guerrero, Mexico
Apr 29 07:17 AM
4.6     15.0     MAP

GEOFON     Near Coast Of Guerrero, Mexico
Apr 29 07:17 AM
4.5     0.0     MAP

USGS     Southeast Of Easter Island
Apr 29 06:52 AM
4.8     10.0     MAP

EMSC     Southeast Of Easter Island
Apr 29 06:52 AM
4.7     10.0     MAP

GEOFON     Southeast Of Easter Island
Apr 29 06:52 AM
4.8     0.0     MAP

EMSC     Western Turkey
Apr 29 06:25 AM
2.9     6.0     MAP

GEOFON     Northern Chile
Apr 29 06:22 AM
4.3     0.0     MAP

USGS     Tarapaca, Chile
Apr 29 06:22 AM
4.1     114.8     MAP

EMSC     Tarapaca, Chile
Apr 29 06:22 AM
4.1     113.0     MAP

EMSC     Albania
Apr 29 05:54 AM
2.8     2.0     MAP

EMSC     Strait Of Gibraltar
Apr 29 05:41 AM
2.7     60.0     MAP

EMSC     Central Turkey
Apr 29 05:32 AM
2.5     9.0     MAP

GEOFON     Germany
Apr 29 05:28 AM
2.6     0.0     MAP

EMSC     Vancouver Island, Canada Region
Apr 29 05:12 AM
3.8     10.0     MAP

USGS     Vancouver Island, Canada Region
Apr 29 05:12 AM
3.8     10.0     MAP

GEOFON     Near Coast Of Oaxaca, Mexico
Apr 29 04:39 AM
4.5     0.0     MAP

EMSC     Off Coast Of Oaxaca, Mexico
Apr 29 04:39 AM
4.5     40.0     MAP

USGS     Off The Coast Of Oaxaca, Mexico
Apr 29 04:39 AM
4.4     24.8     MAP

USGS     Puerto Rico
Apr 29 04:07 AM
2.7     23.7     MAP

EMSC     Off W Coast Of Northern Sumatra
Apr 29 03:52 AM
5.0     10.0     MAP

GEOFON     Off West Coast Of Northern Sumatra
Apr 29 03:52 AM
5.2     0.0     MAP

USGS     Off The West Coast Of Northern Sumatra
Apr 29 03:52 AM
4.7     15.0     MAP

EMSC     Southwestern Siberia, Russia
Apr 29 03:13 AM
4.1     10.0     MAP

EMSC     Central Turkey
Apr 29 03:13 AM
2.7     31.0     MAP

USGS     Puerto Rico Region
Apr 29 03:09 AM
3.1     32.5     MAP

EMSC     Western Turkey
Apr 29 03:03 AM
2.5     5.0     MAP

EMSC     Off W Coast Of Northern Sumatra
Apr 29 03:00 AM
5.0     40.0     MAP

GEOFON     Off West Coast Of Northern Sumatra
Apr 29 03:00 AM
5.1     0.0     MAP

USGS     Off The West Coast Of Northern Sumatra
Apr 29 03:00 AM
4.9     15.2     MAP

USGS     Puerto Rico Region
Apr 29 02:55 AM
3.3     46.2     MAP

EMSC     Off W Coast Of Northern Sumatra
Apr 29 02:14 AM
4.8     51.0     MAP

GEOFON     North Indian Ocean
Apr 29 02:13 AM
5.0     0.0     MAP

USGS     North Indian Ocean
Apr 29 02:13 AM
4.6     14.9     MAP

USGS     Papua, Indonesia
Apr 29 02:11 AM
4.5     15.2     MAP

EMSC     Papua, Indonesia
Apr 29 02:11 AM
4.5     15.0     MAP

EMSC     Southern Greece

 Apr 29 01:58 AM

 2.5     5.0     MAP

EMSC     Papua, Indonesia
Apr 29 01:57 AM
5.2     40.0     MAP

GEOFON     Irian Jaya, Indonesia
Apr 29 01:57 AM
5.1     0.0     MAP

USGS     Papua, Indonesia
Apr 29 01:57 AM
5.2     15.2     MAP

USGS     North Of Honduras
Apr 29 01:55 AM
4.4     18.9     MAP

EMSC     North Of Honduras
Apr 29 01:55 AM
4.4     19.0     MAP

EMSC     Western Turkey
Apr 29 01:42 AM
2.9     7.0     MAP

EMSC     Greece
Apr 29 01:04 AM
3.1     10.0     MAP

EMSC     Near Coast Of Ecuador
Apr 29 00:43 AM
4.7     115.0     MAP

USGS     Near The Coast Of Ecuador
Apr 29 00:43 AM
4.7     115.3     MAP

USGS     Offshore Northern California
Apr 29 00:27 AM
2.5     16.7     MAP

sources:  USGSEMSCGFZGEONET

Earthquakes

Published on Apr 28, 2012 by

EARTHQUAKE/SPACEWEATHER/PLANETARY GEOMETRY DATASET:
http://www.4shared.com/office/jQf-jJVD/Earthquakes_Planetary_Bodies_S.html?
TRY THIS IF THAT FIRST LINK BUGS YOU OUT: http://www.mediafire.com/view/?8yd7ddtd2rd7ffb
Sources Used to Compile Data Set: USGS, SDO, SOHO, JPL, Stellarium, fourmilab [Google them if you don’t know.]

PLANETARY GEOMETRY:
Bigbytes – http://dcsymbols.com/future/quepaso.htm
dcsymbols – http://www.youtube.com/user/dcsymbols

EARTH’s ANGULAR VELOCITY & WEATHER CORRELATION
John Thomas Bryant Jr. – http://www.youtube.com/user/astrotometry

SOLAR/SEISMIC CONNECTION:
1) Solar Activity as a Trigger Mechanism For Earthquakes. Simpson, John F. University of Akron, Akron, Ohio, Revised December 16, 1967
[In my opinion, only valuable for the theorized trigger mechanism]
2) Long-Period Trends in Global Seismic and Geomagnetic Activity and their Relation to Solar Activity. S. Odintsov, K. Boyarchuk, K. Georgieva, B. Kirov, D. Atanasov. Russian Academy of Sciences, Bulgarian Academy of Sciences, Sofia University, Bulgaria. Accepted March 18, 2005.
3) Does the Solar Cycle Modulate Seismic and Volcanic Activty? A. Mazzarella, A. Palumbo. University of Naples, Italy. Accepted April 10, 1989.

SOLAR/ATMOSPHERIC CONNECTION:
Physical Mechanism of the Action of Solar Activty and other Geophysical Factors on the State of the Lower Atmosphere, meteorological parameters, and Climate. M. I. Pudovkin, O. M. Raspoov. Phys.-Usp. 36 644 (http://iopscience.iop.org/1063-7869/36/7/A09). 1993.

CHINA QUAKE – 5/12/2008:
Formation Mechanism of Great Positive TEC Disturbances Prior to Wenchuan Earthquake on May 12, 2008. M. V. Klimenko, V. V. Klimenko, I. E. Zakharenkova, S.A. Pulinets, B. Zhao, M. N. Tsidilina. West Dept. of N.V. Pushkov, Kaliningrad State Technical University, Fedorov Institute of Applied geophysics, IKI (Moscow), Beijing National Observatory of Space Environment, Chinese Academy of Sciences. Accepted March 31, 2011

**********************************************************************************************************

Volcanic Activity

Nicaragua Monitors Microseismic Activity Increase in Volcano

Imagen activaManagua, Apr 29 (Prensa Latina) Nicaraguan Experts reported Sunday more seismic activity at Masaya volcano, about 20 kilometers south of Managua, with an increase in expulsions of sulfur gases, which keeps the disaster warning system in high alert.According to the report, a crack in the main crater causes higher emissions and a sound similar to a jet engine.

Specialists of the National System for Prevention, Mitigation and Attention to Disasters (SINAPRED) and the Nicaraguan Institute of Territorial Studies (INETER), told the press that they detected this unusual behavior several days ago, but for now there is no reason for alarm.

The INETER geophysics director, Angelica Munoz, told the site El 19 Digital they monitor Masayaâ�Ös situation closely because of rising emissions and temperature above the normal range.

Technical teams assess the seismic tremor, but there is no emergency declared and the gates of Masaya Volcano National Park remain open to the public, said the director of INETER, Jorge Castro, and the executive secretary of SINAPRED, Guillermo Gonzalez.

sgl/ isa/rmh/mjm

Modificado el ( domingo, 29 de abril de 2012 )

***********************************************************************************************************

Extreme Temperatures/ Weather

Deadly tent collapse due to high winds

Moscow swelters in record heat

by Staff Writers
Moscow (AFP) April 29, 2012


6.4-magnitude quake strikes off Tonga: USGS
Sydney (AFP) April 28, 2012 – A strong 6.4-magnitude earthquake struck off the Pacific nation of Tonga on Saturday, US seismologists said, but there were no immediate reports of damage and no tsunami warning was issued.The quake happened at 11:08 PM (1008 GMT) 78 kilometres (49 miles) from the town of Neiafu, on the south coast of the island Vava’u, at a depth of about 130 kilometres (80 miles), the US Geological Survey (USGS) said.The epicentre of the tremor was 280 kilometres (173 miles) north of the capital Nuku’alofa.The Pacific Tsunami Warning Centre said in a statement that the quake did not generate a tsunami. The USGS had initially reported it as a 6.7-magnitude quake.

Tonga, almost 2,000 kilometres (1,240 miles) northeast of New Zealand, lies on the so-called Pacific “Ring of Fire”, where continental plates collide causing frequent seismic activity.


Moscow sweltered in unseasonable heat on Sunday, with temperatures of nearly 29 degrees Celsius (84.2 Fahrenheit), a record for April since data collection began 130 years ago, authorities said.

“At 4:00 p.m. (1200 GMT), the temperature reached 28.6 degrees Celsius, an absolute record for the month of April,” an official from the Russian capital’s weather service told the Interfax news agency.

“The previous record for the month goes back to April 24, 1950, with 28 degrees,” he added.

The mercury had already climbed to 26.3 degrees on Saturday.

Several central and eastern European countries recorded unseasonably high temperatures on Saturday, with a record 32 degrees recorded in northern Austria.

Central, eastern Europe swelter in record heat
Vienna (AFP) April 28, 2012 – Summer came early to central and eastern Europe as unseasonally high temperatures were recorded Saturday in several parts of Germany, Austria and the Czech Republic.

Temperatures “are exceptionally mild for April”, Austria’s ZAMG meteorological centre said, reporting a record 32 Celsius (90 Fahrenheit) in the northern region of Lower Austria.

The centre said the main reason for the summer weather gracing the region was a strong southern wind from Africa’s Sahara desert.

Temperatures hovering around 28 Celsius (82 Fahrenheit) in Vienna drew large crowds to the banks of the Danube while Germany’s Bild carried frontpage pictures of Berlin residents sunbathing in 30 degrees.

Prague experienced its hottest April 28 in 212 years, with mercury hitting 27.7 Celsius (82 Fahrenheit) while unusually high temperatures were also recorded in Poland and Slovakia.

Related Links
Weather News at TerraDaily.com

  Short Time Event(s)

  29.04.2012 Extreme Weather Bangladesh Tripura, Panisagar [Dharmanagar town area] Damage level Details

Extreme Weather in Bangladesh on Sunday, 29 April, 2012 at 18:32 (06:32 PM) UTC.

Description
At least three persons including a 76-year-old man was killed and 500 houses collapsed when rain storms swept different parts of Tripura, official sources said on Sunday.A 76-year-old farmer died in Dharmanagar town area and a 30-year-old man died in Panisagar in northern Tripura district when lightning struck them on Saturday, police said.A nine-year-old boy died of electrocution when he came in contact of live wire at Sonamura in Sipahijala district, police said.The pre-monsoon rain accompanied by hailstorm swept different parts of the state collapsing at least 500 houses, uprooting many trees and electric posts.Security forces and civil defence volunteers were engaged in distribution of relief and immediate relieves were given to the next of keens of the deceased, official sources said.At least 12 persons had died within this month due to lightning and electrocution.

Gale Warning

CAPE FLATTERY TO CAPE LOOKOUT
POINT ST GEORGE TO POINT ARENA
POINT ARENA TO POINT CONCEPTION

Hard Freeze Warning

BINGHAMTON NY
BUFFALO NY

Freeze Warning

ALBANY NY
NEW YORK NY
BUFFALO NY
TAUNTON MA
MOUNT HOLLY NJ
BURLINGTON VT
STATE COLLEGE PA

***********************************************************************************************************

Storms, Flooding

Severe Thunderstorm Watch

NORMAN OK
AMARILLO TX

Flash Flood Watch

ST LOUIS MO
SPRINGFIELD MO

Flood Warning

NORMAN OK
TULSA OK
SPRINGFIELD MO
KANSAS CITY/PLEASANT HILL MO
SPOKANE, WA
WICHITA KS
ST LOUIS MO
BOISE ID
 FAIRBANKS AK

************************************************************************************************************

Radiation/Biological Hazard

Poisonous Cloud Could Be Heading Towards The United States
How Dangerous Is It?
28 April, 2012 MessageToEagle.com – A highly poisonous cloud depleted with uranium and radioactive material is heading towards the United States

There are many conflicting reports and it remains unclear just how dangerous the cloud is.

On April 22, at 2:a5 am, the Mitsui petrochemical plant exploded in the town Wagi Yamaguchi, Japan. One worker, and 11 people were injured.

In their press release, the plant owner Mitsui Chemicals, Inc. (Toshikazu Tanaka, President & CEO) declared that “causes of the accident are under investigation by authorities.”

Read Full Article Here

4/27/2012 — Cloud of depleted URANIUM heading towards Hawaii and West Coast?!


full website post here plus links to monitor radiation detection at several world wide locations

************************************************************************************************************

Climate Change

“Warming hole” delayed climate change over eastern United States

by Staff Writers
Boston MA (SPX) Apr 30, 2012


Observed change in surface air temperature between 1930 and 1990. Observations are from the NASA GISS Surface Temperature Analysis. Image courtesy of Eric Leibensperger.

Climate scientists at the Harvard School of Engineering and Applied Sciences (SEAS) have discovered that particulate pollution in the late 20th century created a “warming hole” over the eastern United States-that is, a cold patch where the effects of global warming were temporarily obscured.

While greenhouse gases like carbon dioxide and methane warm the Earth’s surface, tiny particles in the air can have the reverse effect on regional scales.

“What we’ve shown is that particulate pollution over the eastern United States has delayed the warming that we would expect to see from increasing greenhouse gases,” says lead author Eric Leibensperger (Ph.D. ’11), who completed the work as a graduate student in applied physics at SEAS.

“For the sake of protecting human health and reducing acid rain, we’ve now cut the emissions that lead to particulate pollution,” he adds, “but these cuts have caused the greenhouse warming in this region to ramp up to match the global trend.”

At this point, most of the “catch-up” warming has already occurred.

The findings, published in the journal Atmospheric Chemistry and Physics, present a more complete picture of the processes that affect regional climate change. The work also carries significant implications for the future climate of industrial nations, like China, that have not yet implemented air quality regulations to the same extent as the United States.

Until the United States passed the Clean Air Act in 1970 and strengthened it in 1990, particulate pollution hung thick over the central and eastern states. Most of these particles in the atmosphere were made of sulfate, originating as sulfur emissions from coal-fired power plants. Compared to greenhouse gases, particulate pollution has a very short lifetime (about 1 week), so its distribution over the Earth is uneven.

“The primary driver of the warming hole is the aerosol pollution-these small particles,” says Leibensperger. “What they do is reflect incoming sunlight, so we see a cooling effect at the surface.”

This effect has been known for some time, but the new analysis demonstrates the strong impact that decreases in particulate pollution can have on regional climate.

The researchers found that interactions between clouds and particles amplified the cooling. Particles of pollution can act as nucleation sites for cloud droplets, which can in turn reflect even more sunlight than the particles would individually, leading to greater cooling at the surface.

The researchers’ analysis is based on a combination of two complex models of Earth systems. The pollution data comes from the GEOS-Chem model, which was first developed at Harvard and, through a series of many updates, has since become an international standard for modeling pollution over time. The climate data comes from the general circulation model developed by NASA’s Goddard Institute for Space Studies. Both models are rooted in decades’ worth of observational data.

Since the early 20th century, global mean temperatures have risen-by approximately 0.8 degrees Celsius from 1906 to 2005-but in the U.S. “warming hole,” temperatures decreased by as much as 1 degree Celsius during the period 1930-1990. U.S. particulate pollution peaked in 1980 and has since been reduced by about half. By 2010 the average cooling effect over the East had fallen to just 0.3 degrees Celsius.

“Such a large fraction of the sulfate has already been removed that we don’t have much more warming coming along due to further controls on sulfur emissions in the future,” says principal investigator Daniel Jacob, the Vasco McCoy Family Professor of Atmospheric Chemistry and Environmental Engineering at SEAS.

Jacob is also a Professor of Earth and Planetary Sciences at Harvard and a faculty associate of the Harvard University Center for the Environment.

Besides confirming that particulate pollution plays a large role in affecting U.S. regional climate, the research emphasizes the importance of accounting for the climate impacts of particulates in future air quality policies.

“Something similar could happen in China, which is just beginning to tighten up its pollution standards,” says co-author Loretta J. Mickley, a Senior Research Fellow in atmospheric chemistry at SEAS. “China could see significant climate change due to declining levels of particulate pollutants.”

Sulfates are harmful to human health and can also cause acid rain, which damages ecosystems and erodes buildings.

“No one is suggesting that we should stop improving air quality, but it’s important to understand the consequences. Clearing the air could lead to regional warming,” Mickley says.

Leibensperger, Jacob, and Mickley were joined by co-authors Wei-Ting Chen and John H. Seinfeld (California Institute of Technology); Athanasios Nenes (Georgia Institute of Technology); Peter J. Adams (Carnegie Mellon University); David G. Streets (Argonne National Laboratory); Naresh Kumar (Electric Power Research Institute); and David Rind (NASA Goddard Institute for Space Studies). The research was supported by the Electric Power Research Institute (EPRI) and the U.S. Environmental Protection Agency (EPA); neither EPRI nor the EPA has officially endorsed the results. The work also benefited from resources provided by Academic Computing Services at SEAS.

Related Links
Harvard School of Engineering and Applied Sciences
Climate Science News – Modeling, Mitigation Adaptation

************************************************************************************************************

Solar Activity

2MIN Apr29: World Update, Spaceweather

Published on Apr 29, 2012 by

************************************************************************************************************

Space

Tiny ‘spherules’ reveal details about Earth’s asteroid impacts

by Staff Writers
West Lafayette, IN (SPX) Apr 27, 2012


Researchers are learning details about asteroid impacts going back to the Earth’s early history by using a new method for extracting precise information from tiny “spherules” embedded in layers of rock. The spherules were created when asteroids crashed into Earth, vaporizing rock that expanded as a giant vapor plume. Small droplets of molten rock in the plume condensed and solidified, falling back to the surface as a thin layer. This sample was found in Western Australia and formed 2.63 billion years ago in the aftermath of a large impact. Credit: Oberlin College photo/Bruce M. Simonson.

Researchers are learning details about asteroid impacts going back to the Earth’s early history by using a new method for extracting precise information from tiny “spherules” embedded in layers of rock.

The spherules were created when asteroids crashed into the Earth, vaporizing rock that expanded into space as a giant vapor plume. Small droplets of molten and vaporized rock in the plume condensed and solidified, falling back to Earth as a thin layer. The round or oblong particles were preserved in layers of rock, and now researchers have analyzed them to record precise information about asteroids impacting Earth from 3.5 billion to 35 million years ago.

“What we have done is provide the foundation for understanding how to interpret the layers in terms of the size and velocity of the asteroid that made them,” said Jay Melosh, an expert in impact cratering and a distinguished professor of earth and atmospheric sciences, physics and aerospace engineering at Purdue University.

Findings, which support a theory that the Earth endured an especially heavy period of asteroid bombardment early in its history, are detailed in a research paper appearing online in the journal Nature on Wednesday (April 25). The paper was written by Purdue physics graduate student Brandon Johnson and Melosh. The findings, based on geologic observations, support a theoretical study in a companion paper in Nature by researchers at the Southwest Research Institute in Boulder, Colo.

The period of heavy asteroid bombardment – from 4.2 to 3.5 billion years ago – is thought to have been influenced by changes in the early solar system that altered the trajectory of objects in an asteroid belt located between Mars and Jupiter, sending them on a collision course with Earth.

“That’s the postulate, and this is the first real solid evidence that it actually happened,” Melosh said.

“Some of the asteroids that we infer were about 40 kilometers in diameter, much larger than the one that killed off the dinosaurs about 65 million years ago that was about 12-15 kilometers. But when we looked at the number of impactors as a function of size, we got a curve that showed a lot more small objects than large ones, a pattern that matches exactly the distribution of sizes in the asteroid belt. For the first time we have a direct connection between the crater size distribution on the ancient Earth and the sizes of asteroids out in space.”

Because craters are difficult to study directly, impact history must be inferred either by observations of asteroids that periodically pass near the Earth or by studying craters on the moon. Now, the new technique using spherules offers a far more accurate alternative to chronicle asteroid impacts on Earth, Melosh said.

“We can look at these spherules, see how thick the layer is, how big the spherules are, and we can infer the size and velocity of the asteroid,” Melosh said. “We can go back to the earliest era in the history of the Earth and infer the population of asteroids impacting the planet.”

For asteroids larger than about 10 kilometers in diameter, the spherules are deposited in a global layer.

“Some of these impacts were several times larger than the Chicxulub impact that killed off the dinosaurs 65 million years ago,” Johnson said. “The impacts may have played a large role in the evolutional history of life. The large number of impacts may have helped simple life by introducing organics and other important materials at a time when life on Earth was just taking hold.”

A 40-kilometer asteroid would have wiped out everything on the Earth’s surface, whereas the one that struck 65 million years ago killed only land animals weighing more than around 20 kilograms.

“Impact craters are the most obvious indication of asteroid impacts, but craters on Earth are quickly obscured or destroyed by surface weathering and tectonic processes,” Johnson said. “However, the spherule layers, if preserved in the geologic record, provide information about an impact even when the source crater cannot be found.”

The Purdue researchers studied the spherules using computer models that harness mathematical equations developed originally to calculate the condensation of vapor.

“There have been some new wrinkles in vapor condensation modeling that motivated us to do this work, and we were the first to apply it to asteroid impacts,” Melosh said.

The spherules are about a millimeter in diameter.

The researchers also are studying a different type of artifact similar to spherules but found only near the original impact site. Whereas the globally distributed spherules come from the condensing vaporized rock, these “melt droplets” are from rock that’s been melted and not completely vaporized.

“Before this work, it was not possible to distinguish between these two types of formations,” Melosh said. “Nobody had established criteria for discriminating between them, and we’ve done that now.”

One of the authors of the Southwest Research Institute paper, David Minton, is now an assistant professor of earth and atmospheric sciences at Purdue.

Findings from the research may enable Melosh’s team to enhance an asteroid impact effects calculator he developed to estimate what would happen if asteroids of various sizes were to hit the Earth. The calculator, “Impact: Earth!” allows anyone to calculate potential comet or asteroid damage based on the object’s mass.

Related Links
Purdue University
Asteroid and Comet Impact Danger To Earth – News and Science

*************************************************************************************************************

[In accordance with Title 17 U.S.C. Section 107, this material is distributed without profit, for research and/or educational purposes. This constitutes ‘FAIR USE’ of any such copyrighted material.]

Earthquakes

EMSC     Western Turkey
Apr 26 23:46 PM
3.4     5.0     MAP

EMSC     Western Turkey
Apr 26 23:40 PM
3.0     5.0     MAP

EMSC     Western Turkey
Apr 26 23:27 PM
2.5     5.0     MAP

EMSC     Western Turkey
Apr 26 23:07 PM
2.4     5.0     MAP

EMSC     Western Turkey
Apr 26 23:02 PM
2.7     3.0     MAP

EMSC     Western Turkey
Apr 26 22:34 PM
2.5     5.0     MAP

EMSC     Southern Greece
Apr 26 22:28 PM
2.9     20.0     MAP

EMSC     Western Turkey
Apr 26 22:26 PM
2.4     5.0     MAP

EMSC     Western Turkey
Apr 26 22:22 PM
2.5     5.0     MAP

USGS     Long Valley Area, California
Apr 26 22:19 PM
2.6     4.5     MAP

EMSC     Greece
Apr 26 22:18 PM
2.5     5.0     MAP

EMSC     Western Turkey
Apr 26 22:18 PM
2.6     5.0     MAP

GEOFON     Off West Coast Of Northern Sumatra
Apr 26 22:17 PM
4.3     10.0     MAP

USGS     Southwest Of Sumatra, Indonesia
Apr 26 22:16 PM
4.3     10.0     MAP

EMSC     Southwest Of Sumatra, Indonesia
Apr 26 22:16 PM
4.3     10.0     MAP

EMSC     Greece
Apr 26 22:07 PM
2.5     10.0     MAP

EMSC     Western Turkey
Apr 26 22:05 PM
4.9     8.0     MAP

GEOFON     Turkey
Apr 26 22:05 PM
4.6     10.0     MAP

USGS     Western Turkey
Apr 26 22:05 PM
4.6     5.8     MAP

EMSC     Western Turkey
Apr 26 22:02 PM
3.0     5.0     MAP

USGS     Island Of Hawaii, Hawaii
Apr 26 21:36 PM
2.9     36.9     MAP

USGS     Long Valley Area, California
Apr 26 21:08 PM
2.5     4.5     MAP

EMSC     Crete, Greece
Apr 26 21:03 PM
2.8     10.0     MAP

EMSC     Western Turkey
Apr 26 19:58 PM
2.8     5.0     MAP

EMSC     Eastern Turkey
Apr 26 19:53 PM
3.4     4.0     MAP

EMSC     Western Turkey
Apr 26 19:48 PM
2.5     3.0     MAP

EMSC     Albania
Apr 26 19:33 PM
2.5     25.0     MAP

USGS     Off The West Coast Of Northern Sumatra
Apr 26 19:21 PM
5.5     26.0     MAP

GEOFON     Off West Coast Of Northern Sumatra
Apr 26 19:21 PM
5.6     10.0     MAP

EMSC     Off W Coast Of Northern Sumatra
Apr 26 19:21 PM
5.4     10.0     MAP

USGS     Mona Passage, Dominican Republic
Apr 26 18:43 PM
3.3     43.0     MAP

EMSC     Hokkaido, Japan Region
Apr 26 18:41 PM
5.2     60.0     MAP

GEOFON     Hokkaido, Japan Region
Apr 26 18:41 PM
5.2     70.0     MAP

USGS     Hokkaido, Japan Region
Apr 26 18:41 PM
5.1     67.2     MAP

GEOFON     Vanuatu Islands
Apr 26 17:26 PM
4.7     10.0     MAP

EMSC     Eastern Turkey
Apr 26 17:26 PM
3.2     7.0     MAP

USGS     Southern Alaska
Apr 26 17:03 PM
2.5     13.7     MAP

EMSC     Ceram Sea, Indonesia
Apr 26 17:01 PM
4.8     20.0     MAP

GEOFON     Irian Jaya Region, Indonesia
Apr 26 17:01 PM
4.8     22.0     MAP

EMSC     Eastern Turkey
Apr 26 16:55 PM
3.0     7.0     MAP

GEOFON     Chile-bolivia Border Region
Apr 26 16:46 PM
4.3     97.0     MAP

USGS     Antofagasta, Chile
Apr 26 16:45 PM
4.4     110.4     MAP

EMSC     Antofagasta, Chile
Apr 26 16:45 PM
4.4     103.0     MAP

USGS     Off The Coast Of Northern California
Apr 26 16:25 PM
3.0     11.8     MAP

EMSC     Eastern Turkey
Apr 26 16:23 PM
3.6     5.0     MAP

EMSC     Western Turkey
Apr 26 16:10 PM
3.0     3.0     MAP

USGS     Baja California, Mexico
Apr 26 14:48 PM
2.6     10.0     MAP

GEOFON     Off West Coast Of Northern Sumatra
Apr 26 14:39 PM
4.2     10.0     MAP

EMSC     Romania
Apr 26 14:32 PM
4.0     126.0     MAP

USGS     Southern California
Apr 26 13:01 PM
2.5     3.6     MAP

USGS     Long Valley Area, California
Apr 26 12:20 PM
2.5     4.5     MAP

EMSC     Central Turkey
Apr 26 11:53 AM
3.0     12.0     MAP

EMSC     Central Turkey
Apr 26 11:41 AM
2.6     9.0     MAP

USGS     Dominican Republic Region
Apr 26 11:18 AM
3.4     87.0     MAP

USGS     Near The Coast Of Southern Peru
Apr 26 07:57 AM
4.2     67.7     MAP

EMSC     Near Coast Of Southern Peru
Apr 26 07:57 AM
4.2     68.0     MAP

EMSC     Near The Coast Of Western Turkey
Apr 26 07:47 AM
2.5     17.0     MAP

EMSC     Greece
Apr 26 07:24 AM
2.5     9.0     MAP

EMSC     Dodecanese Islands, Greece
Apr 26 06:50 AM
3.3     7.0     MAP

EMSC     Greece
Apr 26 06:45 AM
2.7     10.0     MAP

GEOFON     Fiji Islands Region
Apr 26 06:38 AM
4.8     623.0     MAP

USGS     Fiji Region
Apr 26 06:38 AM
5.0     616.7     MAP

EMSC     Fiji Region
Apr 26 06:38 AM
5.1     614.0     MAP

GEONET     Taupo   ,New Zealand
Apr 26 06:13 AM
2.4     2.0     MAP

GEOFON     Afghanistan-tajikistan Border Region
Apr 26 05:54 AM
4.1     152.0     MAP

USGS     Tajikistan
Apr 26 05:54 AM
4.2     164.9     MAP

EMSC     Tajikistan
Apr 26 05:54 AM
4.2     162.0     MAP

EMSC     Dodecanese Islands, Greece
Apr 26 05:51 AM
2.7     5.0     MAP

EMSC     Western Turkey
Apr 26 05:50 AM
2.7     7.0     MAP

EMSC     Germany
Apr 26 05:27 AM
2.4     20.0     MAP

USGS     Andreanof Islands, Aleutian Islands, Alaska
Apr 26 04:24 AM
3.9     70.7     MAP

EMSC     Dodecanese Islands, Greece
Apr 26 04:13 AM
3.0     9.0     MAP

USGS     Southwestern Siberia, Russia
Apr 26 04:11 AM
4.4     10.0     MAP

EMSC     Southwestern Siberia, Russia
Apr 26 04:11 AM
4.4     30.0     MAP

GEOFON     Southwestern Siberia, Russia
Apr 26 04:11 AM
4.3     10.0     MAP

EMSC     Eastern Turkey
Apr 26 03:42 AM
3.1     2.0     MAP

USGS     Baja California, Mexico
Apr 26 03:25 AM
2.5     6.3     MAP

USGS     South Of The Fiji Islands
Apr 26 02:49 AM
4.8     34.6     MAP

EMSC     South Of Fiji Islands
Apr 26 02:49 AM
4.6     100.0     MAP

GEOFON     South Of Tonga Islands
Apr 26 02:49 AM
5.0     30.0     MAP

EMSC     Eastern Turkey
Apr 26 02:43 AM
2.8     7.0     MAP

EMSC     Sicily, Italy
Apr 26 01:59 AM
2.4     26.0     MAP

EMSC     Romania
Apr 26 01:59 AM
2.7     118.0     MAP

EMSC     Greece
Apr 26 01:29 AM
2.8     118.0     MAP

EMSC     Western Turkey
Apr 26 01:06 AM
2.4     15.0     MAP

EMSC     Southern Iran
Apr 26 00:30 AM
3.5     20.0     MAP

USGS     Central Alaska
Apr 26 00:10 AM
4.0     93.4     MAP

GEOFON     Central Alaska
Apr 26 00:10 AM
4.4     92.0     MAP

sources:  USGSEMSCGFZGEONET

Swarm: Long Valley caldera rattled by small series of tremors

Posted on April 26, 2012
April 26, 2012Long Valley, CA – A series of 8 tremors have erupted at the Long Valley super-volcano caldera over the last 24 hours- two yesterday, and six tremors today. The tremors today were a 1.1 mag (3.2 km), a 2.5 mag (4.5 km), a 1.6 mag (4.5 km), a 1.2 mag (2.8 km), a 1.5 mag (7.9 km) and a 1.3 mag at (3.7 km). This could be the beginning of a swarm so we’ll keep monitoring events and look for updates. –The Extinction Protocol

New dangers and earthquake risks found in Washington

3 more potentially disastrous faults discovered along coast near Canadian border

Kelsey et al / USGS

This LiDAR image acquired in 2006 by USGS shows five paleoseismic study sites (red dots with block perimeters) and three Holocene faults (solid red lines) inferred from the data.

By Crystal Gammon

OurAmazingPlanet
updated 4/26/2012 12:37:04 PM ET

Tectonically speaking, there’s a lot going on in the Pacific Northwest. From the Cascadia subduction zone, where the Juan de Fuca tectonic plate is slowly pushing its way underneath the North American plate, to the Seattle Fault, where Native American legends recorded a massive earthquake 1,100 years ago, the region has its fair share of seismic hazards.

Now add to that three more potentially dangerous faults in the Bellingham Basin, a tectonically active area along the coast of Washington, near the Canadian border. A team of researchers has discovered active tectonic faults in this region nearly 40 miles (60 kilometers) north of any previously known faults.

“We’ve known for a long time that the whole Pacific Northwest region is contracting very slowly north-to-south, at the rate of a few millimeters per year,” said Richard Blakely, a geologist with the U.S. Geological Survey in Menlo Park, Calif., who was part of the study. “It doesn’t sound like very much, but when you concentrate that contraction on specific faults, they can become rather dangerous.”

Big enough
The faults Blakely and his colleagues found are reverse faults — a type of tectonic fault where one side is shoved up over the other side — and the team estimates they’re capable of triggering magnitude-6.0 to -6.5 earthquakes.

“That’s big enough to cause damage and hurt people, but it’s not as severe as a magnitude-7 earthquake, such as the one that occurred on the Seattle fault 1,100 years ago,” Blakely told OurAmazingPlanet.

Read Full Article Here

**********************************************************************************************************

Volcanic Activity

Russian Shiveluch volcano spews ash 10.7km above sea level

Published: Thursday, Apr 26, 2012, 18:02 IST
Place: Vladivostok | Agency: ANI

The Shiveluch volcano on Russia’s Far Eastern Kamchatka Peninsula on Thursday ejected an ash cloud to as high as nearly 11km above the sea level, the Itar-Tass news agency reported.

An ash column from the volcano rose to a height of 10.7km above the sea level.

There was no immediate threat for the population, and no emissions of volcanic dust were monitored in neighboring villages.

Two earthquakes were registered at the volcano over the past 24 hours, which was given the highest Red Aviation Code.

This was the most powerful eruption of ash registered at Shiveluch this year. Shiveluch has been active for more than four weeks.

Shiveluch, standing 3,283 meters above the sea level, is Kamchatka’s northernmost active volcano.

Strong activity continues at Indonesia’s Mount Lokon volcano

by The Extinction Protocol

Posted on April 26, 2012
April 26, 2012 – REPUBLIKA.CO.ID, JAKARTA – Head of Data Center for Information and Public Relations of the National Disaster Management Agency (BNPB), Sutopo Purwo Nugrogo said Lokon was shaken by another volcanic tremor in Tomohon, North Sulawesi. In addition, the volcano is stirred by 1 to 3 shallow tremors every 5 minutes. If activity continues to increase at the volcano, officials fear an eruption could be imminent. The volcano remains at alert status 3 for now. The public is admonished to monitor the news for the latest updates about the volcano and a 2.5 kilometer exclusion zone remains in effect around the volcano’s parameter. –ROL  (translated)
  Current Emergencies
14 26.04.2012 Volcano Activity Mexico State of Puebla, [Popocatepetl Volcano] Damage level Photo available!

***********************************************************************************************************

Extreme Temperatures/ Weather

Short Time Event(s)
Upd. Date (UTC) Event Country Location Level Details


  26.04.2012 Forest / Wild Fire China Province of Yunnan, [Near to Luohe Village] Damage level Details

Freeze Warning

BINGHAMTON NY
TWIN CITIES/CHANHASSEN MN
GRAND FORKS ND
LA CROSSE WI
STATE COLLEGE PA
TAUNTON MA
WILMINGTON OH
CLEVELAND OH
BURLINGTON VT
NEW YORK NY
INDIANAPOLIS IN
GRAND RAPIDS MI
MOUNT HOLLY NJ
ALBANY NY
DETROIT/PONTIAC MI
GREEN BAY WI
CHICAGO IL
 BALTIMORE MD/WASHINGTON DC

Hard Freeze Warning

NORTHERN INDIANA

***********************************************************************************************************

Storms, Flooding

  Current Emergencies
Upd. Date (UTC) Event Country Location Level Details
  26.04.2012 Flash Flood MultiCountries [Haiti and Dominican Republic] Damage level Details

Winter Storm Warning

 GREAT FALLS MT

High Wind Warning

RIVERTON WY
CHEYENNE WY
 ALBUQUERQUE NM

Flood Warning

SPOKANE, WA
MISSOULA MT
BLACKSBURG VA
BOISE ID
PENDLETON OR
LAKE CHARLES LA
POCATELLO ID

************************************************************************************************************

Radiation

Senior Scholar, Institute for Policy Studies

The Fukushima Nuclear Disaster Is Far From Over

Spent reactor fuel, containing roughly 85 times more long-lived radioactivity than released at Chernobyl, still sits in pools vulnerable to earthquakes.

More than a year after the Fukushima nuclear power disaster began, the news media is just beginning to grasp that the dangers to Japan and the rest of the world are far from over. After repeated warnings by former senior Japanese officials, nuclear experts, and now a U.S. senator, it’s sinking in that the irradiated nuclear fuel stored in spent fuel pools amidst the reactor ruins pose far greater dangers than the molten cores. This is why:

• Nearly all of the 10,893 spent fuel assemblies sit in pools vulnerable to future earthquakes, with roughly 85 times more long-lived radioactivity than released at Chernobyl

• Several pools are 100 feet above the ground and are completely open to the atmosphere because the reactor buildings were demolished by explosions. The pools could possibly topple or collapse from structural damage coupled with another powerful earthquake.

• The loss of water exposing the spent fuel will result in overheating and can cause melting and ignite its zirconium metal cladding resulting in a fire that could deposit large amounts of radioactive materials over hundreds, if not thousands of miles.

This was not lost on Senator Ron Wyden (D-OR), who after visiting the site on April 6, wrote to Japan’s U.S. ambassador, Ichiro Fujusaki, that “loss of containment in any of these pools… could result an even larger release of radiation than the nuclear accident.”

The urgency of the situation is underscored by the ongoing seismic activity where 13 earthquakes of magnitude 4.0-5.7 have occurred off the northeast coast of Japan between April 14 and 17. This has been the norm since the first quake and tsunami hit the Dai-Ichi site on March 11 of last year. Larger quakes are expected closer to the power plant.

Read Full Article Here

Chernobyl in Fukushima’s shadow – nuclear energy today and in the future

ingress_image

This photo taken in the abandoned town of Pripyat, which was formerly populated by Chernobyl workers, begs the question of what nuclear power’s foggy future means to generations to come.

Twenty-six years has passed since the Chernobyl catastrophe. And although Fukushima has somewhat eclipsed Chernobyl, the memory of the late Soviet period disaster remains a living memory to many people, especially specialists among whom, as before, there is no consensus on the present and future of nuclear energy. Aleksandr Nikitin, 26/04-2012 – Translated by Charles Digges

Today, there is great distrust of the safety of nuclear power plants has is seen worldwide. First Chernobyl then Fukushima forced a whole array of countries to reassess their attitude toward nuclear power. There have been no new nuclear plants built in the United States over the past 26 years. Now Germany, Switzerland, and Belgium will be shuttering their reactors. Spain is in the process of electing not building any new nuclear reactors, and Italy decided not to begin a nuclear energy industry at all.  In post-Fukushima Japan, only one reactor out of the country’s 54 is still running. The future of nuclear energy there is especially foggy as the wrecked reactors at Fukushima are in such a condition that they “temporarily or partially” re-achieve criticality – in other words, the emergency is not over. According to expert analysis, more than 30years will be required to fully dismantle Fukushima.

The list of those casting a suspicious eye on nuclear power goes on: In March this year, Bulgaria decided to stop construction of it’s Belene Nuclear Power Plant despite the financial losses it would incur. This is the first instance that an active international contract for the construction of a nuclear power plant has been dissolved. Mexico is putting of the construction of 10 nuclear reactors in favor of developing natural gas power plants. The Lithuanian Seimas, or parliament, is deciding to put to a popular referendum on October 12 the construction of the Visaginas nuclear power plant. India is experiencing difficulties in launching its Kudankulam Nuclear Power Plant because of months of thousands-strong protests by local residents demanding its closure in the seismically active area.

It would also seem that the huge expenses of accident clean up and compensation to victims of the Fukushima disaster, which currently however somewhere around $245 billion, is influencing the mood pro-nuclear countries as well. In France, which relies on nuclear for 78 percent of its energy, Nikolai Sarkozy’s opponent from the socialist party, François Hollande – who in current opinion polls is surpassing the incumbent – has suggested cutting France’s reliance on nuclear power by a third by 2025, that is to say to 50 percent of the country’s energy. The fate of nuclear power in the world’s most atomically power country in the world is therefore be decided after the run off round of presidential elections on May 6 (as Sarkozy failed to capture the majority in the first round of balloting on April 22). And China, which wants to shake its large dependence on coal fired plants, and is building more nuclear power plants than anyone else, has begun to invest huge resources in renewable energy, seeing this energy source’s future.

World financial markets have also reacted world situation with nuclear power. Bank Austria, which is a subsidiary of the Italian UniCredit, has cut off a credit line it previously issued to a Slovak company that is building Reactor Units 3 and 4 at Mochovce in Slovakia. European energy giants RWE and E.On have declared that they no longer want to be involved in building new nuclear power plants in Great Britain.  Private companies are exiting the nuclear market as well. Of special resonance was the decision by Germany’s engineering-giant Siemens to pull out of nuclear power reactor and product production. Uranium markets went into a slump after Fukushima. Because of this, Russian State nuclear corporation Rosatom was unable to complete a deal to acquire 100 percent of the shares in Austria’s Mantra Resources Limited, which mines uranium in Tanzania.

Nuclear power cannot survive in a market economy. And for that reason, no country based on a market economy has built a single nuclear power plant since the Chernobyl disaster. Nuclear Energy requires large scale government support. The nuclear power plants in Russia and China belong to the state. Until 2004, the French government entirely owned Electricité de France, which operated every nuclear power plant in the country. Even today, though, even more than 80 percent of the company’s shares belong to the government.

Read Full Article Here

Construction of Chernobyl shelter starts on anniversary

by Staff Writers
Chernobyl, Ukraine (AFP) April 26, 2012

Ukraine launched Thursday construction of a new shelter to permanently secure the stricken Chernobyl plant as it marked the 26th anniversary of the world’s worst nuclear disaster.

President Viktor Yanukovych pressed a symbolic button at the construction site, watched by workers and ambassadors from countries including China and Japan that contributed to the huge project, expected to cost 1.5 billion euros.

“In the name of Ukraine, I express my deep thanks to all the donor countries to the Chernobyl Shelter Fund for their understanding and effective aid to our country in overcoming the consequences of the worst man-made disaster in human history,” Yanukovych said, as cranes loomed over the site.

“We have felt that the whole world has come to help us.”

An explosion during testing at the power plant in the early hours of April 26, 1986, sent radioactive fallout into the atmosphere that spread across Europe, particularly contaminating Belarus, Ukraine and Russia.

An international drive has raised funds from governments towards building a new permanent covering to slide over a temporary concrete-and-steel shelter that was hastily erected after the disaster and has since developed cracks.

The 20,000-tonne arched structure that spans 257 metres, known as the New Safe Confinement, is designed to last for a century, and will contain hi-tech equipment to carry out safe decontamination work inside the ruined reactor.

“This construction in its scale has no equals in the world,” Yanukovych said.

The construction of the shelter is expected to cost 990 million euros and to be put in place in 2015, while the decontamination work on the site will push the total cost up to 1.5 billion euros ($2 billion).

Yanukovych said in his speech at the site that “the completion of this project will guarantee the environmental safety of all the surrounding land and make it impossible for radiation to reach the atmosphere.”

Chernobyl is only around 100 kilometres (60 miles) from Kiev and lies close to the borders with Russia and Belarus. The area around the plant is still very contaminated and is designated as a depopulated “exclusion zone.”

International donors have so far agreed to contribute 550 million euros ($730 million) to the project, with the balance coming from the European Bank of Reconstruction and Development.

As the president visited the site, some 1,000 Chernobyl clean-up workers rallied in Kiev over cuts to their benefits in the latest of a string of angry protests over the austerity measure, the Interfax news agency reported.

The Soviet Union ordered thousands of people to take part in the clean-up in Ukraine following the Chernobyl accident, working without adequate protection.

Although only two people were killed in the initial explosions, the United Nations atomic agency says that 28 rescue workers died of radiation sickness in the first three months after the accident.

According to Ukrainian official figures, more than 25,000 of the cleanup workers, known as “liquidators” from then-Soviet Ukraine, Russia and Belarus have died since the disaster.

Ukraine on Thursday announced that it was awarding state honours to more than 40 of the liquidators and Yanukovych laid flowers and held a minute’s silence at a memorial at the power station.

On Thursday, relatives of victims held a remembrance ceremony in front of a memorial in Kiev as soldiers in dress uniform stood guard. Chernobyl veterans also attended a memorial ceremony in Minsk.

In neighbouring Belarus which also suffered from Chernobyl’s nuclear fallout about 2,000 supporters of the former Soviet republic’s opposition took to the streets to commemorate the disaster and denounce political repression.

Demonstrators brandished banners saying “We are suffering from Chernobyl”, “There’s no such thing as civilian nuclear energy”, and “No to nuclear power plants in Belarus”.

Other demonstrators shouted anti-regime slogans such as “Freedom to political prisoners”.

photo-zzh-am/ma/gk/db

Related Links
Bringing Order To A World Of Disasters
A world of storm and tempest
When the Earth Quakes

Audit Finds Broken EPA Radiation Monitors Broken And Unmaintained

  Posted by – April 24, 2012 at 2:53 pm – Permalink Source via Alexander Higgins Blog

Audit Finds Broken EPA Radiation Monitoring System Needs Attention

Despite being designated as critical infrastructure in the War on Terror a government audit reveals  a system of broken and unmaintained EPA RADNET radiation monitors.

As many of my regular readers already know, I compiled an application that displays radiation readings for every US city being under surveillance by the Federal government’s EPA RADNET monitors.

As many have repeatedly noticed for over a year, and as previously reported,  the graphs often display no information for certain cities as the EPA data set is empty for those locations.

We now get official confirmation from a Federal Audit performed by the Office of the Inspector General on the status of the network.

The audit has found a system of broken and unmaintained monitors being neglected by the EPA despite the fact the agency has secured tens of millions of dollars of Taxpayer money to keep the system up and running.

The system has been designated as critical infrastructure that is vital to our national security as part of the War on Terror and move over the federal government has reassured the public that the system would be used to assure the levels of radiation falling on the United States from the Fukushima nuclear fallout did not reach harmful levels.

Read Full Article Here

Short Time Event(s)

Today Nuclear Event USA State of Wisconsin, [Point Beach Nuclear Plant] Damage level Details

Generator testing leads to alert at Wisconsin nuclear power plant

The Point Beach nuclear power plant issued an alert after exhaust from a generator created increased carbon monoxide levels in its turbine building.

By: Associated Press report, Associated Press

TWO RIVERS, Wis. — The Point Beach nuclear power plant issued an alert after exhaust from a generator created increased carbon monoxide levels in its turbine building.

Its owner and operator, NextEra Energy Resources, says there was no impact on the operation of the plant or the safety of employees or the public. The state’s Emergency Operations Center was activated after the plant issued an alert at about 9 p.m. Wednesday.

NextEra spokeswoman Sara Cassidy said exhaust from diesel generators being tested by workers on the non-nuclear side of the plant seeped into an adjacent room where carbon monoxide was detected. Cassidy said the room was ventilated and readings returned to normal.

The Point Beach plant is located on the shore of Lake Michigan in Manitowoc County.

************************************************************************************************************

Climate Change

Cut world population and redistribute resources, expert urges

Nuclear disaster or plague likely unless population shrinks and natural resources are reassigned to poor, says Prof Paul Ehrlich

Image of Paul R. Ehrlich

Paul Ehrlich says we face ‘catastrophic or slow motion’ disasters unless population is brought under control and resources redistributed. Photograph: Rex Features

The world’s most renowned population analyst has called for a massive reduction in the number of humans and for natural resources to be redistributed from the rich to the poor.

Paul Ehrlich, Bing professor of population studies at Stanford University in California and author of the best-selling Population Bomb book in 1968, goes much further than the Royal Society in London which this morning said that physical numbers were as important as the amount of natural resources consumed.

The optimum population of Earth – enough to guarantee the minimal physical ingredients of a decent life to everyone – was 1.5 to 2 billion people rather than the 7 billion who are alive today or the 9 billion expected in 2050, said Ehrlich in an interview with the Guardian.

“How many you support depends on lifestyles. We came up with 1.5 to 2 billion because you can have big active cities and wilderness. If you want a battery chicken world where everyone has minimum space and food and everyone is kept just about alive you might be able to support in the long term about 4 or 5 billion people. But you already have 7 billion. So we have to humanely and as rapidly as possible move to population shrinkage.”

Read Full Article Here

Listen to Interview  Here

Warm ocean currents behind majority of ice loss from Antarctica

Apr 26, 3:02 pm

London, April 26 (ANI): Warm ocean currents attacking the underside of ice shelves are the dominant cause of recent ice loss from Antarctica, researchers have claimed.

The finding brings scientists a step closer to providing reliable projections of future sea level rise.

An international team of scientists used a combination of satellite measurements and models to differentiate between the two known causes of melting ice shelves: warm ocean currents thawing the underbelly of the floating extensions of ice sheets and warm air melting them from above.

The researchers concluded that 20 of the 54 ice shelves studied are being melted by warm ocean currents. Most of these are in West Antarctica, where inland glaciers flowing down to the coast and feeding into these thinning ice shelves have accelerated, draining more ice into the sea and contributing to sea-level rise.

This ocean-driven thinning is responsible for the most widespread and rapid ice losses in West Antarctica, and for the majority of Antarctic ice sheet loss during the study period.

“We can lose an awful lot of ice to the sea without ever having summers warm enough to make the snow on top of the glaciers melt. The oceans can do all the work from below,” said the study’s lead author Hamish Pritchard of the British Antarctic Survey in Cambridge, United Kingdom.

Read Full Article Here

************************************************************************************************************

Solar Activity

2MIN News Apr26: NASA, Magnetic Storm

Published on Apr 26, 2012 by

************************************************************************************************************

Epidemic

Rio declares dengue epidemic

by Staff Writers
Rio De Janeiro (AFP) April 25, 2012

Rio de Janeiro has declared a dengue epidemic after diagnosing more than 50,000 cases of the tropical mosquito-borne infection this year and over 500 in the last week alone.

“We have a plan focused on the epidemic and we continue to be in a state of alert,” Hans Dohmann, the city’s health secretary, said late Tuesday, adding that the number of cases had surpassed 300 per 100,000 residents per month.

State-run Agencia Brasil meanwhile reported that 517 people had been struck with the disease last week alone.

The state of Rio de Janeiro has reported a total of 64,423 confirmed cases thus far this year, with 13 deaths, 12 in the city itself.

Last year authorities recorded 168,242 cases and 140 deaths.

Dengue is caused by any one of four viruses transmitted by Aedes aegypti mosquitoes.

Symptoms include high fever, severe headaches, pain behind the eyes, skin rash and mild bleeding. In its advanced stage the disease causes hemorrhages.

The World Health Organization estimates there are 50-100 million dengue infections worldwide each year.

Related Links
Epidemics on Earth – Bird Flu, HIV/AIDS, Ebola

Climate right for Asian mosquito to spread in N. Europe

by Staff Writers
Paris (AFP) April 25, 2012

The climate in northwestern Europe and the Balkans is becoming suitable for the Asian tiger mosquito, a disease-spreading invasive species, scientists said on Wednesday.

The warning comes from scientists at the University of Liverpool, northwestern England, who say the two regions have been having progressively milder winters and warmer summers.

These temperate conditions favour the mosquito, which gained a foothold in Albania in 1979 and is now present in more than 15 countries on Europe’s southern rim.

“Over the last two decades, climate conditions have become more suitable over central northwestern Europe — Benelux, western Germany — and the Balkans,” they said.

At the same time, drier conditions in southern Spain have made that region less welcoming for the insect, they said.

The Asian tiger mosquito (Aedes albopictus), a native of tropical and subtropical areas of Southeast Asia, can transmit viruses that cause West Nile fever, yellow fever, dengue, St. Louis and Japanese encephalitis and other diseases.

In 2005-6, it caused an epidemic of chikungunya, a disease that attacks the joints, on the French Indian Ocean island of Reunion.

A year later, it unleashed an outbreak of chikungyuna in the Italian province of Ravenna. In 2010, it was fingered as a transmitter of dengue virus in France and Croatia.

As of last December, the mosquito was present in more than 15 countries, from southern Spain to parts of Greece and Turkey, according to the European Centre for Disease Prevention and Control (ECDC).

Reporting in Britain’s Journal of the Royal Society Interface, the Liverpool team looked at European weather records for 1950-2009 and ran a widely-used computer model to simulate weather trends for 2030-2050.

“Similar trends are likely in the future with an increased risk simulated over northern Europe and slightly decreased risk over southern Europe,” says the study.

“These distribution shifts are related to wetter and warmer conditions favouring the overwintering of A. albopictus in the north, and drier and warmer summers that might limit its southward expansion.”

The paper points out that weather alone does not mean that the species will automatically spread there.

It also notes that the study did not consider vegetation or soil types which also determine whether the mosquito would be able to breed there. In addition, cold snaps or hot, dry spell also help limit mosquito survival, and these too were not included in the investigation.

In the mid-1960s, the Asian tiger mosquito was limited to some parts of Asia, India and a handful of Pacific islands.

It has since spread to North and South America, the Caribbean, Africa and the Middle East, as well as Europe, mainly by hitchhiking a ride in exported materials.

Related Links
Epidemics on Earth – Bird Flu, HIV/AIDS, Ebola

Current Emergencies

1 19.04.2012 Biological Hazard China Ningxia Autonomous region, [Touying township] Damage level Details 3 24.04.2012 Epidemic Hazard Vietnam Province of Quang Ngai, [Son Ky Commune] Damage level Details

Short Time Event(s)

Today Biological Hazard USA State of Oklahoma, Oklahoma City Damage level Details

Short Time Event(s)

Today Biological Hazard Australia State of Tasmania, [Port Esperance, Hastings Bay (Southport) and the coastline between] Damage level Details

Short Time Event(s)

26.04.2012 Biological Hazard Thailand Province of Ang Thong, [Chamlong in Sawangha district] Damage level Details

**************************************************************************************************************

Articles of Interest

Diversity aided mammals’ survival over deep time

by Staff Writers
Nashville, TN (SPX) Apr 25, 2012


Mammals have demonstrated the ability to dramatically alter their size and completely change their diet when their environment is altered.

When it comes to adapting to climate change, diversity is the mammal’s best defense. That is one of the conclusions of the first study of how mammals in North America adapted to climate change in “deep time” – a period of 56 million years beginning with the Eocene and ending 12,000 years ago with the terminal Pleistocene extinction when mammoths, saber-toothed tigers, giant sloths and most of the other “megafauna” on the continent disappeared.

“Before we can predict how mammals will respond to climate change in the future, we need to understand how they responded to climate change in the past,” said Larisa R. G. DeSantis, the assistant professor of earth and environmental studies at Vanderbilt who directed the study. “It is particularly important to establish a baseline that shows how they adapted before humans came on the scene to complicate the picture.”

Establishing such a baseline is particularly important for mammals because their ability to adapt to environmental changes makes it difficult to predict how they will respond. For example, mammals have demonstrated the ability to dramatically alter their size and completely change their diet when their environment is altered.

In addition, mammals have the mobility to move as the environment shifts. And their ability to internally regulate their temperature gives them more flexibility than cold-blooded organisms like reptiles.

The study, which was published on Apr. 23 in the journal PLoS ONE, tracked the waxing and waning of the range and diversity of families of mammals that inhabited the continental United States during this extended period. In taxonomy, species are groups of individuals with common characteristics that (usually) can mate; genera are groups of species that are related or structurally similar and families are collections of genera with common attributes.

Scientists consider the fossil record of mammals in the U.S. for the study period to be reasonably complete. However, it is frequently impossible to distinguish between closely related species based on their fossil remains and it can even be difficult to tell members of different genera apart.

Therefore the researchers performed the analysis at the family level. They analyzed 35 different families, such as Bovidae (bison, sheep, antelopes); Cricetidae (rats, mice, hamsters, voles); Equidae (horses, donkeys); Ursidae (bears); Mammutidae (mammoths); and Leporidae (rabbits and hares).

The study found that the relative range and distribution of mammalian families remained strikingly consistent throughout major climate changes over the past 56 million years.

This period began with an extremely hot climate, with a global temperature about six degrees hotter than today (too hot for ice to survive even at the poles) and gradually cooled down to levels only slightly higher than today. It was followed by a dramatic temperature drop and a similarly abrupt warming and finished off with the Ice Ages that alternated between relatively cold glacial and warm interglacial periods.

“These data clearly show that most families were extremely resilient to climate and environmental change over deep time,” DeSantis said.

Horses were consistently the most widely distributed family from the Eocene to the Pliocene (and remained highly dominant, just not number one, in the Pleistocene). In contrast, families with more restricted ranges maintained lower range areas.

Thus, their work demonstrates that mammals maintained similar niches through deep time and is consistent with the idea that family members may inherit their ranges from ancestral species. The idea that niches are conserved over time is a fundamental assumption of models that predict current responses of mammals to climate change.

The analysis also found a link between a family’s diversity and its range: Family’s with the greater diversity were more stable and had larger ranges than less diverse families.

“Diversity is good. The more species a family has that fill different niches, the greater its ability to maintain larger ranges regardless of climate change,” said DeSantis.

While most families during certain periods of time yielded either gains in species/genera (e.g., Oligocene to Miocene) or losses (Miocene to Pliocene), these changes were remarkably consistent through time with overall gains or losses in one genera typically yielding a gain or loss in of about two species.

Although the extent of family ranges remained relatively constant, the study found that these ranges moved south and east from the Eocene to the Pleistocene. That is most likely a response to the general climate cooling that took place during the period. However, southeastern movement of ranges from the Pliocene to the Pleistocene may also be complicated by the influx of South American animals when the Isthmus of Panama was formed.

This triggered a tremendous exchange of species that has been labeled “The Great American Interchange.” As a result, some of the southern movement of families’ ranges may have been due to the influx of South American mammals, like the sloth and armadillo, moving north, the researchers cautioned.

The study also looked for evidence that families containing megafauna or other species that went extinct during the terminal Pleistocene extinction (also known as the Quaternary or Ice Age extinction) might have been in decline beforehand, but failed to find any evidence for any such “extinction prone” families. If climate change was the culprit, DeSantis and her team expect to see differences between families containing megafauna and those composed of smaller animals. However, the fact that they didn’t find such evidence cannot completely rule out this possibility.

The role that diversity plays in mammalian adaptation is particularly important because mammal species have been going extinct in record numbers for the past 400 years. In a 2008 report, the International Union for the Conservation of Nature predicted that one in four species of land mammals in the world faces extinction. As a result, the diversity of mammalian families is declining at a time when they need it the most to cope with a rapidly changing climate.

Co-authors on the paper were graduate students Rachel A. Beavins Tracy, Cassandra S. Koontz, John C. Roseberry and Matthew C. Velasco. The project was supported by funds from Vanderbilt University.

Related Links
Vanderbilt University
Explore The Early Earth at TerraDaily.com

GPS could speed up tsunami alert systems: researchers

by Staff Writers
Vienna (AFP) April 25, 2012

Global positioning systems (GPS) could provide faster tsunami alerts than current warning set-ups, German researchers said Wednesday, citing data collected in last year’s deadly Japan earthquake.

“On the occasion of the Fukushima earthquake, we analysed data from more than 500 GPS stations and showed that a correct estimate of the magnitude of 9.0 and of the generated tsunami could have been possible in just three to four minutes after the earthquake,” Andrey Babeyko, a scientist from the German Research Centre for Geosciences (GFZ) in Potsdam, said in a statement.

This “shows again what potential a GPS shield has in tsunami early warning systems,” he added.

The findings were presented at a week-long conference of the European Geosciences Union in Vienna.

If an earthquake occurs near the coast, it can take just 20-30 minutes before a resulting tsunami hits land, but GPS measurements taken almost while the earthquake is still happening would enable a faster assessment of its scale, the researchers said.

Traditional measuring methods require more time to provide an accurate picture, often underestimating the magnitude of a quake at first, they added.

In the case of last year’s earthquake in Japan, the authorities became aware of its scale only 20 minutes after the event, possibly leading to many more casualties than if a warning had gone out earlier, according to GFZ.

Some 19,000 people died when a 9.0-magnitude earthquake off the northeastern coast of Japan on March 11, 2011 triggered a tsunami and a meltdown at the Fukushima nuclear plant.

Related Links
Bringing Order To A World Of Disasters
When the Earth Quakes
A world of storm and tempest

*************************************************************************************************************

[In accordance with Title 17 U.S.C. Section 107, this material is distributed without profit, for research and/or educational purposes. This constitutes ‘FAIR USE’ of any such copyrighted material.]

Earthquakes


EMSC Dodecanese Islands, Greece
Apr 10 06:01 AM
4.0 30.0 MAP

USGS Offshore Northern California
Apr 10 05:43 AM
2.9 10.6 MAP

EMSC North Of Ascension Island
Apr 10 05:09 AM
5.8 33.0 MAP

GEOFON North Of Ascension Island
Apr 10 05:09 AM
5.4 10.0 MAP

USGS North Of Ascension Island
Apr 10 05:09 AM
5.8 9.9 MAP

USGS Washington
Apr 10 04:43 AM
3.2 11.0 MAP

EMSC Dodecanese Islands, Greece
Apr 10 04:34 AM
2.6 12.0 MAP

EMSC Western Turkey
Apr 10 04:19 AM
2.7 8.0 MAP

EMSC Western Turkey
Apr 10 04:13 AM
2.9 3.0 MAP

EMSC Eastern Turkey
Apr 10 04:11 AM
3.0 10.0 MAP

GEOFON Northern Mid Atlantic Ridge
Apr 10 03:37 AM
4.5 10.0 MAP

EMSC Northern Mid-atlantic Ridge
Apr 10 03:37 AM
4.6 10.0 MAP

USGS Northern Mid-atlantic Ridge
Apr 10 03:37 AM
4.7 10.4 MAP

EMSC Near East Coast Of Honshu, Japan
Apr 10 02:57 AM
4.8 55.0 MAP

GEOFON Near East Coast Of Honshu, Japan
Apr 10 02:57 AM
4.7 60.0 MAP

EMSC Spain
Apr 10 01:54 AM
2.9 10.0 MAP

EMSC Carlsberg Ridge
Apr 10 01:42 AM
4.7 30.0 MAP

USGS Carlsberg Ridge
Apr 10 01:42 AM
4.8 15.2 MAP

GEOFON Carlsberg Ridge
Apr 10 01:42 AM
4.6 10.0 MAP

EMSC Eastern Turkey
Apr 10 01:16 AM
3.0 5.0 MAP

USGS Northern California
Apr 10 01:09 AM
2.7 1.2 MAP

EMSC Eastern Turkey
Apr 10 00:02 AM
2.5 12.0 MAP


Swarm of small earthquakes hit Mt. Rose area


A series of small earthquakes over the weekend in the area between Mt. Rose and Incline Village is nothing out of the norm, a seismologist for the University of Nevada, Reno said Monday.

More than a dozen small tremors registering between 1.0 and 1.9 on the Richter scale were recorded on Sunday, most taking place about 6 miles north of Incline Village. The quakes were so small, and at a depth that they likely weren’t felt.

“I wouldn’t consider this unusual,” said Diane Depolo, a seismologist with the UNR Seismological Lab. “These are pretty small, and depth-wise, they’re what we’d consider normal depth for that area.”

The quakes were about 8 to 12 kilometers deep. Depolo said it would normally take a quake of 2.5 to 3 to be felt at that depth.

Depolo said this cluster of quakes is different from those that affected the Verdi-Mogul area in past years because the Verdi-Mogul quakes were much shallower.

A 1.1 quake was registered in the Mt. Rose area on Monday morning.


************************************************************************************************


Volcanic Activity


Colombia issues Nevado del Ruiz volcano warning


BOGOTA (AFP) – Colombia on Sunday issued a warning for areas crossed by rivers that pass through the Nevado del Ruiz volcano area, amid heavy rains and concern that an eruption could be in the works.

Authorities issued a ‘red alert’ for rivers near the volcano in Caldas and Tolima departments ‘due to the change in the eruption threat and to heavy rains in the area,’ the national weather and environmental institute (IDEAM) said.

The volcano has been rumbling at a greater rate in recent days; its alert level was boosted on March 31.

On Saturday, the volcano’s activity was still unstable and it was emitting more gases, the National Geological Service said.


Ecuador: Increase in Seismic Activity of Tungurahua Volcano


Quito, Apr 9 (Prensa Latina) A new increase in the seismic activity of Tungurahua Volcano, in Ecuador, began early Monday with a constant sign of high energy tremor linked with ash emissions.

According to the report of the Geophysics Institute of the National Polytechnic School, the increase of the seismic activity in this crater started with a column of smoke that reached 3 kilometers high along with low intensity roaring and sounds.

The first explosions caused minor thunders or crashes due to the rolling of blocks through the side walls of the volcano.

Shortly after, the falling of black and fine ashes on populations in the south-southwest regions, such as Palitahua, Capil, and Toctes, was reported.

According to the last report, the area surrounding the volcano remains highly cloudy, and with seismic activity.


***********************************************************************************************


Extreme Temperatures/ Weather


National heat records shattered during March


Associated Press


It’s been so warm in the United States this year, especially in March, that national records weren’t just broken, they were deep-fried.

Temperatures in the lower 48 states were 8.6 degrees above normal for March and 6 degrees higher than average for the first three months of the year, according to calculations by the National Oceanic and Atmospheric Administration. That far exceeds the old records.

The magnitude of how unusual the year has been in the U.S. has alarmed some meteorologists who have warned about global warming. One climate scientist said it’s the weather equivalent of a baseball player on steroids, with old records obliterated.

“Everybody has this uneasy feeling. This is weird. This is not good,” said Jerry Meehl, a climate scientist who specializes in extreme weather at the National Center for Atmospheric Research in Boulder, Colo. “It’s a guilty pleasure. You’re out enjoying this nice March weather, but you know it’s not a good thing.”

It’s not just March…..


Read Full Article Here


Extreme weather in Sydney, Australia


-Heavy storm and rainfall in Australia damaged roofs of several houses.
-Power outage in several areas of Ryde, Lindfield, Killara, St Ives, Frenchs Forest and Turramurra.
-Australian Bureau of Meteorology issued a severe thunderstorm warning for Sydney, the Hunter region, the Mid North Coast, North West Slopes and Plains districts.


Massive Wildfire in Harford County, Maryland, USA


-Evacuation order issued to several houses across Harford county.
-100 firefighters controlled the fire which spread to more than 50 acres.
-People were allowed to return their homes after three hours.


***********************************************************************************************


Storms, Flooding


Natural Disasters List April 9, 2012-Flooding In Turner Falls, Oklahoma


Flooding in Turner Falls, Oklahoma

-More than 500 people evacuated from Turner Falls area after flooding caused by heavy rainfall.
-Evacuated people are taking shelter in Murray County Expo Center.
-Many flood affected people are from Texas.
-Power outage reported in several places.
-The National Weather Service hadn’t issued any weather watches or warnings in this area.
-Turner Falls is currently closed and expected to reopen when water levels are safe.
-No fatalities or injuries reported.
-In March, Norman and Oklahoma City were affected by Flash floods
Update
-About 600 people are living in evacuation centers.
-The American Red Cross is supporting the shelter in the evacuation center.
-Following officials, more storms are expected in Oklahoma this week.


Strong winds and sandstorm in Northern part of China


-National Meteorological Center (NMC) of China has issued a BLUE ALERT for different areas of Northern China.

-Strong winds and sandstorms are forecast over the next 24 hours in parts of Xinjiang Uygur autonomous region, Inner Mongolia autonomous region, Ningxia Hui autonomous region and the provinces of Gansu, Shaanxi and Shanxi.
-Last week Gansu province of China was hit by the biggest sandstorm in 2012


Flooding in Fiji Islands


-Schools in Western Division will resume classes from Tomorrow.
-Flood victims are currently living in 60 different evacuation centers. Click for detail report on Fiji floods


Flooding in Indonesia


-More than 900 people affected by flood last week are suffering from influenza and skin rashes.
-About 7,000 people were affected by flood which caused due to torrential rainfall.
-Following Indonesian Meteorology, Climatology and Geophysics Agency (BMKG), rainfall last week was a normal phenomenon during the transition period from the rainy to dry season


***********************************************************************************************


Radiation


Radioactive fluid leaks at French nuclear reactor


Radioactive cooling fluid leaked at a French nuclear reactor Thursday following two small fires, but the spillage was safely collected in special tanks, officials said.


A reactor at the power plant in Penly on the English Channel near the port of Dieppe shut down automatically after two small fires broke out Thursday, the plant’s operator EDF said.

Firefighters easily extinguished the blazes but a cooling pump was damaged, in turn causing a joint to leak radioactive water into collection tanks located inside the reactor building, EDF said.

The reactor continued to be cooled properly and teams were working to lower the water pressure, the company said.

EDF said the installation was secure, no one was injured, and there were “no consequences for the environment”…..


Read Full Article Here


California nuclear plant shut indefinitely amid hunt to find cause of problems


By the CNN Wire Staff


(CNN) — A large Southern California nuclear plant is out of commission indefinitely, and will remain so until there is an understanding of what caused problems at two of its generators and an effective plan to address the issues, the nation’s top nuclear regulator said Friday.

Gregory Jaczko, chairman of the U.S. Nuclear Regulatory Commission, refused to give a timetable as to when the San Onofre nuclear plant could resume operation. He said only that his agency had “set some firm conditions” as to when that could happen.

“We won’t make a decision (to approve the facility’s restart) unless we’re satisfied that public health and safety will be protected,” Jaczko told reporters. “They have to demonstrate to us that they understand the causes, and … that they have a plan to address them.”

The power plant has been shut down since this winter, when a small amount of radioactive gas escaped from a steam generator during a water leak. At the time, federal regulators said there was no threat to public health, though they could not identify how much gas leaked or exactly why it had happened.


Read Full Article Here


***********************************************************************************************


Climate Change


North Sea Gas Leak: Experts Assess Climate Impact of Ongoing Accident


Elizabeth Grossman, InsideClimate News:


“The French energy company Total estimates that its North Sea Elgin field gas well is leaking about 200,000 cubic meters of natural gas per day … If the gas continues escaping at that rate, and all of it reaches the atmosphere, it would approximate the annual global warming impact of 35,000 Americans. The gas is mostly methane, which is considered the second largest contributor to human-caused global warming after carbon dioxide.”


Read Full Article Here


***********************************************************************************************


SOLAR ACTIVITY


2MIN News Apr9: NASA, WW3, Extreme Weather, Solar/Planetary Update


***********************************************************************************************


Wildlife


Polar bears have symptoms of mystery disease: U.S. agency


(Reuters) – Symptoms of a mysterious disease that has killed scores of seals off Alaska and infected walruses are now showing up in polar bears, the U.S. Geological Survey (USGS) said on Friday.

Nine polar bears from the Beaufort Sea region near Barrow were found with patchy hair loss and oozing sores on their skin, similar to conditions found in diseased seals and walruses, the agency said in a statement.

Unlike the sickened seals and walruses, the affected polar bears seem otherwise healthy, said Tony DeGange, chief of the biology office for the USGS’s Alaska Science Center. There had been no deaths among polar bears, he said.

The nine affected bears were among the 33 that biologists have captured and sampled while doing routine studies on the Arctic coastline, DeGange said.


Read Full Article Here


[In accordance with Title 17 U.S.C. Section 107, this material is distributed without profit, for research and/or educational purposes. This constitutes ‘FAIR USE’ of any such copyrighted material.]

Earthquakes

EMSC Kepulauan Kai, Indonesia
Apr 03 23:42 PM
5.7 33.0 MAP

GEOFON Aru Islands Region, Indonesia
Apr 03 23:42 PM
5.4 10.0 MAP

USGS Kepulauan Kai, Indonesia
Apr 03 23:42 PM
5.7 10.1 MAP

USGS Southern Alaska
Apr 03 23:41 PM
3.4 185.2 MAP

USGS Alaska Peninsula
Apr 03 23:19 PM
2.9 79.7 MAP

EMSC Eastern Turkey
Apr 03 22:18 PM
2.8 5.0 MAP

USGS Virgin Islands Region
Apr 03 22:12 PM
2.9 53.2 MAP

USGS Philippine Islands Region
Apr 03 20:41 PM
4.7 109.3 MAP

EMSC Philippine Islands Region
Apr 03 20:41 PM
4.7 100.0 MAP

EMSC Albania
Apr 03 20:23 PM
2.5 1.0 MAP

EMSC Central Turkey
Apr 03 20:08 PM
2.8 2.0 MAP

EMSC Near The Coast Of Western Turkey
Apr 03 19:59 PM
3.0 2.0 MAP

EMSC Western Turkey
Apr 03 19:28 PM
2.5 7.0 MAP

USGS Mona Passage, Dominican Republic
Apr 03 19:24 PM
3.1 79.9 MAP

USGS Virginia
Apr 03 19:00 PM
2.5 6.3 MAP

USGS Virginia
Apr 03 19:00 PM
2.5 9.6 MAP

EMSC Turkey-iran Border Region
Apr 03 18:41 PM
2.9 5.0 MAP

EMSC Western Turkey
Apr 03 18:24 PM
2.7 5.0 MAP

EMSC Southern Italy
Apr 03 18:09 PM
2.7 11.0 MAP

EMSC Northern Sumatra, Indonesia
Apr 03 18:07 PM
4.5 14.0 MAP

USGS Northern Sumatra, Indonesia
Apr 03 18:07 PM
4.5 14.3 MAP

GEONET Canterbury
Apr 03 17:05 PM
3.8 15.0 MAP

USGS South Of Alaska
Apr 03 16:56 PM
2.5 21.1 MAP

USGS Baja California, Mexico
Apr 03 16:49 PM
2.7 10.0 MAP

USGS Virgin Islands Region
Apr 03 16:24 PM
3.7 8.0 MAP

USGS Virgin Islands Region
Apr 03 16:24 PM
4.0 5.0 MAP

USGS Southern Alaska
Apr 03 15:29 PM
2.6 139.8 MAP

GEOFON South Of Fiji Islands
Apr 03 15:21 PM
4.7 389.0 MAP

EMSC Eastern Turkey
Apr 03 15:20 PM
3.6 2.0 MAP

USGS Southern California
Apr 03 15:15 PM
3.5 1.9 MAP

EMSC Eastern Turkey
Apr 03 13:39 PM
3.2 8.0 MAP

EMSC Near Coast Of Nicaragua
Apr 03 13:08 PM
4.5 47.0 MAP

USGS Near The Coast Of Nicaragua
Apr 03 13:08 PM
4.5 47.2 MAP

GEOFON Near Coast Of Nicaragua
Apr 03 13:08 PM
4.2 56.0 MAP

EMSC Western Turkey
Apr 03 12:35 PM
2.5 13.0 MAP

USGS Near The East Coast Of Honshu, Japan
Apr 03 11:52 AM
5.0 28.1 MAP

EMSC Near East Coast Of Honshu, Japan
Apr 03 11:52 AM
5.0 28.0 MAP

GEOFON Near East Coast Of Honshu, Japan
Apr 03 11:52 AM
5.0 26.0 MAP

EMSC Kepulauan Barat Daya, Indonesia
Apr 03 11:27 AM
5.0 508.0 MAP

GEOFON Banda Sea
Apr 03 11:27 AM
5.0 480.0 MAP

USGS Kepulauan Barat Daya, Indonesia
Apr 03 11:26 AM
5.0 477.4 MAP

EMSC Western Turkey
Apr 03 11:02 AM
2.6 19.0 MAP

EMSC Eastern Turkey
Apr 03 10:52 AM
2.8 6.0 MAP

EMSC France
Apr 03 10:47 AM
2.7 2.0 MAP

USGS Southern California
Apr 03 10:45 AM
2.7 11.7 MAP

EMSC New Ireland Region, P.n.g.
Apr 03 10:42 AM
5.2 117.0 MAP

USGS New Ireland Region, Papua New Guinea
Apr 03 10:42 AM
5.1 109.5 MAP

GEOFON New Ireland Region, P.n.g.
Apr 03 10:42 AM
5.2 96.0 MAP

EMSC Western Turkey
Apr 03 09:41 AM
2.7 6.0 MAP

EMSC Western Turkey
Apr 03 09:29 AM
2.5 5.0 MAP

GEOFON Northern Peru
Apr 03 09:17 AM
4.6 10.0 MAP

USGS Northern Peru
Apr 03 09:17 AM
4.7 29.3 MAP

EMSC Northern Peru
Apr 03 09:17 AM
4.7 24.0 MAP

USGS Kodiak Island Region, Alaska
Apr 03 09:05 AM
2.5 42.9 MAP

USGS Alaska Peninsula
Apr 03 08:52 AM
2.8 101.1 MAP

EMSC Poland
Apr 03 08:13 AM
2.4 10.0 MAP

EMSC Dodecanese Islands, Greece
Apr 03 07:50 AM
2.4 15.0 MAP

USGS Southern California
Apr 03 07:46 AM
2.7 3.3 MAP

EMSC Albania
Apr 03 07:46 AM
2.5 15.0 MAP

EMSC Oklahoma
Apr 03 07:33 AM
4.0 5.0 MAP

USGS Oklahoma
Apr 03 07:33 AM
4.0 4.9 MAP

EMSC Tarapaca, Chile
Apr 03 07:25 AM
5.3 117.0 MAP

USGS Tarapaca, Chile
Apr 03 07:25 AM
5.2 117.0 MAP

GEOFON Northern Chile
Apr 03 07:25 AM
5.2 105.0 MAP

USGS New Ireland Region, Papua New Guinea
Apr 03 07:07 AM
4.8 112.9 MAP

EMSC New Ireland Region, P.n.g.
Apr 03 07:07 AM
4.8 113.0 MAP

EMSC Canary Islands, Spain Region
Apr 03 06:55 AM
2.5 12.0 MAP

EMSC Turkey-iran Border Region
Apr 03 06:07 AM
2.5 27.0 MAP

EMSC Central Turkey
Apr 03 05:48 AM
2.4 20.0 MAP

USGS Guerrero, Mexico
Apr 03 05:35 AM
4.7 42.8 MAP

EMSC Guerrero, Mexico
Apr 03 05:35 AM
4.8 40.0 MAP

GEOFON Near Coast Of Guerrero, Mexico
Apr 03 05:35 AM
4.6 10.0 MAP

EMSC Eastern Turkey
Apr 03 04:39 AM
2.9 8.0 MAP

EMSC Eastern Turkey
Apr 03 04:34 AM
3.0 5.0 MAP

EMSC Mindanao, Philippines
Apr 03 04:25 AM
5.1 80.0 MAP

USGS Mindanao, Philippines
Apr 03 04:25 AM
5.0 79.2 MAP

GEOFON Mindanao, Philippines
Apr 03 04:25 AM
5.1 10.0 MAP

EMSC Southern Iran
Apr 03 04:19 AM
3.5 26.0 MAP

EMSC Dodecanese Islands, Greece
Apr 03 03:59 AM
2.7 8.0 MAP

EMSC France
Apr 03 03:39 AM
2.7 5.0 MAP

EMSC Eastern Turkey
Apr 03 03:20 AM
2.6 2.0 MAP

GEOFON Near S. Coast Of Honshu, Japan
Apr 03 03:12 AM
4.7 96.0 MAP

EMSC Near S. Coast Of Honshu, Japan
Apr 03 03:12 AM
4.9 91.0 MAP

USGS Near The South Coast Of Honshu,
Japan Apr 03 03:12 AM
4.9 88.9 MAP

USGS Near The Coast Of Northern Peru
Apr 03 03:08 AM
5.4 74.5 MAP

EMSC Near Coast Of Northern Peru
Apr 03 03:08 AM
5.3 60.0 MAP

GEOFON Near Coast Of Northern Peru
Apr 03 03:08 AM
5.1 34.0 MAP

EMSC Switzerland
Apr 03 02:45 AM
2.5 5.0 MAP

GEOFON Eastern New Guinea Reg., P.n.g.
Apr 03 02:39 AM
5.0 10.0 MAP

USGS Northern California
Apr 03 02:38 AM
2.8 21.1 MAP I

EMSC Dodecanese Islands, Greece
Apr 03 02:18 AM
3.0 2.0 MAP

GEOFON Off Coast Of Central Chile
Apr 03 02:11 AM
5.1 52.0 MAP

EMSC Offshore Valparaiso, Chile
Apr 03 02:11 AM
5.1 20.0 MAP

USGS Offshore Valparaiso, Chile
Apr 03 02:11 AM
5.1 8.3 MAP

USGS Puerto Rico
Apr 03 02:03 AM
2.7 7.0 MAP

EMSC Eastern Turkey
Apr 03 01:35 AM
3.0 17.0 MAP

USGS Central Alaska
Apr 03 01:14 AM
2.9 132.1 MAP

USGS Southern Alaska
Apr 03 01:13 AM
3.1 86.0 MAP

USGS Puerto Rico Region
Apr 03 00:35 AM
2.7 5.7 MAP

EMSC Eastern Turkey
Apr 03 00:06 AM
2.6 5.0 MAP


Earthquake rattles southeast Oklahoma


PITTSBURG, Okla. – A magnitude 4.0 earthquake shook southeastern Oklahoma at 2:33 a.m. Tuesday.

According to the U.S. Geological Survey, the quake was centered near the town of Pittsburg, about 16 miles south-southwest of McAlester and 109 miles east-southeast of Oklahoma City.

McAlester police say no damage or injuries have been reported.

2NEWS viewers in Tulsa reported feeling the temblor.

The USGS says residents in Muskogee, Norman, Broken Arrow, Atoka and Shawnee also reported feeling tremors.

On Nov. 5, 2011, a record 5.6 magnitude tremor shook the Sooner state, the strongest quake on record in Oklahoma.

The USGS reported that tremors from the quake, centered in Lincoln County, were felt in most of Oklahoma as well as eastern and central Kansas, most of Missouri and Arkansas, north Texas and southeast Nebraska.


http://www.kjrh.com/video/videoplayer.swf?dppversion=18327


**************************************************************************************************


Volcanic Activity


Mantle Plume: El Hierro island struck by two small tremors


April 3, 2012 – CANARY ISLANDS – IRIN volcano 24 hour monitoring network of the National Geographic Institute (IGN) recorded two earthquakes of 1.7 and 2.7 magnitudes on the Richter scale this Sunday on the island of El Hierro. The largest of the earthquakes, recorded at 22.03 hours, occurred southwest of the town of El Pinar. This event was located at sea 15 kilometers deep. The second quake also occurred southwest of El Pinar at 20.36 hours, to 13 km depth and epicenter in the sea. Since last March 24, the island of El Hierro has been nine earthquakes, including this Sunday, between 1.5 and 2.7 °. Of these, were substantial enough to be felt by the population. Sunday’s tremors were located west of Frontier and southwest of El Pinar, and were 10 and 29 kilometers deep. –La Opinion.es (translated)


The Extinction Protocol


**************************************************************************************************


Radiation


L.A. Rain Radiation Over Five Times Normal


A whopping 506% above normal,


Uploaded by EnviroReporter on Mar 31, 2012

An imperfect storm swept into Southern California on, perhaps appropriately enough, April Fools weekend creating the conditions that tested EnviroReporter.com’s scientific hypothesis that radioactive “buckyballs” and other fission radionuclides from the triple Fukushima Japan meltdowns are already impacting the region. Sure enough, a rain composed primarily of sea mist formed over a choppy ocean with high winds tested higher than any other Los Angeles Basin rain since Radiation Station Santa Monica began fallout radiation tests March 15, 2011, four days after the unabated meltdowns began. The rain, not impacted by so-called “natural” radon progeny, came in at a whopping 506% above normal, more than high enough to qualify as a hazardous material situation for the California Highway Patrol. This is the hottest L.A. rain detected with our Inspector Alert nuclear radiation monitor in the over 1,500 radiation tests we’ve taken since last year’s Ides of March.


**************************************************************************************************


Storms, Flooding, Windstorms


Catastrophic damage in flood-stricken Fiji


By Campbell Cooney and staff


A massive clean-up operation is underway in Fiji after historic floods caused catastrophic damage in many towns.

While floodwater levels are dropping and some Fijians are returning home to investigate the damage, many remain in evacuation centres across the main island of Viti Levu.

Tropical Cyclone Daphne is moving away from Fiji, with the interim government announcing schools will reopen today.

There are concerns the floods, which killed five people over the weekend, will lead to outbreaks of disease.

The Australian Government says it is committed to supporting the country in its long-term recovery and reconstruction.

Foreign Minister Bob Carr says Australia is about to start sending practical relief, including 350,000 water purification tablets, water containers and thousands of tarpaulins, to help the people of Fiji.

Senator Carr says such supplies are badly needed.

“The most basic assistance is to see that people can drink the water – notwithstanding the terrible pollution from the floods – and that they can deliver the water,” he said.

“That means the water containers are going to be essential. And that they can haul those tarpaulins over damaged roofs – that’s the most basic assistance, drinking water and shelter.”


Read Full Article Here


Tropical Cyclone Daphne update


Ben Domensino,


Tropical Cyclone Daphne is moving rapidly southwards away from Fiji, although the risk of heavy rainfall and further flooding remains a threat.

At 10pm EST on Monday night, Daphne was located approximately 580 km south-southwest of Nadi. The category 1 tropical cyclone is travelling towards the southeast, away from Fiji at around 50 km/h.

The cyclone warning that was in place for Fiji has now been cancelled, however there is still at risk of flooding.

Heavy rainfall is likely to continue today due to a region of converging winds remaining near stationary over the main island of Vitu Levu, where Nadi is situated.


Read Full Article Here


Tornadoes rip through Dallas area, northeast Texas


Several tornadoes roared through the Dallas-Fort Worth region and across parts of northeastern Texas today, causing major damage and several injuries.

At least two “large and extremely dangerous” tornadoes ripped across the Dallas-Forth Worth area this afternoon, collapsing roofs, tearing down power lines and tossing trailers around like toys, the National Weather Service says.

Several other twisters were reported as violent storms moved northeast. Five people were reportedly hurt when a twister tore through a subdivision in Forney, northeast of Dallas.

The weather service says “considerable damage” has been reported near Cleburne, south of Fort Worth, and Lancaster, south of Dallas. Local television footage shows overturned and smashed semi-trailers on the ground in the southern portion of Dallas County. Dallas Police spokeswoman Sherri Jeffrey says twisters also have caused damage in the city limits.

A tornado watch — meaning that conditions are ripe for tornadoes to continue to form — was in place for 33 counties in north-central and northeastern Texas until 8 p.m. CT, the National Weather Service reported.

Photo of Twister

Photo of Damage

Tornado – Arlington, TX


Mother Nature’s Latest Attack on Japan: Strong Winds


By Eleanor Warnock


After a winter of record snow and avalanches — not to mention last year’s record strong quake, mega-tsunami, and series of powerful typhoons — Japan is once again being battered by the elements. This time, it’s wind.

A low-pressure system that landed on Japan’s main island of Honshu Tuesday has brought typhoon-force winds and rain, even snow. In anticipation of the worst of the storm, the Japan Meteorological Agency called an unusual emergency press conference Monday and issued a strong wind warning for Tokyo and neighboring Kanagawa and Chiba prefectures.

As of mid-day Tuesday, 203 flights were already grounded nationwide and the final game in the nationwide high school spring baseball tournament in Osaka had also been postponed. An 82-year-old woman supposedly died in Ishikawa prefecture after the wind toppled her on the street, according to local media reports.


Read Full Article Here


**************************************************************************************************


Solar Activity


2MIN News Apr3: World Updates, Solar Data back online!


**************************************************************************************************

Solar System


Tarek Niazi on Surrounded by Idiots


Uploaded by sunskymysteries on Feb 7, 2012

http://www.sunskymysteries.com

Tarek is the author of More Than 60 Minutes: When Earth Stands Still and like many other science based researchers around the world, has reached the conclusion that in fact we are seeing the approach of an extra-solar body towards the Earth.


***************************************************************************************************


Mysterious Booms / Rumblings

Exploding Kitchen Tiles, Ground SWELLING in Watertown, WI


Uploaded by Sheilaaliens on Mar 31, 2012

MAP: http://zeemaps.com/338668 Just south of, you guessed it, Clintonville. I almost completely missed this story o.o Glad i came across it. I’m working on a little map of WI Geological phenomena over the past two weeks, includes 4 towns so far. **UPDATE: hope you checked out mah mapz0r 😀

“WATERTOWN, Wis. — A Watertown school will reopen Wednesday after some exploding tiles forced classes to be canceled Tuesday.

Tiles in the cafeteria started to buckle and explode Monday at St. Henry’s Catholic School.

“And I looked at the tiles on the floor. (They) were raising up and flying across the kitchen floor. So, we got out of the cafeteria and told the kids to go up to their classrooms. Eventually, they were evacuated,” St. Henry’s Cooking Manager Diane Dannenberg said. “It looked like the movie ‘Tremors’ where something was tunneling underneath the floor.”

Some described exploding, but the floor definitely buckled.

The city’s building inspector said the part of the building affected was built in 1952. Investigators are looking at all sorts of possibilities to explain why these tiles lifted off the ground.

After 20 years as the city’s building inspector, Joe Heimsch said he was baffled after first looking at this basement.

“My hope is it’s some kind of sanitary line that was improperly abandoned, and it could have came up, and that would have caused the same type of effect,” Heimsch said. “The worst-case scenario is actual foundation movement. I’m hoping that’s not the case.”

Heimsch told 12 News Tuesday afternoon that there was nothing life-threatening or dangerous at the school, but lunches will definitely be affected, regardless of the buckling’s cause.

“If they return back, they’re going to be bringing bagged lunches. I’m afraid this kitchen will probably be down the rest of the year,” Heimsch said.

Hot lunches for St. Bernard Catholic School in Watertown are also affected.

Students will not have to make up the missed time because they didn’t have any snow days this year.”


source: http://www.wisn.com/r/30770975/detail.html


**************************************************************************************************

Articles of Interest

FEMA chief says agency bracing for ‘maximum’ disaster


By Eric Berger


Recent hurricanes Ike and Katrina may rank among the three costliest storms in U.S. history, but in preparing for disasters the federal government must think bigger still, says America’s top emergency planner.

“As devastating as those two hurricanes were, they’re not as bad as it gets,” said Craig Fugate, administrator of the Federal Emergency Management Agency.

Fugate told reporters Tuesday at the National Hurricane Conference in Orlando, Fla., that his agency has been preparing for realistic worst-case scenarios – not just natural disasters, such as hurricanes and earthquakes, but terrorist attacks, as well.


Read Full Article Here


Update: New Tornado Warning System Now Being Tested – KS, MO, IL – April 2012


Uploaded by Sheilaaliens on Apr 3, 2012


So are they going to adjust the warning system so not so many false alarms are called? Otherwise this is no way to fix it, it will only futher exaserbate the problem of residents not recognizing the tornado sirens as a warning to seek shelter. I hope this problem can be solved cause it’s a tough one. I mean, they are only human so they are numb to the sirens if 4 times out of 5 nothing comes of it. The brain learns to ignore it even without you realizing it.