A farmer tills a rice paddy field on the outskirts of Colombo, Sri Lanka (Reuters / Andrew Caballero-Reynolds)
A heretofore inexplicable fatal, chronic kidney disease that has affected poor farming regions around the globe may be linked to the use of biochemical giant Monsanto’s Roundup herbicide in areas with hard water, a new study has found.
The new study was published in the International Journal of Environmental Research and Public Health.
Researchers suggest that Roundup, or glyphosate, becomes highly toxic to the kidney once mixed with “hard” water or metals like arsenic and cadmium that often exist naturally in the soil or are added via fertilizer. Hard water contains metals like calcium, magnesium, strontium, and iron, among others. On its own, glyphosate is toxic, but not detrimental enough to eradicate kidney tissue.
The glyphosate molecule was patented as a herbicide by Monsanto in the early 1970s. The company soon brought glyphosate to market under the name “Roundup,” which is now the most commonly used herbicide in the world.
The hypothesis helps explain a global rash of the mysterious, fatal Chronic Kidney Disease of Unknown etiology (CKDu) that has been found in rice paddy regions of northern Sri Lanka, for example, or in El Salvador, where CKDu is the second leading cause of death among males.
Furthermore, the study’s findings explain many observations associated with the disease, including the linkage between the consumption of hard water and CKDu, as 96 percent of patients have been found to have consumed “hard or very hard water for at least five years, from wells that receive their supply from shallow regolith aquifers.”
Iraqi police with two suspects in Baghdad, 2010. Photograph: Loay Hameed/AP
In one of the fiery oratories for which he was well-known, the late Hugo Chávez once stated his belief that “the American empire is the greatest menace to our planet.” While his detractors have often sought to paint his rhetorical flourishes as a manifestation of unprovoked and unpopular extremism, to his death Chávez remained extremely popular with the majority of the Venezuelan people.
The primary theatre of war has since switched from Latin America to the Middle East, but many of the same tactics of that period – which caused so much devastation and engendered so much visceral anger – seem to have been redeployed on the other side of the world. As reported this week by the Guardian, recent investigations have suggested that Pentagon officials at the highest levels oversaw torture facilities during the war in Iraq. The allegations are decidedly gruesome: rooms used for interrogating detainees stained with blood; children tied into extreme stress positions with their bodies beaten to discoloration.
Most chillingly, a veteran of the United States’ “dirty war” in El Salvador was reported to have been brought in to personally oversee the interrogation facilities. As described by Iraqi officials this program was condoned at the highest levels of the US military and utilized “all means of torture to make the detainee confess … using electricity, hanging him upside down, pulling out their nails”. The alleged involvement of a senior participant of the American intervention in El Salvador is, indeed, particularly odious given the legacy of institutionalized torture and murder which characterized US military involvement in that country.
At the now infamous School of the Americas, thousands of Latin American “special forces” were explicitly trained in torture techniques by US handlers. Many of those SOA graduates took their new training home to El Salvador, where they waged a war that killed an estimated 80,000 Salvadoran civilians. Similar “trainees” were sent out in the thousands to kill and maim on behalf of US interests in wars from Honduras to Guatemala. In the latter alone, US-supported death squads murdered over 50,000 civilians suspected of holding sympathies with leftist rebels. The creation and patronage of locally trained militias to wreak havoc among subject populations in pursuit of American military objectives is a tactic that seems to have been adapted to the present day with great effect – most notably in Iraq.
On a summer night 2008, armed paramilitaries broke into Hassan Mahsan’s home in Baghdad’s Sadr City district and put a gun to his young daughter’s head. Demanding he reveal the location of a suspected insurgent, the men threatened to kill his daughter in front of the family before dragging Mahsan off for interrogation and telling his wife “he is finished”. The paramilitaries were members of the Iraqi Special Operations Forces (ISOF), an elite counterterrorism force referred to as “the dirty brigade”. Believed to be trained and guided by US military advisers at every level of its organizational hierarchy, the ISOF has been structured so as to place it outside the confines of normal oversight for such organizations. Operating today essentially as a private paramilitary force for Prime Minister Nouri al-Maliki, the ISOF has also been described as a “local ally” of the United States in the country – a euphemism for an asset utilized for covert special operations.
Second largest earthquake to hit Canada since 1949
Canadian Press
Map locates a violent earthquake measuring 7.7 which jolted British Columbia’s north-central coast Saturday night, frightening residents and forcing many to temporarily leave their homes for higher ground ahead of a possible tsunami.
Photograph by: Sean Vokey , Canadian Press
VANCOUVER — The Haida Gwaii region continues to feel the aftershocks of a violent earthquake measuring 7.7 that jolted British Columbia’s north-central coast Saturday night, frightening residents and forcing many to temporarily leave their homes for higher ground ahead of a possible tsunami.
The largest, a 6.4 magnitude tremor, struck Sunday afternoon, 136 kilometers south of Masset. There have been over 40 aftershocks in the area.
Tsunami warnings were issued for the North Coast Saturday, the Haida Gwaii islands, parts of the central B.C. coast, the coast of Alaska and as far away as Hawaii.
Early Sunday morning the warnings were downgraded to advisory status, meaning evacuations were no longer necessary, and they were cancelled altogether a few hours later.
Residents near the centre of the quake said the violent jolting lasted for up to a minute, but no injuries or major damage had been reported.
Carsten Ginsburg, who lives in the small community of Bella Coola southeast of Prince Rupert, said the quake lasted about 40 seconds.
“It shook everything. The electricity went out, the power lines were swinging all over the place and stuff was falling off the shelves.”
Brent Ward, an earth scientist at Simon Fraser University, said the earthquake was the second largest to hit the country since 1949, when another earthquake was recorded in the same area with a magnitude of 8.1.
“It’s an earthquake in an area that gets a lot of earthquakes,” he said. “It’s a tectonically active area.”
Ward said the area is known as the Queen Charlotte fault, where the earth’s plates slide horizontally across each other in a strike-slip action, similar to what happens along California’s San Andreas fault.
“Stresses build up because of that movement, and every so often we get the release of that stress in the form of an earthquake.”
Ward said he wasn’t surprised the tsunami warning was shortlived because the strike-slip movement along the fault doesn’t generally trigger tsunamis.
“To trigger a tsunami you need to have a vertical movement of the sea floor, and it’s that vertical movement that displaces water and triggers the tsunami,” he said. “Because it’s sliding across each other, you’re not generally moving the water.”
In fact, hours after the earthquake, Dennis Sinnott, who works at the Institute of Ocean Sciences, said the largest wave hit Langara Island, a northern Haida Gwaii island, and measured just 69 centimetres.
The quake also set off emergency sirens across the Pacific on the islands of Hawaii, but even as people were moving to higher ground, the warning was called off.
In Alaska, the wave surge was just 10 centimetres, much smaller than officials had been forecasting.
Kelli Kryzanowski, manager of strategic initiatives Emergency Management B.C., said the initial earthquake occurred at 8:04 p.m. inland on Haida Gwaii and was initially recorded at a magnitude of 7.1 but was quickly upgraded to a magnitude of 7.7.
Kryzanowski said small waves generated by the quake, measured at 28 centimetres and 44 centimetres, also hit the northern tip of Vancouver Island.
“What we’re seeing at this time are relatively small sea-level fluctuations,” she said.
B.C. Justice Minister Shirley Bond said there appeared to be little damage from the quake.
“We’re certainly grateful at this point,” said Bond, who spoke to reporters during a late night conference call. “We’re very grateful for that, but we’ll wait until we can actually see the impact.”
After the quake, Ginsburg said he ran home as quickly as he could to see if there was a tsunami warning.
“Which of course there was,” he added.
Ginsburg owns the Float House Inn on the public wharf in Bella Coola and had about six customers celebrating a birthday party.
They all evacuated to about 35 metres above sea level.
“I’m assuming that it’s OK,” he said laughing. “I’m keeping my fingers crossed.”
Bella Coola resident Barb Cornish, 60, said she considers herself a very calm person.
“But I found it quite unnerving,” she told The Canadian Press.
Cornish lives in a log house and had been told that it’s one of the safest places to be in the event of an earthquake.
But she said it sure didn’t feel safe Saturday night.
“The log house swayed and creaked and my light over my kitchen table was swaying, some chimes went off. I stood up and I could feel the undulations under my feet, to the point where I almost got nauseated.”
Geoff Ray said he has felt a lot of earthquakes, but this was the most powerful quake he’s ever experienced in the 37 years he’s lived on Haida Gwaii.
Ray operates the Breezeway Accommodations bed and breakfast in Queen Charlotte City and said the beams of his building were “visibly shaking quite a lot, there were things falling off shelves.”
“(It was) an exciting experience, there’s no doubt about that.”
Lenore Lawrence, a resident of Queen Charlotte City, said the quake was “definitely scary,” adding she wondered if “this could be the big one.”
She thought the shaking lasted more than a minute.
While several things fell off her mantle and broke, she said damage in her home was minimal.
Residents rushed out of their homes in Tofino when the tsunami sirens sounded, but they were allowed to return about two hours after the quake.
Yvette Drews, a resident of Tofino, said she ran out of her home with her two children and mother in-law and drove to a local school when she heard the community’s tsunami sirens go off.
They were told by police that they could return home.
But while on the way home, Drews said she heard the tsunami sirens go off again.
“Well that just freaked me out, hearing the siren and the voice,” she said.
The quake shook Vancouver Island, the Haida Gwaii area, Prince Rupert, Quesnel and Houston, and was even felt in Metro Vancouver and Alaska.
“It’s a good wake-up call for everyone to make sure they have an earthquake kit and a plan if an earthquake like this hits an area that they live,” said Ward.
VANCOUVER, British Columbia (AP) — A magnitude 7.7 earthquake struck off the west coast of Canada, but there were no reports of major damage. Residents in parts of British Columbia were evacuated, but the province appeared to escape the biggest quake in Canada since 1949 largely unscathed.
The U.S. Geological Survey said the powerful temblor hit the Queen Charlotte Islands just after 8 p.m. local time Saturday at a depth of about 3 miles (5 kilometers) and was centered 96 miles (155 kilometers) south of Masset, British Columbia. It was felt across a wide area in British Columbia, both on its Pacific islands and on the mainland.
“It looks like the damage and the risk are at a very low level,” said Shirley Bond, British Columbia’s minister responsible for emergency management said. “We’re certainly grateful.”
The National Weather Service issued a tsunami warning for coastal areas of British Columbia, southern Alaska and Hawaii, but later canceled it for the first two and downgraded it to an advisory for Hawaii.
Gerard Fryer, a senior geologist with the Pacific Tsunami Warning Center, said the first waves hitting shore in Hawaii were smaller than expected.
Hawaii Gov. Neil Abercrombie said early Sunday that the Aloha State was lucky to avoid more severe surges after the powerful earthquake struck off the coast of Canada. Abercrombie said beaches and harbors are still closed statewide.
“We’re very, very grateful that we can go home tonight counting our blessings,” Abercrombie said.
The weather service also canceled a tsunami advisory for Oregon, leaving northern California as the only spot in North America still under a tsunami advisory.
Dennis Sinnott of the Canadian Institute of Ocean Science said a 69-centimeter (27 inch) wave was recorded off Langara Island on the northeast tip of Haida Gwaii, formerly called the Queen Charlotte Islands. The islands are home to about 5,000 people, many of them members of the Haida aboriginal group. Another 55 centimeter (21 inch) wave hit Winter Harbour on the northeast coast of Vancouver Island.
“It appears to be settling down,” he said. “It does not mean we won’t get another small wave coming through.”
Canada’s largest earthquake since 1700 was an 8.1 magnitude quake on August 22, 1949 off the coast of British Columbia, according to the Canadian government’s Natural Resources website. It occurred on the Queen Charlotte Fault in what the department called Canada’s equivalent of the San Andreas Fault — the boundary between the Pacific and North American plates that runs underwater along the west coast of the Haida Gwaii.
In 1970 a 7.4 magnitude quake struck south of the Haida Gwaii.
The USGS said the temblor shook the waters around British Columbia and was followed by a 5.8 magnitude aftershock after several minutes. Several other aftershocks were reported.
The quake struck 25 miles (40 kilometers) south of Sandspit, British Columbia, on the Haida Gwaii archipelago. People in coastal areas were advised to move to higher ground.
Urs Thomas, operator of the Golden Spruce hotel in Port Clements said there was no warning before everything began moving inside and outside the hotel. He said it lasted about three minutes.
“It was a pretty good shock,” Thomas, 59, said. “I looked at my boat outside. It was rocking. Everything was moving. My truck was moving.”
After the initial jolt, Thomas began to check the hotel.
“The fixtures and everything were still swinging,” he said. “I had some picture frames coming down.”
Lenore Lawrence, a resident of Queen Charlotte City on the Haida Gwaii, said the quake was “definitely scary,” adding she wondered if “this could be the big one.” She said the shaking lasted more than a minute. While several things fell off her mantle and broke, she said damage in her home was minimal.
Many on the B.C. mainland said the same.
“I was sitting at my desk on my computer and everything just started to move. It was maybe 20 seconds,” said Joan Girbav, manager of Pacific Inn in Prince Rupert, British Columbia. “It’s very scary. I’ve lived here all my life and I’ve never felt that.”
Residents rushed out of their homes in Tofino, British Columbia on Vancouver Island when the tsunami sirens sounded, but they were allowed to return about two hours after the quake.
In Hawaii, the tsunami warning spurred residents to stock up on essentials at gas stations and grocery stores and sent tourists in beachside hotels to higher floors in their buildings. Bus service into Waikiki was cut off an hour before the first waves, and police in downtown Honolulu shut down a Halloween block party. In Kauai, three schools used as evacuation centers quickly filled to capacity.
Fryer said the largest wave in the first 45 minutes of the tsunami was measured in Maui at more than 5 feet (1.5 meters), about 2 feet (60 centimeters) higher than normal sea levels. No major damage was reported.
In Alaska, the wave or surge was recorded at 4 inches (10 centimeters), much smaller than forecast, said Jeremy Zidek, a spokesman for the Alaska Department of Homeland Security and Emergency Management. The quake was felt in Craig and other southeast Alaska communities, but Zidek said there were no immediate reports of damage.
Cars are seen on Ala Wai Blvd. in Honolulu’s Waikiki in Hawaii on Saturday before the arrival of the first tsunami waves.
STORY HIGHLIGHTS
NEW: the largest wave was about 2.5 feet above ambient sea level
NEW: Tsunami advisory lifted
Hawaii evacuations are lifted
The tsunami was caused by a magnitude 7.7 earthquake in western Canada
(CNN) — A tsunami warning for Hawaii, triggered by a powerful earthquake in Canada, proved nothing more than a pre-Halloween scare for thousands of people this weekend.
“The tourists are doing their best Chicken Little impressions,” one CNN iReporter in West Maui, Hawaii, wrote early Sunday.
Sirens announced the tsunami warning across Hawaii on Saturday night, as thousands of revelers packed streets in Honolulu for the annual Hallowbaloo festival and many others in costumes headed to Halloween parties.
Restaurants, clubs and the festival immediately shut down and the parties turned into bumper-to-bumper traffic jams as residents headed to higher ground.
Visions of the devastating quake and tsunami that killed thousands in Japan in March 2011 fueled the fright, but the waves proved to be smaller and less powerful than feared.
While the warning said waves could surge between 3 and 6 feet, the largest wave, measured in Kahului on the island of Maui, was about 2.5 feet above ambient sea level, according to Gerard Fryer, senior geophysicist at the Pacific Tsunami Warning Center.
The evacuation orders for coastal residents and the tsunami warning were canceled by 1 a.m. in Hawaii (7 a.m. ET) and a tsunami advisory was put in its place. That advisory was lifted three hours later.
Honolulu Mayor Peter Carlisle said early Sunday that people who had evacuated could return to their homes. CNN affiliate Hawaii News Now reported that was also the case for coastal residents in various parts of the state.
Earlier, local television showed images of bumper-to-bumper traffic on roads leading from the coast to higher ground. About 80,000 people live in evacuation zones on the island of Oahu, where Honolulu is located.
Even Hawaiians accustomed to tsunami warnings spared no effort in bracing for the worst.
Honolulu resident Victoria Shioi filled her bathtub with water, set her refrigerator to the coldest setting and gathered candles in case of water or power outages.
“Also backed up my computer and put the external (hard drive) in the waterproof safe,” Shioi said.
The tsunami was spawned by a sizable earthquake in western British Columbia, prompting a local tsunami warning.
“A (magnitude) 7.7 is a big, hefty earthquake — not something you can ignore,” Fryer said. “It definitely would have done some damage if it had been under a city.”
Instead, the quake struck about 139 kilometers (86 miles) south of Masset on British Columbia’s Queen Charlotte Islands. No major damage was reported.
The Alaska Tsunami Warning Center issued a warning for western British Columbia from Vancouver to the southern panhandle of Alaska.
Canadians as far away as Prince Rupert, on mainland British Columbia, felt the quake.
Tanya Simonds said she felt as if her house was “sliding back and forth on mud,” but didn’t see any damage from the tremor.
Shawn Martin was at a movie theater when the quake struck.
“It just felt like the seats were moving. It felt like someone was kicking your seat,” he said.
Martin said more than hundred cars headed toward a popular intersection in the city known for its higher ground.
Thousands of miles across the Pacific, residents in Hawaii did the same.
CNN’s Joe Sutton, Jake Carpenter, Chandler Friedman and Maggie Schneider contributed to this report.
MANILA, Philippines – Eight earthquakes, many of which occurred within an hour of each other, were recorded east of Burgos town in Surigao del Norte on Sunday, the Philippine Institute of Volcanology and Seismology said.
A 4.1-magnitude tremor which has a depth of 21 kilometers was felt in the eastern part of Burgos at 6:20 a.m.
At 9:43 a.m., a 4.8-magnitue quake was recorded 137 km east of Burgos at a 62-km depth.
The third earthquake, felt at 9:53 a.m., measured 5.3 and rattled the eastern part of Burgos.
At 10:35 a.m., a 4.5-magnitude quake hit Burgos for the fourth time. It was plotted 118 km east of Burgos with a depth of 71 km.
The fifth tremor, measured 5.5 and located 113 km east of Burgos with a depth of 85 km, occurred at 10:43 a.m.
At 11:04 a.m., a 4.9-magnitude shake was recorded 117 km east of Burgos with a depth of 125 km.
A small earthquake measuring 3.5 magnitude struck at 11:37 a.m. It was located 116 km east of the town with a depth of 62 km.
The eighth earthquake happened at 2:15 p.m. and it measured 4.2-magnitude. It was located 57 km of Burgos and has a depth of 7 km.
Eugene Tanner/AP Visitors and Oahu residents watch the ocean water surge in and out of the Ala Wai Harbor carrying various debris during a tsunami Saturday in Honolulu, Hawaii.
Petti Fong and Graham Slaughter
Staff Reporters
VANCOUVER—The second largest earthquake in Canadian history was still rattling nerves Sunday, with aftershocks off the northern coast of British Columbia.
On Saturday night, a massive 7.7 magnitude earthquake hit about 30 kilometres north of Sandspit, B.C., in the Haida Gwaii islands shortly after 8 p.m. local time, sending tremors north through the island chain and south as far as Metro Vancouver.
It was the largest earthquake to be felt in Canada since an 8.1-magnitude quake in the same region back in 1949.
A surprisingly strong 6.4-magnitude aftershock in the same area shook residents again Sunday afternoon around 2 p.m.
Earthquake expert Brent Ward from Simon Fraser University said he expects aftershocks for days ahead, but generally in the 4- to 5-magnitude range.
“We don’t really understand how to predict earthquakes enough to know if something like this could be an indicator of a larger earthquake in the same vicinity occurring in the future,” Ward said Sunday. “If we get another earthquake that’s greater than 7.7, it wouldn’t be an aftershock, it would be a new earthquake.”
Saturday’s massive quake also caused a sleepless night for a whole section of western North America, watching and waiting for a tsunami warning to pass.
Based on historical records, earthquakes in the area of Saturday evening’s rumblings don’t generally trigger tsunamis, Ward said. But he added that evacuations are a worth the effort because tsunami waves can sweep through coastal communities with devastating consequences.
Neil Goodwin, a fishing lodge manager from Sandspit, was in his living room Saturday night when the rumbling started.
“It was the kind of shaking that if you weren’t holding onto something, you’d be on the floor,” he said. “It wasn’t very violent for probably the first 10 seconds, and then it really amped up.”
As the power cut out, Goodwin, 35, used the flashlight on his cellphone to find his two dogs and escape his house. He didn’t have time to assess the damage or find his cat.
Goodwin drove to one of two hills designated as safety point in tsunami drills, where he stood with his neighbours and watched the waves grow in size and strength.
“Within 10 minutes, pretty much 90 per cent of everyone in town was in one of the two points,” he said.
In Queen Charlotte, Canadian Coast Guard Malcolm Dunderdale spent a sleepless night in the dark after the power cut out within seconds of the shaking, which he said lasted about 30 to 45 seconds.
After gathering his cellphone, mobile radios and general tsunami kits, plus blankets and pillows, Dunderdale said, there was nothing to do but wait.
The first tsunami reached the West Coast at Langara Island, part of Haida Gwaii, at 9:16 p.m., about an hour and a half after the earthquake struck. But the waves caused no damage.
The earthquake also triggered tsunami warnings in Alaska, Washington, Oregon, California and Hawaii. The last of the tsunami advisories were lifted Sunday morning.
The biggest waves — about 1.5 metres high — appeared to hit Maui, the Associated Press reported. There were no immediate reports of damage, though one person died in a fatal crash near a road that was closed because of the threat near Oahu’s north shore.
While the East Coast is bracing for the onslaught of Hurricane Sandy, southern California is contending with a pair of small earthquakes which struck Sunday.
NBC reported that the tremors measured 3.9 on the Richter scale.
Buildings shook in downtown Los Angeles, but no damages or injuries were reported. UPI reported that the first quake hit at 12:47 a.m., beginning from a depth of 11 miles. Its epicenter was 66 miles north of San Diego.
The next one occurred at 8:24 a.m., with the epicenter five miles east of Santa Clarita, 24 miles north of Los Angeles.
California was struck by a 3.5 magnitude earthquake a week earlier. It occurred at 1:40 p.m. near the city of Blue Lake, which is over 200 miles east of Sacramento.
Sunday’s quake occurred three hours after a 7.7 magnitude tremor hit the west coast of Canada, which led to a brief tsunami warning in Hawaii.
The Los Angeles Times reported that no warnings were issued for California at that time.
An earthquake that registered 3.9 on the Richter Scale hit eastern Arkansas Monday morning, and was felt by several Memphis-area residents as well.
According to the US Geological Survey website, the tremor hit around 7:39 a.m.
The epicenter was about 6 miles from Parkin, Ark., and about 30 miles from Memphis.
Several Memphis residents were chattering almost immediately on social media about the several seconds of tremors that shook Midtown.
“About 8 minutes ago, felt about 8-10 seconds of tremors in midtown,” tweeted @JeffGinMEM around 7:50 a.m. Monday.
Former Jackson resident Jada Love posted on her Facebook, “Did anyone else in Midtown Memphis feel earthquake tremors…?”
Tiffany Renee Daniel responded, “I’m in Southaven and I swear I just felt something too I was just sitting here trying to explain it away.”
Love lives in a fourth-story apartment and said she could hear a low rumbling and felt her couch shake. She said her parents, who are in the Bartlett/Arlington area, did not feel anything.
But Kevin Thompson did at his home in the Rivercrest neighborhood in north Bartlett.
“My wife and I had been awake and talking for a while. We felt an initial boom-rumble, and then the bed was shaking a little. We concluded that it was the kids pounding on the floor upstairs, but we thought it was weird because we had never felt the bed shake like that before,” he said. “A few minutes later, we saw that some of our friends on Facebook talking about the earthquake. That’s when the shaking started to make more sense.”
That experience was similar to what was reported by many residents of the Memphis area.
“A little after 7:30 this morning I felt my house shake and heard a rumbling noise! I thought it was my imagination! Felt better when I heard it really was an earthquake,” said Stacey Alpert of Cordova.
Kevin O’Brien lives just south of Olive Branch. When he felt the tremors Monday morning, at first he thought his cat was somehow shaking the couch.
“It seemed a bit too strong a shake for our smallish cat and my suspicion quickly shifted to earthquake when I saw the Halloween decoration hanging from the dinette light fixture swinging,” he said. “Still, I looked outdoors to confirm that the cat had not snuck into the house.”
VIJAYAWADA: Panic spread across several villages in five districts in the state due to mild tremors on Monday. People ran out of their houses when the earth shook for a few seconds. Though no casualties were reported from any of the districts, there was panic in many places in Krishna, Guntur, Prakasam, Nalgonda, and Khammam.
There were reports of tremors even at Hayathnagar in Rangareddy district around the same time. The earth quake monitoring centre at Vijayawada termed the incident as ‘very minor’ and said there was nothing to worry about. “It’s common to experience such tremors when the rocky layers of earth make adjustments within themselves,” said RDO S Venkata Rao.
The earthquake swarm in the Tjörnes Fracture Zone north off Iceland continues into its 10th day. After a decline in intensity during 25-28 Oct, the frequency of quakes has again picked up. There are often more than 100 quakes a day including some above magnitude 3. The Icelandic Met Office maintains a warning for a possible larger quake in the area.
Access to one of Costa Rica’s most popular national parks remains open to tourists.
Experts from the National Seismological Network are keeping the volcano under surveillance. Courtesy of RSN
The Poas Volcano early Sunday awoke residents of the province of Alajuela with a strong rumble.
At about 1 a.m., the volcano’s crater ejected mud and ash more than 500 meters into the air. Ashes traveled hundreds of meters around the national park, rangers reported.
Although the volcano is frequently active, this kind of strong explosion has not been recorded since 2006. Experts said the activity was normal, but they will continue monitoring the volcano.
Poás Volcano National Park will remain open to tourists while experts determine if there is any risk to visitors.
http://www.euronews.com/ “C’est l’hiver avant l’heure;” or ‘it is winter before it should be’, was one local person’s reaction to heavy snow falls which have hit eastern parts of France.
The cold snap brought power cuts with up to 50,000 households in the Isere region in the Alps deprived of electricity.
Authorities have issued an “Orange” warning, the second highest alert, and rescue services have been fully mobilised.
Up to 50 centimetres of snow fell in some parts making driving hazardous. An icy wind and fresh falls of snow on top of the ice only added to the dangerous conditions.
Many drivers were forced to abandon their cars while emergency services were called to clear trees from roads felled in the high winds, with gusts blowing up to 130 kilometres per hour recorded in one area.
Parts of the south of France were the worst hit by the high winds where on the riviera two people have been reported missing.
A search has been mounted for a 12-year-old boy on the island of Porquerolles. Emergency services say his bike has been found. A 26-year-old windsurfer is also missing.
In the port of Marseille the ferry Napoleon Bonaparte was damaged when strong winds broke the ship’s moorings.
The hull smashed against the dock flooding two of its watertight compartments.
Beijing — China’s central and eastern regions will experience temperature drops in coming days, while the southern parts will receive moderate to heavy rain, the national meteorological watchdog forecast Sunday.
Strong wind will make temperatures in northeastern regions fall by six to ten degrees Celsius on Sunday. A blast of cold air is forecast to sweep across the central and eastern parts from Monday, the National Meteorological Center said on its website.
The center also forecast that fog will shroud parts of Hubei, Jiangsu and Anhui provinces on Sunday morning, reducing visibility to less than 1,000 meters.
Over the next three days, parts of South China will see moderate to heavy rain, and some regions may experience torrential rain, the center said.
Son-Tinh, the 23rd tropical storm of the year, strengthened to a super-typhoon on Saturday night and was located 260 km southeast of Vietnam’s Thanh Hoa at 5 a.m. Sunday.
Son-Tinh is expected to move northwestward at a speed of 10 to 15 km per hour and make landfall in Vietnam’s northern coastal regions on Sunday night, the center said.
Meteorologists predict heavy snowfall throughout the country and have issued a nationwide class 1 warning.
“There may be large quantities of snow,” explained Lisa Frost of the Swedish Meteorological and Hydrological Institute, SMHI.
“As it’s the first snow and it’s quite early in the season, we’re issuing the warning – especially as some people haven’t changed to their winter tyres yet.”
Throughout Monday, the Dalarna and Värmland counties have been slammed by a lengthy snow storm, which has left 10 cm (4 inches) of snow. SMHI forecast a further 10 cm before Tuesday.
Meanwhile, the Swedish Transport Administration (Trafikverket) is already fighting the blizzards.
The season’s lowest temperature was recorded on Sunday night with Nattavaara in far northern Sweden hitting -22.1C (-6F).
Winter appeared overnight in many parts of Germany on Saturday with unseasonal heavy snow fall and subzero temperatures hitting central and southern areas.
Meteorologists say this is the first time for decades that snow has fallen on low lying areas in October. More flurries are expected over the weekend.
As much as 17cm of snow fell overnight in Thuringen forest in central Germany – a suspected record for this time of year.
Heavy snow also fell on Bavaria, Saxony, Rhineland-Palatinate, Hesse and Saarland, with further flurries expected on Saturday in Leipzig, Dresden and Munich, according to the DWD.
“This happens maybe once every 30 or 40 years,” meteorologist Christoph Hartmann of the German weather service (DWD) told Die Welt newspaper on Saturday, referring to the unusual snowfall in October.
The severe drop in temperature – by 20 degrees within a week – also occurs “very, very seldom,” he added.
With winter’s first onslaught, fallen trees blocked train lines between Leipzig and Munich, causing delays and diversions to the ICE high speed rail network.
A further 10-15 cm of snow is expected overnight in the Alps and in the Ore Mountains in Saxony, where DWD said temperatures could fall as low as minus ten.
Only twice before since records began has there been snow in October in all the nine provinces of Austria, on the 31 October 1941 as well as in the night of 23 and 24 October 2003.
Austrian weather expert Alexander Orlik from the central weather institute ZAMG said: “It is true the snow is very early this year and that is an indication that it will be a long hard winter, but not proof.”
The early snow caught many drivers unaware who had not yet changed over to winter tyres – causing problems on the roads. The legal deadline to have winter tyres is 1 November in Austria.
In Carinthia parts of the region were left without electricity as the snow fell as a result of heavy snow meaning trees toppled onto the lines .
Parts of West Virginia were digging out from up to three feet of snow dumped in the aftermath of Hurricane Sandy, a deluge that cut power to hundreds of thousands of residents and shut down main highways.
The thick blanket of snow at higher elevations across the ridges of the Appalachian Mountains, including in parts of Maryland and Pennsylvania, also brought concerns that rivers and creeks in low-lying areas could flood later in the week as the snow melts, with temperatures expected to reach 60 degrees. Falling trees and storm-related traffic accidents claimed the lives of three people in Maryland, three in Pennsylvania and one in West Virginia, state officials said Tuesday.
Close to 300,000 West Virginia residents were without power Tuesday afternoon, as high winds and heavy snow snapped branches and downed power lines, and officials expected the number to rise. Outages at several utilities had left some areas without access to water, and officials were sending out trucks to deliver bottled water.
“West Virginia continues to be hard hit,” said Gov. Earl Ray Tomblin, a Democrat. “Right now, my main focus is on life safety, power restoration and critical infrastructure.…We are doing everything we can to help the folks in need.”
More than 30 of West Virginia’s 55 counties had snow, with the heaviest snowfall at higher elevations, said Liz Sommerville, a National Weather Service meteorologist in Charleston, W.Va. Bowden, above 3,000 feet, recorded 24 inches by early Tuesday, compared with 16 inches in Beckley, elevation 2,300 feet, and 9 inches in the capital of Charleston, elevation 980 feet.
“Trees are coming down. I got a feeling that a lot of weaker structures are going to come down,” said Gary Berti, of Davis, W.Va., where 30 inches of snow had fallen by Tuesday afternoon. Mr. Berti, 54 years old, said all the stores along the main street of Davis were closed Tuesday and only pickup trucks with four-wheel drive were braving secondary roads. Restaurants without power were making food for rescue workers using gas stoves, he said: “They’re cooking everything they’ve got because they know they’re going to lose it.”
Snow was expected to keep falling on mountainous areas through Wednesday, and blizzard warnings remained in effect in more than a dozen counties Tuesday. At lower elevations, snow was expected to turn to rain by Tuesday night.
The West Virginia Department of Transportation reported accidents on three major highways in the state and said fallen trees and power lines were complicating efforts to clear roads. The agency urged residents to stay home. Marshall University canceled classes at various campuses around the state, and West Virginia State University closed for the day.
Western Maryland recorded two feet of snow, and blizzard warnings remained in effect Tuesday. While eastern areas of the state endured some flooding, officials were bracing for worse, said Ed McDonough, a spokesman for the Maryland Emergency Management Agency. More than 300,000 people in the state were without power Tuesday, with many outages in the Baltimore area. About 50 people were evacuated late Monday from the town of Crisfield, which sits on the Chesapeake Bay, after floodwaters spilled into homes.
In Pennsylvania, 1.25 million residents remained without power Tuesday. Gov. Tom Corbett warned that the central part of the state could see minor flooding, but far less than what storms last year brought to the region. The highest point in the state, Mount Davis, received 9 inches of snow, with several more inches expected. There is “nothing of major significance at this point in time that we have great concern about,” Gov. Corbett said at a midday news briefing.
Pennsylvania officials planned to have a shelter open in West Chester, Pa., to house 1,300 people from New Jersey, and another in East Stroudsburg, Pa., to aid 500 people displaced in New York. In addition, Pennsylvania officials were providing 35 ambulances and a large vehicle to transport people, as well as providing a rescue team requested by the Federal Emergency Management Agency to New Jersey.
—Jennifer Corbett Dooren contributed to this article.
Strong winds swept ash from the largest volcanic eruption of the 20th century into the atmosphere Tuesday, creating a haze over Alaska’s Kodiak Island and prompting the National Weather Service to issue flight warnings for the area. Powerful northwest winds funneled through the mountains at the Katmai Bay, sending ash around 4,000 feet into the sky southeast toward Kodiak. Brian Hagenbuch, general meteorologist at the National Weather Service Anchorage office, was the first to spot the ash. “When the sun came up yesterday, I noticed it looked foggy on the Larson Bay camera,” one of many cameras set up by the FAA to monitor weather conditions. But as the sun continued to rise, he noted the fog looked smoggy and brown. Around 10 a.m., Hagenbuch checked the visible satellite and found a “milky, dome-shaped plume.” He then double-checked on infra-red equipment that is used specifically to spot ash even through cloud cover, which verified his findings. Having confirmed his suspicions, Hagenbuch put together a “Significant Meterological Event” warning, called a SIGMET, to alert pilots of the hazardous conditions in the area. Hagenbuch says that very strong winds “from time to time” will stir up the ash from Novarupta. The Novarupta volcanic eruption of June 6, 1912, occurred in what is now the Katmai National Park and Preserve. For three days, the volcano spewed 100 times more material than the Mount St. Helens eruption, shooting plumes 20 miles into the air and burying the valley downwind in over 500 feet of ash and volcanic rock. Four years later, when botanist Robert Griggs visited the valley, steam still poured from vents across the valley, prompting the crew to name it The Valley of Ten Thousand Smokes. Hagenbuch will update, and possibly cancel, the SIGMET on the National Weather Service’s website Wednesday. Hagenbuch notes that there is “much less” ash in the air than Tuesday.
Washington – One crew member has died and the captain is missing in high seas and raging winds after the Canadian-built replica of HMS Bounty was abandoned and sank Monday morning.
U.S. Coast Guard Jayhawk helicopters rescued 14 others from life rafts in a dramatic dawn rescue about 150 kilometres off Cape Hatteras, N.C.
As the crew abandoned the sinking ship, struggling to get into life rafts before dawn, three were tossed into the sea by waves sweeping over the stricken vessel. “One of those managed to get to a raft, but not the other two,” U.S. Coast Guard spokesman Lieutenant-Commander Jamie Frederick told The Globe and Mail at 13:30 pm.
The dead crew member, 42-year-old Claudene Christian, was found unresponsive in the water on Monday evening. The Coast Guard said she was taken to a hospital in Elizabeth City, where she was later pronounced dead.
Rescuers continued to search for the missing captain of HMS Bounty, 63-year-old Robin Walbridge.
The Coast Guard says Captain Walbridge and Ms. Christian were able to put on survival suits designed to keep them afloat and protect them from chilly waters for 15 hours.
Helicopters were used in the search and two Coast Guard cutters have also gone out to sea to help search.
“We’re throwing all the assets we have out there so that we can keep searching for these folks,” Cdmr Frederick said.
Huge crop losses in southern Haiti raise famine worries
Flooding raises specter of cholera
Crop losses in Cuba, Jamaica as well
Port-au-Prince – As Hurricane Sandy barreled toward the U.S. East Coast on Monday, the full extent of the storm’s havoc on Haiti was just beginning to emerge.
Extensive damage to crops throughout the southern third of the country, as well as the high potential for a spike in cases of cholera and other water-borne diseases, could mean Haiti will see the deadliest effects of Sandy in the coming days and weeks.
Haiti reported the highest death toll in the Caribbean, as swollen rivers and landslides claimed at least 52 lives, according to the country’s Civil Protection office. More than three days of constant rain left roads and bridges heavily damaged, cutting off access to several towns and a key border crossing with the Dominican Republic.
“The economy took a huge hit,” Prime Minister Laurent Lamothe told Reuters. He also said Sandy’s impact was devastating, “even by international standards,” adding that Haiti was planning an appeal for emergency aid.
“Most of the agricultural crops that were left from Hurricane Isaac were destroyed during Sandy,” he said, “so food security will be an issue.”
Sandy also destroyed banana crops in eastern Jamaica as well as decimating the coffee crop in eastern Cuba.
But the widespread loss of crops and supplies in the south, both for commercial growers and subsistence farmers, is what has Haitian authorities and aid organizations had worried about most.
The past several months have seen a series of nationwide protests and general strikes over the rising cost of living. Even before Hurricane Sandy hit, residents complained that food prices were too high.
A rise in food prices in Haiti triggered violent demonstrations and political instability in April 2008. Jean Debalio Jean-Jacques, the Ministry of Agriculture’s director for the southern department, said he worried that the massive crop loss “could aggravate the situation.”
“The storm took everything away,” said Jean-Jacques. “Everything the peasants had in reserve – corn, tubers – all of it was devastated. Some people had already prepared their fields for winter crops and those were devastated.”
In Abricots on Haiti’s southwestern tip, the community was still recovering from the effects of 2010’s Hurricane Tomas and a recent dry spell when Sandy hit.
“We’ll have famine in the coming days,” said Abricots Mayor Kechner Toussaint. “It’s an agricultural disaster.”
The main staples of the local diet, bananas and breadfruit, were ripped out by winds and ruined by heavy rains.
In the southwestern Grand Anse department, a boat that regularly comes from Port-au-Prince to deliver supplies and pick up produce to sell in the capital had not come in more than a week because of the storm. The cost of basic things, like fuel, had already jumped.
In Camp-Perrin, a mountainous region in the southwest peninsula where Sandy’s first fatality was recorded after a woman tried to cross a swollen river, coffee planters lamented the loss of a harvest they were weeks away from collecting.
“Coffee is the bank account of the peasants,” said Maurice Jean-Louis, a planter and head of a coffee growers’ cooperative in Camp-Perrin. Rain flooded many storage areas as well, soaking coffee beans that were set aside for export. He called the damage “incalculable.”
Cholera in the Capital
In the capital, Port-au-Prince, Sandy destroyed concrete homes and tent camps alike, where 370,000 victims of the 2010 earthquake are still living. Haitian authorities said 18,000 families were left homeless in the disaster.
Aid organizations began reporting a sharp rise in suspected cholera cases in several departments, with at least 86 new cases alone coming from Port-au-Prince’s earthquake survivor camps, according to Dr. Juan Carlos Gustavo Alonso of the Pan American Health Organization. Many communities are still cut off and only accessible by helicopter, he said, so the broader rise in cholera was “still too early to tell.”
Since October 2010, a cholera outbreak has sickened almost 600,000 people and killed more than 7,400 in Haiti.
Both the Haitian state and international aid organizations distributed food, water and other items to affected camps and communities throughout the weekend, including personal distributions by President Michel Martelly.
“These stocks are running dangerously low,” said George Ngwa, spokesman for OCHA, a humanitarian coordinating body in Haiti. “After Tropical Storm Isaac in August, these stocks have not been replenished. What we’re doing is scraping the bottom.”
Boats sit in the Beilun River, which separates China and Vietnam, on Tuesday, October 30. Tropical Storm Son-Tinh was moving northeast along the northern Vietnamese coast on Monday after tearing the roofs off hundreds of houses and breaching flood defenses overnight, the state-run Vietnam News Agency reported.
A Chinese soldier hands over a Vietnamese baby he rescued from the flood to his mother at a waterlogged market near the China-Vietnam on Monday.
A man stands on a flooded road in Sanya, China, on Sunday, October 28.
An uprooted tree crushes a car in China on Sunday.
STORY HIGHLIGHTS
More than a thousand rescue workers have been deployed in Vietnam
Helicopters are on standby to search for an oil rig adrift from its towboats
Tropical Storm Son-Tinh had already killed at least 27 people in the Philippines
Hong Kong (CNN) — As Hurricane Sandy lashes the East Coast of the United States with wind and rain, Southeast Asia is dealing with the trail of death and damage from a powerful storm that has killed at least 30 people in the region over the past few days.
Tropical Storm Son-Tinh was moving northeast along the northern Vietnamese coast on Monday after tearing the roofs off hundreds of houses and breaching flood defenses overnight, the state-run Vietnam News Agency (VNA) reported.
Son-Tinh was at typhoon level when it thumped into northern Vietnam late Sunday with winds as strong as 133 kilometers per hour (83 mph). It left three people dead and two injured, according to an initial estimate from the Office of the National Search and Rescue Committee reported by (VNA).
More than a 1,300 rescue workers and soldiers have been deployed to work with local authorities on search and rescue efforts in the aftermath of the storm, VNA said.
Helicopters were on standby for a search and rescue mission for an oil rig with 35 people on board that became disconnected from its towboats miles out at sea amid strong waves generated by the storm, according to VNA.
And five people were missing Sunday after winds from Son-Tinh sank an engineering vessel near a cargo terminal in Sanya, a city on the southern Chinese island of Hainan, China’s state-run news agency Xinhua reported.
Son-Tinh is expected to gradually weaken over the course of Monday, regional weather agencies said. At least 260,000 people in Vietnam had been relocated to safer areas as it approached Sunday.
The storm had already killed 27 people when it swept across the central Philippines during the second half of last week, causing flash floods and landslides, according to the Philippine National Disaster Risk Reduction and Management Council. Nine people remain missing, the council said Monday.
East Asia is buffeted for several months a year by heavy storms that roll in from the western Pacific Ocean. In August, a big typhoon, named Bolaven, killed more than 60 people on the Korean peninsula.
The mammoth and merciless storm made landfall near Atlantic City around 8 p.m., with maximum sustained winds of about 80 miles per hour, the National Hurricane Center said. That was shortly after the center had reclassified the storm as a post-tropical cyclone, a scientific renaming that had no bearing on the powerful winds, driving rains and life-threatening storm surge expected to accompany its push onto land.
The storm had unexpectedly picked up speed as it roared over the Atlantic Ocean on a slate-gray day and went on to paralyze life for millions of people in more than a half-dozen states, with extensive evacuations that turned shorefront neighborhoods into ghost towns. Even the superintendent of the Statue of Liberty left to ride out the storm at his mother’s house in New Jersey; he said the statue itself was “high and dry,” but his house in the shadow of the torch was not.
The wind-driven rain lashed sea walls and protective barriers in places like Atlantic City, where the Boardwalk was damaged as water forced its way inland. Foam was spitting, and the sand gave in to the waves along the beach at Sandy Hook, N.J., at the entrance to New York Harbor. Water was thigh-high on the streets in Sea Bright, N.J., a three-mile sand-sliver of a town where the ocean joined the Shrewsbury River.
“It’s the worst I’ve seen,” said David Arnold, watching the storm from his longtime home in Long Branch, N.J. “The ocean is in the road, there are trees down everywhere. I’ve never seen it this bad.”
In New York, Gov. Andrew M. Cuomo’s office said late Monday night that at least five deaths in the state were attributable to the storm. At least three of those involved falling trees. About 7 p.m., a tree fell on a house in Queens, killing a 30-year-old man, the city police said. About the same time, two boys, ages 11 and 13, were killed in North Salem in Westchester County, when a tree fell on the house they were in, according to the State Police.
In Morris County, N.J., a man and a woman were killed when a tree fell on their car Monday evening, The Associated Press reported.
In Manhattan, NYU Langone Medical Center’s backup power system failed Monday evening, forcing the evacuation of patients to other facilities.
In a Queens beach community, nearly 200 firefighters were battling a huge blaze early on Tuesday morning that tore through more than 50 tightly-packed homes in an area where heavy flooding slowed responders.
Earlier, a construction crane atop one of the tallest buildings in the city came loose and dangled 80 stories over West 57th Street, across the street from Carnegie Hall.
Soon power was going out and water was rushing in. Waves topped the sea wall in the financial district in Manhattan, sending cars floating downstream. West Street, along the western edge of Lower Manhattan, looked like a river. The Brooklyn-Battery Tunnel, known officially as the Hugh L. Carey Tunnel in memory of a former governor, flooded “from end to end,” the Metropolitan Transportation Authority said, hours after Gov. Andrew M. Cuomo of New York ordered it closed to traffic.Officials said water also seeped into seven subway tunnels under the East River.
Joseph J. Lhota, the transit authority chairman, called the storm the most devastating disaster in the 108-year history of the subway system.
“We could be fishing out our windows tomorrow,” said Garnett Wilcher, a barber who lives in the Hammells Houses, a block from the ocean in the Rockaways in Queens. Still, he said he felt safe at home. Pointing to neighboring apartment houses in the city-run housing project, he said, “We got these buildings for jetties.”
Hurricane-force winds extended up to 175 miles from the center of the storm; tropical-storm-force winds spread out 485 miles from the center. Forecasters said tropical-storm-force winds could stretch all the way north to Canada and all the way west to the Great Lakes. Snow was expected in some states.
Businesses and schools were closed; roads, bridges and tunnels were closed; and more than 13,000 airline flights were canceled. Even the Erie Canal was shut down.
Subways were shut down from Boston to Washington, as were Amtrak and the commuter rail lines. About 1,000 flights were canceled at each of the three major airports in the New York City area. Philadelphia International Airport had 1,200 canceled flights, according to FlightAware, a data provider in Houston. And late Monday night, Mayor Michael R. Bloomberg said cabs had been instructed to get off New York City roads.
A replica of the H.M.S. Bounty, a tall ship built for the 1962 movie “Mutiny on the Bounty” starring Marlon Brando and used in the recent “Pirates of the Caribbean” series, sank off the North Carolina coast. The Coast Guard said the 180-foot three-masted ship went down near the Outer Banks after being battered by 18-foot-high seas and thrashed by 40-m.p.h. winds. The body of one crew member, Claudene Christian, 42, was recovered. Another crew member remained missing.
Delaware banned cars and trucks from state roadways for other than “essential personnel.”
“The most important thing right now is for people to use common sense,” Gov. Jack Markell said. “We didn’t want people out on the road going to work and not being able to get home again.”
By early evening, the storm knocked out power to hundreds of thousands of homes, stores and office buildings. Consolidated Edison said that as of 1:30 a.m. Tuesday, 634,000 customers in New York City and Westchester County were without power. Con Edison, fearing damage to its electrical equipment, shut down power pre-emptively in sections of Lower Manhattan on Monday evening, and then, at 8:30 p.m., an unplanned failure, probably caused by flooding in substations, knocked out power to most of Manhattan below Midtown, about 250,000 customers. Later, an explosion at a Con Ed substation on East 14th Street knocked out power to another 250,000 customers.
In New Jersey, more than two million customers were without power as of 1:30 a.m. Tuesday, and in Connecticut nearly 500,000.
President Obama, who returned to the White House and met with top advisers, said Monday that the storm would disrupt the rhythms of daily life in the states it hit. “Transportation is going to be tied up for a long time,” he said, adding that besides flooding, there would probably be widespread power failures. He said utility companies had lined up crews to begin making repairs. But he cautioned that it could be slow going.
“The fact is, a lot of these emergency crews are not going to get into position to start restoring power until some of these winds die down,” the president said. He added, “That may take several days.”
Forecasters attributed the power of the storm to a convergence of weather systems. As the hurricane swirled north in the Atlantic and then pivoted toward land, a wintry storm was heading toward it from the west, and cold air was blowing south from the Arctic. The hurricane left more than 60 people dead in the Caribbean before it began crawling toward the Northeast.
“The days ahead are going to be very difficult, Gov. Martin O’Malley of Maryland said. “There will be people who die and are killed in this storm,” he said.
Alex Sosnowski, a senior meteorologist with AccuWeather, said potentially damaging winds would continue on Tuesday from Illinois to the Carolinas — and as far north as Maine — as the storm barreled toward the eastern Great Lakes.
Mr. Cuomo, who ordered many of the most heavily used bridges and tunnels in New York City closed, warned that the surge from Hurricane Sandy could go two feet higher than that associated with Tropical Storm Irene last year. The PATH system, buses and the Staten Island Ferry system were also suspended.
Mr. Lhota, the chairman of the Metropolitan Transportation Authority, has said he expected to restore at least some service about 12 hours after the storm ended. But possible flooding within the subway system could prevent a full-scale reopening.
The storm headed toward land with weather that was episodic: a strong gust of wind one minute, then mist. More wind. Thin sheets of rain dancing down the street. Then, for a moment, nothing. The sky lightened. Then another blast of rain. Then more wind.
The day brought a giddiness to schoolchildren who had the day off and to grown-ups who were fascinated by the rough, rising water. Some went surfing, discounting the danger. Felquin Piedra, 38, rode his Jet Ski from Queens to Lower Manhattan.
“I love the waves,” Mr. Piedra yelled from New York Harbor. “The water is warm. I’ve jumped in several times.”
But even when landfall was still hours away, there was no holding back the advance guard of the storm — fast-moving bands of rain and punishing winds.
It added up to devastation. Driving through places like Pompton Plains, N.J., late Monday afternoon was like an X-Games contest for drivers. They had to do tree-limb slaloms on side streets and gunned their engines anxiously as they passed wind funnels of leaves swirling on highways.
On City Island, off the Bronx mainland, Cheryl Brinker sprayed “Sandy Stay Away” on her boarded-up art studio, expanding a collage she started during Tropical Storm Irene last year. But by midafternoon, nearby Ditmars Street was under as much as five feet of water and Steve Van Wickler said the water had cracked the cement in his cellar. “It’s like a little river running in my basement,” he said. “There are cracks and leaks everywhere.”
In some places, caravans of power-company trucks traveled largely empty roads; Public Service Electric and Gas said that 600 line workers and 526 tree workers had arrived from across the country, but could not start the repairs and cleanup until the wind had subsided, perhaps not until Wednesday.
They will see a landscape that, in many places, was remade by the storm. In Montauk, at the end of Long Island, a 50-seat restaurant broke in half. Half of the building floated away and broke into pieces on the beach.
The 110-foot-tall lighthouse at Montauk Point — the oldest in the state, opened in 1796 — shuddered in the storm despite walls that are six feet thick at the base. The lighthouse keeper, Marge Winski, said she had never felt anything like that in 26 years on the job.
“I went up in tower and it was vibrating, it was shaking,” she said. “I got out of it real quick. I’ve been here through hurricanes, and nor’easters, but nothing this bad.”
With at least 50 people dead, transit crippled in New York City and millions of people along the U.S. East Coast struggling without electricity, communities face a daunting challenge of repairing the damage wrought by superstorm Sandy.
In New York, where 18 people were killed, Mayor Michael Bloomberg surveyed the destruction in the hardest-hit neighbourhoods Tuesday. He said he saw homes so utterly destroyed only “chimneys and foundations” were left.
But despite the daunting challenge of recovery efforts, Bloomberg said “New Yorkers are resilient.”
About a third of New York’s fleet of taxis were operating Tuesday, bus service was partially restored, and the New York Stock Exchange was expected to reopen Wednesday.
U.S. President Barack Obama declared New York and Long Island a “major” disaster area.
The declaration means federal funding is now available to residents of the hardest-hit areas, who awoke to a tragic aftermath of the deadly storm that slammed ashore in New Jersey on Monday evening.
New York had seen a four-metre surge of seawater crash ashore overnight, inundating the city’s tunnels and electrical systems and causing massive damage to the city’s famed subway. The storm left New York with no running trains, a vacated business district and entire neighbourhoods under water.
New York’s Metropolitan Transportation Authority said the subway system, which remains closed, had suffered the worst damage in its 108-year history.
As of midday Tuesday, Sandy’s sustained winds were already diminishing from the 130 km/h it was packing at landfall near Atlantic City, N.J. on Monday evening.
But forecasters warn the storm system will continue to affect a region stretching from the U.S. eastern seaboard north to Canada, and as far west as Wisconsin and Illinois, as it churns across Pennsylvania before veering into western New York state sometime Wednesday.
New Jersey Gov. Chris Christie gave a bleak update at a morning news conference Tuesday, saying seaside rail lines were washed away, and there was no safe place on the state’s barrier islands for him as large parts of the coast are still under water.
“We are in the midst of urban search and rescue. Our teams are moving as fast as they can,” Christie said. “The devastation on the Jersey Shore is some of the worst we’ve ever seen. The cost of the storm is incalculable at this point.”
The effects aren’t contained to America’s largest city. More than 7.4 million homes and businesses in an area that stretches from the Carolinas in the south to Ohio in the northeast are without power Tuesday. Tens of thousands were also without electricity in southern parts of Ontario and Quebec too, as Sandy carries its combination of rain and wind northwards.
In Canada, a Toronto woman was killed Monday evening after she was struck by a falling sign blown down in the powerful storm’s high winds.
Most of the Sandy-related wind warnings issued by Environment Canada have been called off however, except for the Sarnia region, areas along the St. Lawrence River in Quebec and Inverness County in Nova Scotia.
The storm was officially downgraded from hurricane status, but it came ashore packing a lot of energy due to its unusually low barometric pressure. Combined with a cold-weather system from the north, and the high tide of the full moon, the storm is forecast to continue wreaking havoc across a 1,300-kilometre region that’s home to 50 million people through Wednesday.
Forecasters are even warning as much as one metre of snow could fall in some states, some of which has already fallen in West Virginia and other higher ground inland.
Notable effects of post-tropical storm Sandy:
U.S. death toll so far is 50, including 18 people in New York, and numerous others killed in a total of seven states.
In Canada, one woman is dead after she was struck by debris from a wind-blown sign in the west-end of Toronto Monday evening.
Sandy had already been blamed for 69 deaths when it tore through the Caribbean.
Concerns during the peak of the storm prompted shutdowns at two nuclear plants in New York and New Jersey, as well as an alert at America’s oldest nuclear plant at Barneget Bay, N.J.
200 patients, including those on respirators and babies in intensive care, evacuated after New York University’s Tisch Hospital lost power.
Winds toppled a construction crane atop a 74-storey luxury high-rise in midtown Manhattan, forcing the evacuation of nearby buildings.
Fire destroyed at least 50 homes in the Breezy Point section of Queens.
Four unoccupied row houses in Baltimore collapsed in the storm.
Wind gusts of more than 100 km/h prompted the closure of the port in Portland, Maine.
Flooding in areas from Virginia to Atlantic City, where the storm washed away a 15-metre section of the famous boardwalk. New York City’s now-flooded subway remains shut.
The Holland Tunnel connecting New York to New Jersey is closed, as is a tunnel between Brooklyn and Manhattan. The Brooklyn Bridge, the George Washington Bridge, the Verrazano-Narrows Bridge is also barricaded due to high winds.
More than 12,000 commercial flights are cancelled, with more expected. New York’s LaGuardia, Newark Liberty and Kennedy airports are all closed.
One crew member of the Canadian-built HMS Bounty sunk in storm-battered seas off North Carolina was found and later pronounced dead. 14 others rescued alive, but the captain is still missing.
An estimated 360,000 residents of 30 Connecticut communities were under mandatory and voluntary evacuation orders.
While it could take days to determine the extent of the storm damage, early estimates peg the potential price tag anywhere between $10 billion and $20 billion, which could make it one of the costliest storms in U.S. history.
Ahead of Sandy making landfall Monday, U.S. President Barack Obama declared states of emergency in Massachusetts, Connecticut, Rhode Island, New York, New Jersey and Pennsylvania.
“Please listen to what your state and local officials are saying,” Obama said from the White House. “When they tell you to evacuate, you need to evacuate. Don’t delay, don’t pause, don’t question the instructions that are being given, because this is a powerful storm.”
On the U.S. presidential election front, both Obama and Republican presidential candidate Mitt Romney suspended campaigning Monday, with just a week left before voting day.
The Hindu Onlookers gather to get a glimpse of ‘Pratibha Cauvery’ that ran aground near Elliots Beach on Wednesday. Photo: V. Ganesan
The Hindu Cyclone ‘Nilam’ hits the Mamallapuram beach, in Chennai on Wednesday. Photo: B. Jothi Ramalingam
A bird’s eye view of Marina beach in Chennai on Wednesday. Nilam evoked fears of large-scale destruction among the people in coastal districts in north Tamil Nadu. Photo: PTI
The Hindu An aerial view of the cyclone Nilam ravaged Marina on Wednesday evening. Schools, colleges and other educational establishments have announced holiday for the third day on Thursday. Photo: S.R. Raghunathan
The Hindu A man takes cover from gusty winds at Anna Salai in Chennai on Wednesday. Photo: M. Vedhan
India Meteorological Department Image shows Cyclone Nilam as captured by Kalpana-1 satellite on Wednesday.
Storm makes landfall near Mamallapuram; rain claims four lives in Tamil Nadu
Cyclonic storm Nilam, which threatened to hit the Chennai coast, spared the city, but made landfall near Mamallapuram, about 60 km south of Chennai, on Wednesday evening.
Four persons were reported to have died during the day in different parts of the State, but a Revenue department official clarified that Kancheepuram district, where the storm crossed the coast between 4 p.m. and 5 p.m., did not report even a single death.
Nilam evoked fears of large-scale destruction among the people in coastal districts in north Tamil Nadu.
The exact details about the landfall would be known on Thursday after an assessment by the Meteorological Department, according to Y.E.A. Raj, Deputy Director General of Meteorology.
Though many areas in the northern belt received heavy rainfall on Tuesday night, the intensity was not much during the day when Nilam made the last leg of its journey. According to a bulletin issued on the basis of observations at 8-30 a.m., the storm lay centred about 260 km south southeast of Chennai, and by 6 p.m, it made landfall.
At the time of crossing the coast, Chennai recorded the maximum wind speed of 75 km per hour and Kalpakkam 65 km per hour. Hereafter, it was expected to weaken rapidly after making northwestward movement.
A holiday has been declared for schools and colleges in all coastal districts, including Chennai, on Thursday.
Today
Tropical Storm
India
MultiStates, [States of Tamin Nadu and Andhra Pradesh]
A tropical storm slammed into southern India, bringing heavy rain and a storm surge flooding low-lying areas and displacing more than 100,000 people. Just before the storm made landfall Wednesday, an oil tanker with 37 crew ran aground off Chennai. One of its lifeboats capsized in the choppy waters, and one crewmember drowned, the Press Trust of India news agency reported. Coast guard officers were searching for the lifeboat’s six other occupants. Andhra Pradesh state said two people died there when their homes collapsed due to heavy rain Wednesday night in Nellore and Chittoor districts, and PTI reported another death in Tamil Nadu state, a 46-year old man who slipped into the rough sea from a pier and drowned. Sri Lanka reported two deaths earlier from the cyclone. The storm from the Bay of Bengal had maximum winds of 75 kilometers (45 miles) per hour after landfall but was weakening. A storm surge of up to 1.5 meters (5 feet) was expected to flood low-lying coastal areas, the India Meteorological Department said. Heavy to very heavy rain was forecast for Thursday, and fishermen were asked to stay at shore. State authorities turned 282 schools into relief centers in Chennai, the capital of Tamil Nadu. The city’s port halted cargo operations, officials said. Twenty-three ships were moved to safer areas. About 150,000 people were moved to shelters in Nellore, district official B. Sridhar said.
In Sri Lanka, thousands have been displaced due to heavy rain and strong winds. The nation’s Disaster Management Center said 4,627 people were displaced by flooding and 56 fled because of a landslide threat in the island’s central region. One woman died Tuesday after a tree branch fell on her, while another person was killed in flooding, the agency said. Floods also damaged about 1,000 houses, it said.
Winds from hurricane Sandy have seriously damaged a building in Manhattan as the centre of the storm heads towards land. Part of the facade of a four story building in the West Village collapsed at about 6.30pm, leaving rooms open to the elements but no one injured. Elsewhere parts of midtown Manhattan were evacuated when a crane on top of a skyscraper partially collapsed. The Fire Department of New York initially reported a “multi-dwelling building collapse” on Twitter, although pictures quickly emerged showing that the front wall of the top two floors of the building was missing, rather than the entire structure collapsing. Images showed a fire truck at the scene, with a writer from the Huffington Post reporting that firefighters had to enter the building to help people out. The fire department later said that no one had been hurt. “There are no injuries or people trapped at 92 8th Ave building collapse, which involved the facade of the structure,” it said in a tweet. “Firefighters went in and rescued the residents. Some residents said same thing happened to same building 20 years ago,” said Meg Robertson, a reporter at HuffPost Live. She posted several pictures of the scene on her Twitter account. The building, 92 8th Avenue, is located between 14th and 15th streets in Manhattan. The main threat to buildings in New York City had been expected to come from flooding, with a mandatory evacuation order in place in many places along Manhattan’s coastline. Earlier a crane on top of the One 57 building, which is under construction on west 57th street further north in Manhattan, appeared to come loose from its bearings in high winds. Pictures showed the crane hanging upside down from the top of the building, which is set to be luxury flats. Police and the fire department evacuated all buildings north and south of 57th street, between Sixth and Seventh avenues, CNN reported. The Le Parker Meridien hotel on West 56th Street was also evacuated, according to reports, with guests being transferred to a different hotel. In New York bridges across the East River have been closed, including the Brooklyn, Manhattan and Williamsburg bridges, with people warned to stay inside.
Today
Landslide
Canada
Province of British Columbia, Langley [7700 block of 264th Street]
City workers in Langley, B.C., are cleaning up after two mudslides stuck on Wednesday morning, forcing the evacuation of one home and the closure of 264th Street between 72nd and 84th avenues. Just after 5 a.m. PT, mud rushed down the side of a steep slope and crossed a rural stretch of the 7700 block of 264th Street, moving a cement barrier. The slide also covered the side of a home below the road. No one was injured and there was only minor damage to the house. About 100 metres of 264th Street has been closed for much of the morning. It’s not clear when the road might reopen. While officials were cleaning up the first slide, officials confirmed they were responding to reports of a second landslide in the municipality, this time at 252A Street and 72nd Avenue. The second slide was much smaller and did not affect any roads or homes, city officials said. City officials say small mudslides on the hills into Glen Valley are common this time of year. A rainfall warning is in effect in the area with between 10 and 20 millimetres expected to fall throughout the day.
LONGVIEW, Wash. (AP) — Oregon State University researchers have found traces of radioactive cesium from last year’s Japanese nuclear reactor disaster in West Coast albacore tuna.
The amount is far too small to harm people who eat the fish, the scientists said.
Scientists from the university and the National Oceanic and Atmospheric Administration collected and tested fish caught off the West Coast before and after the March 2011 Japanese earthquake and tsunami that caused a nuclear reactor to release radioactive material, the Longview Daily News (http://bit.ly/QIcdV8) reported.
The team’s findings are in line with work by researchers in California, who announced in May that they had found traces of radioactive cesium in bluefin tuna caught off the southern coast.
“We’re still processing new fish, but so far the radiation we’re detecting is far below the level of concern for human safety,” said Delvan Neville, a graduate researcher with OSU’s Radiation Health Physics program and a co-investigator on the project.
Albacore tuna is a $41 million business in the Pacific Northwest, and fishermen from the region caught about 10,000 tons last year, according to the U.S. Department of Commerce.
Washington fishermen accounted for about 53 percent of the haul, and the remainder came through Oregon docks.
The U.S. Environmental Protection Agency, Food and Drug Administration and NOAA have jointly stated they have “high confidence” in the safety of U.S. seafood products because the radiation levels are so low.
The OSU team said its findings could reveal information about where Pacific albacore tuna travel and how the ocean’s ecosystem can be linked to events thousands of miles away.
Oct 26 (Reuters) - U.S. electric companies from Maine to
Florida are preparing for heavy wind, rain and flooding that
could take down power lines and could close some East Coast
nuclear plants early next week when Hurricane Sandy comes
ashore.
    There are more than a dozen nuclear plants near Hurricane
Sandy's path in North Carolina, Virginia, Maryland, New Jersey,
Pennsylvania, New York and Connecticut, providing power to
millions of customers in the region.
    The following lists the nuclear reactors and utilities in
Sandy's potential path.

 Plant                 State              Size    Company
                                          (MW)

 Brunswick             North Carolina     1,858   Duke

 Surry                 Virginia           1,638   Dominion

 North Anna            Virginia           1,863   Dominion

 Calvert Cliffs        Maryland           1,705   Constellation

 Salem                 New Jersey         2,332   PSEG

 Hope Creek            New Jersey         1,161   PSEG

 Peach Bottom          Pennsylvania       2,244   Exelon

 Limerick              Pennsylvania       2,264   Exelon

 Three Mile Island     Pennsylvania        805    Exelon

 Susquehanna           Pennsylavnia       2,450   PPL

 Oyster Creek          New Jersey          615    Exelon

 Indian Point          New York           2,063   Entergy

 Millstone             Connecticut        2,102   Dominion

 Pilgrim               Massachusetts       685    Entergy

 Seabrook              New Hampshire      1,247   NextEra

 Vermont Yankee        Vermont             620    Entergy

 (Reporting By Scott DiSavino; Editing by Bob Burgdorfer)
Nuclear reactors in the mid-Atlantic and Northeast are being monitored for potential impacts by Hurricane Sandy, a Category 1 storm that may strike anywhere from Delaware to southern New England.
“Because of the size of it, we could see an impact to coastal and inland plants,” Neil Sheehan, a spokesman based in King of Prussia, Pennsylvania, for the U.S. Nuclear Regulatory Commission, said by phone. “We will station inspectors at the sites if we know they could be directly impacted.”
Men walk amid the destruction caused by hurricane Sandy east of Havana in Mayari, Cuba. Source: AFP/Getty Images
The NRC met earlier today to discuss the necessary precautions to take for the storm, Sheehan said. Plants must begin to shut if wind speeds exceed certain limits, he said.
As of 2 p.m. New York time, Sandy had winds of 75 miles (121 kilometers) per hour, according to the National Hurricane Center in Miami. It was about 430 miles south-southeast of Charleston, South Carolina, moving north at 7 mph.
The current Hurricane Center track calls for the system to come ashore just south of Delaware Bay on Oct. 30.
Contingency Plans
Nuclear plants in the projected path of the hurricane include North Anna and Surry in Virginia, Calvert Cliffs in Maryland, Hope Creek and Salem in New Jersey, Indian Point in New York and Millstone in Connecticut. The NRC is considering enhancing inspector coverage of these reactors, Sheehan said in an e-mail today.
Public Service Enterprise Group Inc. (PEG) must shut all units at the Salem and Hope Creek plants two hours before the onset of hurricane-force winds greater than 74 mph, according to Sheehan. An “unusual event” would be declared if the winds are sustained for greater than 15 minutes or if the water level reaches 99.5 feet or higher, he said. Such an event is the lowest of four level of emergency used by the commission.
Salem Unit 2 is currently shut for refueling, while Unit 1 was operating at 83 percent of capacity today during maintenance on the circulating water system. Hope Creek ran at full power. The three units have a combined capacity of 3,365 megawatts.
“We are in phase one of our severe-weather plan,” Joe Delmar, a company spokesman, said in an e-mail responding to questions. “This includes inspecting, removing and securing outside areas for potential missiles, objects that could go airborne, and staging of emergency equipment and supplies.”
Millstone Reactor
Nuclear generation in the Northeastern region dropped 1.1 percent to 18,016 megawatts, with seven plants shut, an NRC report today showed.
Dominion Resources Inc.’s Millstone plant is monitoring Sandy’s progress and preparing to adjust staff as it comes closer, according to Ken Holt, a plant spokesman based in Richmond, Virginia. The plant must shut if winds reach 90 mph.
“We would shut down in advance of the storm if they were expected to be 90 miles per hour at the site,” Holt said by phone today. “Floods and high winds are a threat because they can knock off off-site power and we’d then need to activate emergency generators for power to put the plant to safe conditions.”
Today
Nuclear Event
USA
State of Minnesota, Red Wing [Prairie Island Nuclear Power Plant]
Xcel Energy Inc. says its Prairie Island nuclear plant near Red Wing declared an “unusual event” after some security equipment failed. The Minneapolis-based utility says the event happened around 2:15 p.m. Wednesday and was declared over just before 6 p.m. Xcel says there was no release of radioactive material and that there is no danger to the public or plant employees. Plant officials made the declaration after some security equipment temporarily failed. The equipment has been restored, and plant officials are investigating the cause. The plant maintained security during the event. Xcel says it notified federal, state and local officials. The declaration is the lowest of four emergency classifications. Prairie Island’s Unit 2 continues to operate at full power. Unit 1 remains offline has part of a scheduled refueling outage.
The death toll of the deadly Marburg hemorrhagic fever in Uganda has risen to eight and nine other people have tested positive of the highly infectious diseases, a top ministry of health official said. Christine Ondoa, Minister of Health told reporters on Monday that the latest patient died on October 27 at an isolation ward at Rushoroza Health Centre, in the western Ugandan district of Kabale, the epicenter of the outbreak. The disease broke out on October 4 in Kabale. Five people have tested positive of the highly infectious viral hemorrhagic fever in Kabale, two others in the capital Kampala and another two in the western district of Ibanda. “To date, the death toll of both the probable and confirmed cases stands at eight. Since the onset of the outbreak, we have collected a total of 45 samples of which nine were confirmed positive,” said Ondoa. She said the ministry has established temporary isolation facilities in Kabale, Mbarara, Ibanda and Kampala to accommodate the suspected and confirmed cases. “We have assembled a team of experts to work in the newly established isolation facilities and they are expected in these districts today. We also plan to undertake infection control procedures in these facilities as safety measures for the workers and the admitted patients,” said Ondoa. A total of seven student nurses who attended to a Marburg patient at Ibanda Hospital and died on October 24 at Mbarara Regional Hospital have been quarantined. The ministry is also monitoring a total 436 people who had contact with the patients. “Those being monitored got into contact with either the dead or confirmed cases. The team continues to monitor them on a daily basis for possible signs and symptoms of this highly infectious disease until they have completed 21 days without showing any signs and symptoms,”Ondoa said.
Officials at San Quentin State Prison say the prison is on a medical lockdown after at least two inmates became sick with chickenpox. Prison spokesman Lt. Sam Robinson says the prison has been locked down since last Friday, with only employees being allowed to enter and leave the facility. He could not say when the lockdown would be lifted. Robinson says the last time there was a medical lockdown at the prison was in March of last year when at least four inmates became sick with chickenpox. The Centers for Disease Control describes chickenpox as a “very contagious disease” that spreads easily from infected people to others who have never had chickenpox or have never received the chickenpox vaccine. San Quentin, located north of San Francisco, is the oldest prison in California. It houses about 3,800 inmates.
Biohazard name:
Chicken Pox
Biohazard level:
2/4 Medium
Biohazard desc.:
Bacteria and viruses that cause only mild disease to humans, or are difficult to contract via aerosol in a lab setting, such as hepatitis A, B, and C, influenza A, Lyme disease, salmonella, mumps, measles, scrapie, dengue fever, and HIV. “Routine diagnostic work with clinical specimens can be done safely at Biosafety Level 2, using Biosafety Level 2 practices and procedures. Research work (including co-cultivation, virus replication studies, or manipulations involving concentrated virus) can be done in a BSL-2 (P2) facility, using BSL-3 practices and procedures. Virus production activities, including virus concentrations, require a BSL-3 (P3) facility and use of BSL-3 practices and procedures”, see Recommended Biosafety Levels for Infectious Agents.
A previously unknown disease which has claimed more than 30 lives in Sudan’s troubled Darfur region this month has been identified as yellow fever, the World Health Organization (WHO) said on Tuesday. Preparations for a mass vaccination campaign are now underway. The outbreak was first detected early this month when a number of people in the central and southern regions of Darfur became ill and eventually died. Sudanese media said the victims suffered from a number of symptoms, including diarrhea, vomiting, and bleeding from both the mouth and nose. Tarik Jasarevic, a spokesman for the World Health Organization (WHO), on Tuesday said it had been informed by Sudan’s Federal Ministry of Health (FMoH) that the outbreak is being caused by yellow fever. Since the first week of October, a total of 84 suspected cases, including 32 deaths, have been reported in the districts of Azoom, Kass, Mershing, Nertiti, Nyala, Wadi Salih and Zalingei. “FMoH said that the immediate priority is to control the vector, reinforcing the disease surveillance system and raising public awareness on the prevention and control of this disease,” Jasarevic said. “Preparations for a mass vaccination campaign are underway to vaccinate the at risk population in Darfur.”According to Darfur radio station Dabanga, however, at least 37 people are believed to have died as a result of the disease while 125 others have been infected. The radio station quoted a resident as saying that local authorities were slow to react and did not immediately take necessary action to contain the outbreak. “FMoH, WHO, as well as health partners are working on ground to ensure timely containment of the outbreak,” Jasarevic added. There is no cure for yellow fever, which is an acute viral haemorrhagic disease transmitted by infected mosquitoes. Treatment is aimed at reducing the symptoms for the comfort of patients, and measures often taken include supportive care to treat dehydration and fever and blood transfusion if needed. “It is a preventable disease with symptoms and severity varying from case to case,” Jasarevic explained. “Protective measures like the use of bed nets, insect repellent and long clothing are considered the best methods to contain an outbreak. Vaccination is the single most important measure for preventing yellow fever.”
Biohazard name:
Yellow Fever
Biohazard level:
2/4 Medium
Biohazard desc.:
Bacteria and viruses that cause only mild disease to humans, or are difficult to contract via aerosol in a lab setting, such as hepatitis A, B, and C, influenza A, Lyme disease, salmonella, mumps, measles, scrapie, dengue fever, and HIV. “Routine diagnostic work with clinical specimens can be done safely at Biosafety Level 2, using Biosafety Level 2 practices and procedures. Research work (including co-cultivation, virus replication studies, or manipulations involving concentrated virus) can be done in a BSL-2 (P2) facility, using BSL-3 practices and procedures. Virus production activities, including virus concentrations, require a BSL-3 (P3) facility and use of BSL-3 practices and procedures”, see Recommended Biosafety Levels for Infectious Agents.
A magnetic piece of rock stirred up controversy last week, but scientists confirmed, and reconfirmed, that the mysterious object in Novato residents Lisa and Kurt Webberâs backyard was a meteorite. And to prove it, a second was discovered just miles from the Webbersâ home. Webber gave the meteorite to her neighbor Glenn Rivera as a birthday gift. He helped her analyze the chunk before calling scientists. The meteorite broke off from the meteor shower that blazed over the night sky at approximately 7:44 p.m. on Oct. 17. It also happened to be Riveraâs birthday. âAs a result, Glenn was asked by the scientific team to ride in the airship Eureka from Moffett Field on Friday,â said Leigh Blair, Riveraâs mother. âThey flew over Novato and all the way up to Lake Berryessa, following the calculated trajectory of the meteor, looking for signs of larger meteorites on the ground.â Peter Jenniskens, the meteor scientist at the Seti Institute, a nonprofit scientific and education organization that has projects sponsored by NASA and other foundations and research groups, at first dismissed the first rock because the surface appeared strange and weathered, unlike most meteorites. But everything changed when a second rock showed small specks of what seemed to be metal, when observed under a microscope. Brien Cook, a meteorite hunter and Sacramento resident, found the second rock in the Novato area, but too dismissed it as a meteorite until the two chunks were compared. After cutting it open and looking inside, he knew he had found an extraterrestrial treasure. Cook is offering one chip of his meteorite on eBay. It weighs 6.6 grams, and objects like it regularly sell for approximately $100 a gram, he said. Lisa Webber, a University of California San Francisco nurse, found the meteorite in her backyard on Oct. 20. She returned the piece to Jenniskens, and he will send samples of both rocks to a noted meteorite expert Professor Alan E. Rubin of the Institute of Geophysics and Planetary Physics at UCLA.
Two men were transported to the hospital Wednesday afternoon after a bees’ nest was disturbed when one of the men, an unidentified DirectTV employee, was working on a home in the 40000 block of W. Magnolia Road. “It was terrible,” Phoebe Lechuga, one of the home’s five residents, said. “They were flying everywhere.” Lechuga’s 33-year-old son, Resugio Furwilder, was also transported to the hospital. Furwilder went outside to help the DirectTV worker and was stung himself, Lechuga said. Her daughter, Vanessa Lechuga, 27, was also stung but was not taken to the hospital. Lechuga said at first the worker thought there were only a few bees and didn’t come inside after the first stings.
Biohazard name:
Bees Attack (Non-Fatal)
Biohazard level:
0/4 —
Biohazard desc.:
This does not included biological hazard category.
New Jersey environmental officials say 336,000 gallons of diesel fuel spilled after a storage tank was lifted and ruptured from the surge from superstorm Sandy. The Coast Guard says all the spilled oil is believed to be contained by booms put in the water. Officials said today the spill happened Monday night at the Motiva oil tank facility in Woodbridge. Coast Guard spokesman Les Tippets says a secondary tank caught most of the oil and that the liquid that escaped moved into the Arthur Kill, the waterway separating New Jersey from New York’s Staten Island. New Jersey Department of Environmental Protection spokesman Larry Ragonese says the company reported the spill and hired contractors to clean it up.
Three people from North Laurel, Maryland have been taken to the hospital Tuesday morning with carbon monoxide poisoning, caused by a generator running inside their house. Authorities reported that Howard County Fire crews and paramedics found a man and two women inside the home in Brevard Street after responding to a 911 call which was made by one of the women. The victims suffered elevated levels of carbon monoxide. According to a spokesman from the Howard County Department of Fire and Rescue Services, the three were transported to the University of Maryland Shock Trauma Center in Baltimore. The two females have been released on Tuesday morning but the male, who was in critical condition, remained in the hospital for further treatment. The spokesman confirmed that all three patients underwent therapy in the hyperbaric chamber at the University of Maryland Shock Trauma Center. The male patient is scheduled to receive another hyperbaric therapy. Police said the firefighters discovered a generator operating at the bottom of the stairs on the ground level of the residence. It was placed in a doorway leading to the garage, but the garage door was closed, restricting ventilation. Firefighters later confirmed that the amount of carbon monoxide inside the house was 30 times more than the normal level.
01.11.2012
HAZMAT
USA
State of Kentucky, Louisville [Near the Dixie Highway]
Emergency officials have evacuated a few dozen homes near a derailed train in southern Jefferson County over concerns of hazardous material leaks. The Paducah & Louisville Railway train derailed just after 6 a.m. EDT Monday near Dixie Highway. Emergency officials are asking residents within a 2 ½-mile radius of the scene to stay inside their homes until they are told they can leave. Beuchel Fire assistant chief Rick Harrison says the train has a “small leak” of butadiene, which is a chemical used in the manufacturing of rubber. No other leaks have been found. Tom Garrett, president of P&L Railway, says the train was on its way to Louisville from Paducah with a total of 57 cars. He says company officials have not yet been able to get to the scene because of safety concerns. Garrett says the two crew members on the train were not hurt. Officials say eight of the 40 cars on the train were off the track.
[In accordance with Title 17 U.S.C. Section 107, this material is distributed without profit, for research and/or educational purposes. This constitutes ‘FAIR USE’ of any such copyrighted material.]
A 5.3 magnitude earthquake hit Alexandria early on Friday morning.
Hatem Oada, head of the National Institute for Astronomical and Geophysical Research, said in a statement to the state-run MENA news agency that regional seismic networks indicate the tremor hit at 5:35 am, Cairo time. No damages or injuries have been reported.
The epicenter of the quake was in the Mediterranean Sea, north of the Delta. This region is not typically seismically active, Oada said.
SYDNEY, Oct 21, 2012 (AFP) – – A strong 6.2-magnitude earthquake rattled the South Pacific island of Vanuatu Sunday, seismologists said, but there were no immediate reports of damage and no tsunami warning was issued.
The quake struck at 10:00 am (2300 GMT Saturday) 500 kilometres (310 miles) northwest of the capital Port Vila at a depth of 35 kilometres, the United States Geological Survey said.
The USGS had earlier put the magnitude at 6.6.
Vanuatu lies on the so-called “Pacific Ring of Fire”, a zone of frequent seismic activity caused by friction between shifting tectonic plates.
It has been rocked by several large quakes in recent years, averaging about three magnitude 7.0 or above incidents every year without any major damage.
Biggest earthquakes during the last 48 hours
Size Time Quality Location
5.2 21 Oct 01:25:15 Checked 19.3 km NNE of Siglufjörður
4.9 20 Oct 22:53:46 38.3 116.8 km NE of Kolbeinsey
4.8 21 Oct 00:10:20 Checked 20.4 km NNE of Siglufjörður
4.4 21 Oct 01:03:42 90.0 20.1 km NNE of Siglufjörður
4.3 21 Oct 02:20:01 90.0 27.5 km NNE of Siglufjörður
4.1 21 Oct 00:10:21 90.0 16.6 km NE of Siglufjörður
A verdict in the trial of seven top Italian scientists for manslaughter for underestimating the risks of an earthquake which killed 309 people in L’Aquila, central Italy, in 2009, is expected on Monday.
“The verdict is expected on October 22,” said Enzo Musco, a lawyer for Professor Gian Michele Calvi who is one of the defendants.
The prosecutor’s office has asked for sentences of four years in prison for each of the seven who were all members of the Major Risks Committee.
The committee met in the central Italian city on March 31, 2009 — six days before the powerful earthquake devastated the region — after a series of small tremors in the preceding weeks had sown panic among local inhabitants.
Prosecutor Fabio Picuti said the experts had provided “an incomplete, inept, unsuitable and criminally mistaken” analysis after that meeting, which reassured locals and prevented them from preparing for the quake.
The experts had said after their meeting that they could not predict an earthquake but urged local authorities to ensure safety rules were respected.
The seven include Enzo Boschi, who at the time was the head of Italy’s National Institute for Geophysics and Vulcanology.
The La Repubblica daily on Friday also reported on a separate case against an engineer who lost his daughter in the earthquake but was put on trial for failing to respect anti-quake regulations in one of his constructions.
Diego De Angelis, 67, was convicted on Thursday and sentenced to three years in prison.
Mount Merapi erupting in 2010. (JG Photo/Boy T Harjanto).
Solo, Central Java. A lava dome that formed on top of Mount Merapi following its 2010 eruption has collapsed, prompting volcanology officials to issue a warning on Friday of a possible deadly cold lava stream on the mountain slope.
Tri Mujianto, from the Merapi mountain observatory in Jrakah, in the Selo subdistrict of Boyolali, said the lava dome had disappeared but he could not say precisely when.
“The dome is now no longer there but we were not able to monitor when it collapsed. Some [of the material] may have fallen inside [the crater] while some may have flowed into the channel of Apu River,” he said.
They have not been able to determine the cause of the collapse, as there has been no rain in the crater area for days. They also haven’t been able to estimate the volume of cold lava in the collapsed dome.
Tri said the alert status for Merapi remained at the normal level but warned that should rains fall over the crater, cold lava stream may flow down through natural river channels. A cold lava stream is congealed lava and other volcanic mud and debris flushed down the slopes of a volcano by heavy rains.
“Entering the rainy season, the frequency of cold lava stream is rising. We have checked the conditions at the craters several times and it appears to still be very much unstable. People on the slopes of Merapi, especially those living on the banks of rivers originating from the peak, should remain alert,” he said.
Meanwhile, Subandriyo, the head of the Volcanology office in Yogyakarta, said that parts of the lava dome facing Boyolali district had collapsed, and ventured that it was due to its fragile condition.
“The collapse was not directly recorded because there were so many small deflagrations. On the scale, they did not even reach one kilometer down the slope,” Subandriyo said.
He warned that rains with intensity of more than 20 millimeters and lasting more than two hours were enough to trigger flash floods of cold lava down the mountain’s slope.
Contact Information:
U.S. Department of the Interior, U.S. Geological Survey
Office of Communications and Publishing
12201 Sunrise Valley Dr, MS 119
Reston, VA 20192
FLAGSTAFF, Ariz. — Experts in volcano hazards and public safety have started a conversation about volcanoes in the southwestern United States, and how best to prepare for future activity. Prior to this meeting, emergency response planning for volcanic unrest in the region had received little attention by federal or state agencies.Though volcanic eruptions are comparatively rare in the American Southwest, the states of Arizona, Colorado, New Mexico, Nevada, and Utah host geologically-recent volcanic eruption deposits and are vulnerable to future volcanic activity. Compared with other parts of the western U.S., comparatively little research has been focused on this area, and eruption probabilities are poorly understood.“A volcanic eruption in the American southwest is an example of a low-probability, but high-impact event for which we should be prepared to respond,” said USGS Director Marcia McNutt. “No one wants to be exchanging business cards during an emergency, and thus a small investment in advance planning could pay off in personal relationships and coordination between scientists and first responders.””The goal of the conference is to increase awareness of volcanism and vulnerabilities in the American Southwest, and to begin coordination among volcano scientists, land managers, and emergency responders regarding future volcanic activity,” said Dr. Jacob Lowenstern, one of the organizers of the conference, and the U.S. Geological Survey Scientist-In-Charge of the Yellowstone Volcano Observatory. “This is the first time these federal, state, and local agencies have met to discuss their roles, responsibilities, and resources, should an eruption occur.”The “Volcanism in the American Southwest” conference on Oct. 18-19 in Flagstaff, Ariz. was organized by the USGS, Northern Arizona University, University at Buffalo, and New Mexico Bureau of Geology and Mineral Resources, the meeting included interdisciplinary talks, posters, and panel discussions, providing an opportunity for volcanologists, land managers, and emergency responders to meet, converse, and begin to plan protocols for any future volcanic activity.
More information about the meeting, including presentation abstracts, is online.
Indonesia issued today an official alert at the straight of Sunda for the increasing activity of Mt. Anak Krakatoa. Dense clouds surrounding the mountain blind it from human eyes while fishers and tourists must remain at a distance of two kilometres, said Andi Suardi, head of the watch deport in Hargopancuran. Just 30 days earlier, Anak Krakatoa spewed lava and other material 2,000 meters high above the peak; there have been since hundreds of quakes in the area and black clouds continue to veil the mouth of the mountain. Situated between Sumatra and Java Islands, Anak Krakatoa emerged from sea late in the 1930s and from 1950, growing an average of five meters per year. Science has confirmed another five active volcanos and the authorities have activated the alert in their vicinity, and Indonesia has more than 400 volcanos and some 130 remain active.
A huge wave dragged a Polish woman to her death as she walked on a Spanish beach with a friend on Friday in a storm that also left a young French man missing.
As the powerful storm smashed into northeastern Catalonia, a big wave snatched away the 37-year-old Polish woman in the holiday resort of Lloret del Mar in the early hours, emergency services officials said.
“She was walking along the beach with a friend when she was surprised by a wave that dragged her in,” said a police spokesman.
Her corpse was found five nautical miles down the coast near Blanes later in the morning, officials said, and she was identified by her clothes and jewellery.
The French man, described only as a young person, disappeared after going fishing in a rocky area of the coast of Roses, about 100 kilometres (60 miles) further north.
Only his fishing rod was recovered.
Emergency services were alerted by the French man’s friend after he went fishing in a rocky area known as Carretera de Canyelles and failed to return, an emergency services spokesman said.
“This morning we found his fishing rod in a rocky area and began a search of the land and sea with helicopters and specialized vehicles,” he said.
Catalonia’s emergency services declared a state of alert on Friday because of forecasts for the weekend of heavy rain, rough seas with waves higher than 2.5 metres (eight feet) and strong winds.
The authorities warned people to avoid breakwaters, coastal paths and beaches affected by the waves.
Storms also beat down on the neighbouring northern Spanish region of Aragon, causing floods in the province of Zaragoza.
Spain has been punished by extreme weather in the past year.
After the driest winter in 70 years, forest fires scorched more than 184,000 hectares (454,000 acres) of land in the first nine months of 2012, the largest amount in a decade, according to government figures.
While the roads remained clear of any snow, ewes and lambs picked their way through the icy crust
By Hamish Clark
It’s been a bitterly cold end to Labour Weekend, with bad weather sweeping across the South Island.
Snow fell in Canterbury from Lake Tekapo up to Methven, while over on the West Coast, a tornado flattened an old theatre in the northern township of Hector.
The storm arrived at the break of dawn and blanketed the countryside. Temperatures dived in the wintry blast to near freezing – a turnaround on yesterday’s 20degC highs.
Five-to-10cm of snow covered the Canterbury Foothills, falling as far south as Twizel and Tekapo, cutting short holiday-makers’ long weekend away.
One by one, caravans, campervans and boats joined the queue home, although one classic bike was left on the side of the road.
“We have just come back from Twizel on the old motorbike and been in the snow,” says motorcyclist Grant Jones. “I have just blown a head casket on her, so she is on the trailer now until home.”
While the roads remained clear of any snow, ewes and lambs picked their way through the icy crust.
“[We have] few lambing ewes and a few sorry looking lambs,” says farming student Hamish Forrester.
Over on the West Coast, there was not much left of an old Hector theatre and dancehall north of Westport – a tornado flattened it in the middle of the night.
But if Tourism New Zealand ever wanted the perfect promo, this was it – visitors say they loved seeing the snow in Tekapo.
Brett Dutschke, Monday October 22, 2012 – 17:09 EDT Much of central Australia is baking in heat not experienced at this time of year in decades.
Temperatures have been reaching the high thirties each day for about a week, the longest it has been this hot at this time of year in more than 20 years.
Today is Yulara’s eighth day of reaching 35 degrees or more. In more than 20 years of record there hasn’t been a longer run of such heat at this time of year.
Alice Springs has reached at least 38 degrees in each of the past six days, beating the previous September/October record of four days, most recently set in 2008.
Across the border in far southwest Queensland, Birdsville has almost equalled its longest run of 40-degree days for this time of year. Sunday was the fourth day of 40 or more. This is only one day short of the October record of five days, set in 1988. Monday had only reached 39.4 degrees by 3:30pm. Birdsville’s records go back to the 1950s.
This heat has a few more days to go, at least until Wednesday in Yulara and Alice Springs and until Thursday in Birdsville, when a cooler southerly change is due. This change will drop temperatures by about 10 degrees.
Before the cooler change arrives Alice Springs is on target for nine consecutive days of 35 degrees, also a record for this time of year.
The persistent snow and rain hit the northwestern part of Xinjiang Uygur Autonomous Region, causing a dramatic temperature drop. This has resulted in the freezing of the road surface on several sections of Sayram Lake-Guozigou Highway, causing traffic congestion in the direction to Urumqi, capital of Xinjiang, northwest China.
A hailstorm has left a trail of destruction, damaging furniture and ripping off roofing sheets at Lumanto Basic School in Lufwanyama. The storm, which happened last Friday, damaged a 1×2 classroom block at the school, whose window panes and part of the wall collapsed. Lufwanyama district education board secretary Hilda Kulelwa confirmed the tragedy in an interview yesterday. Ms Kulelwa said the hailstorm struck when schoolchildren were on lunch break and no one was hurt. “We had a very strong wind yesterday (Friday) which ripped off iron sheets at Lumanto Basic School. The desks are also damaged. The storm struck as soon as the grade nines finished their practical examinations,” she said. Ms Kulelwa said the damage left by the hailstorm will affect the school timetable as some classes will have to be rescheduled until the affected block is rehabilitated. She said the matter has been reported to the district commissioner and the provincial education officer. And Lufwanyama district commissioner Alex Kalela said his office will write to the provincial permanent secretary, requesting for the rehabilitation of the school as soon as possible. “The children are writing their final examinations and we don’t want their timetable to be affected. We are appealing to the Disaster Management and Mitigation Unit to quickly repair the roofs before the rains start,” Mr Kalela said.
Ekurhuleni metro police ran for cover as hail the size of golf balls shattered their car windscreens and side mirrors, spokesman Kobeli Mokheseng said. The hail “came down like a ton of bricks” for about five minutes on Saturday between 2pm and 3pm, he said. “Metro police officers who were patrolling… ran for cover following heavy rain and winds blowing uncontrollably,” said Mokheseng. He said metro police were still assessing the damage, and that no one was hurt. The hail appeared to have been heaviest in Edenvale, Midrand, Germiston, Boksburg and Benoni. People took to the social networking site, Twitter, to express their dismay at the damage it caused. “What a scary experience yesterday really bad weather hail were so big damaged my younger sister’s kids playroom,” a Twitter user wrote. “Tennis ball sized hail at our place on Saturday crazy.” Another Twitter user wrote: “Talk about hail damage… 12 windows KO!!!!”. “Every car in the East Rand that wasn’t under cover or was on the road is damaged. Mine has 3 dents on boot,” wrote another person. “My mom’s Clio took a beating… Hail damage all over! It went right through the body work.” The Sunday Times showed a photograph of a Benoni man, Jimmy Sales, inspecting his car’s shattered rear windscreen under the headline “This weather is insane”. The newspaper carried an inset picture of a hailstone almost the size of a cricket ball which was among those which fell at the Glendower Golf Club, reportedly damaging several cars in the parking lot and gouging chunks out of the green.
22.10.2012
Flash Flood
Bulgaria
Province of Burgas, [Varvara and Ahtopol, Municipality of Tsarevo]
BLACKWELL, Okla. — Transportation officials say a stretch of Interstate 35 in northern Oklahoma is open again after a massive dust storm triggered a multi-vehicle accident.
Oklahoma Department of Transportation spokesman Cole Hackett said the 8-mile stretch of Interstate 35 reopened Thursday evening.
Transportation workers had been called in earlier Thursday to close the highway between U.S. 60 and Oklahoma 11. The area just south of the Kansas state line remained closed for several hours as crews cleared debris from the crash and waited for winds to die down.
weather.com
The Oklahoma Highway Patrol said visibility was less than 10 feet as gusts as high as 55 mph blew dust over the roadway Thursday afternoon.
No one was killed in the multi-vehicle accident, though Blackwell Police Chief Fred LeValley said nine people were injured.
In a scene reminiscent of the Dust Bowl days, choking dust suspended on strong wind gusts shrouded Interstate 35, which links Dallas and Oklahoma City to Kansas City, Mo. Video from television station helicopters showed the four-lane highway virtually disappearing into billowing dust on the harsh landscape near Blackwell, plus dozens of vehicles scattered in the median and on the shoulders.
“I’ve never seen anything like this,” said Jodi Palmer, a dispatcher with the Kay County Sheriff’s Office. “In this area alone, the dirt is blowing because we’ve been in a drought. I think from the drought everything’s so dry and the wind is high.”
The highway patrol said the dust storm caused a multi-car accident, and local police said nearly three dozen cars and tractor-trailers were involved. Blackwell Police Chief Fred LeValley said nine people were injured, but there were no fatalities.
State transportation workers were called into to close the highway between U.S. 60 and Oklahoma 11, an 8-mile stretch of the cross-country roadway.
The area is just south of the Kansas state line in far northern Oklahoma. Interstate 35 runs from the Mexican border in south Texas to Duluth, Minn.
A red flag fire warning was in place for parts of northern Oklahoma on Thursday, as is a blowing dust advisory.
The National Weather Service forecast for the area said winds would subside to 20 mph or lower overnight but that gusts as high as 28 mph could continue. Calm winds were expected by Friday night.
The area has suffered through an extended drought and many farmers had recently loosened the soil while preparing for the winter wheat season.
“You have the perfect combination of extended drought in that area … and we have the extremely strong winds,” said Gary McManus, the Oklahoma associate state climatologist.
“Also, the timing is bad because a lot of those farm fields are bare. The soil is so dry, it’s like powder. Basically what you have is a whole bunch of topsoil waiting for the wind to blow it away. It’s no different from the 1930s than it is now.”
Steve Austin, a Kay County commissioner, said visibility was terrible.
“It looked like a huge fog was over the city of Ponca City,” he said. “We’ve had dust storms before, but I don’t remember anything of this magnitude in years.”
There are no flooded and isolated settlements after the heavy rain in the coastal municipality of Tsarevo on Sunday. A bridge has been hit by a tidal wave on the road between the southeastern village of Varvara and town of Ahtopol, municipality mayor Georgi Lapchev said. He added that the road was closed and experts were working to restore the damaged section. He said there was a roundabout route. He noted that Sunday’s heavy rain caused damages and other settlements might experience problems as well.
Flash floods in Papua in eastern Indonesia on Sunday night has displaced over 1,000 people and damaged over 200 houses and other public facilities, an official of disaster relief agency said here on Monday. Spokesman of the National Disaster Management and Mitigation Agency Sutopo Purwo Nugroho said that heavy rains at mountainous area led to overflow of Eranouli river and caused flash floods in Eranouli village in Panja district at about 21:00 pm Jakarta time (1400 GMT). “Over 200 houses and scores of office building have been damaged and about 1,000 people have escaped to higher grounds,” he said. The waters inundated the village by up to 2 meters high, said Sutopo. The waters also damaged a health clinic and a clean water facility, he said.
A flash flood triggered by torrential rain has killed at least nine construction workers and left 15 others missing and feared dead in India’s remote northeast. Karma Zyatso, chief secretary of Sikkim state, says the workers, who lived in camps, were swept away by the swirling waters of a flooded river Friday in Chungthan, a small town in the mountainous region. Zyatso said Sunday that authorities had recovered nine bodies and were searching for the 15 missing workers, who were building roads.
At least 11 Peruvians were killed and 10 more are missing after a mudslide Wednesday slammed into a small village in a mountainous jungle region, officials said.
Those killed in the landslide include five children, Ronald Garcia, the provincial mayor, told RPP national radio network.
The avalanche of mud and rocks swept away 24 homes when it crashed into the village of El Porvenir, in the northern department of San Martin, at dawn.
The head of Peru’s Civil Defense Institute, Alfredo Murgueytio, told the daily El Comercio in an interview posted online that rescuers pulled 11 bodies from the rubble, and that 10 people are still missing.
Mayor Garcia said that some of the missing people may have fled into the hills to save their lives.
“Whole families are missing,” said Garcia. More than 80 families live in the village, he said.
El Porvenir residents are mostly coffee farmers, officials said.
Heavy rain in Peru’s Andean region in recent weeks has triggered several landslides.
Tornadoes reportedly touched down Monday afternoon in three Northern California counties, knocking down some trees and power lines as a powerful storm blew over the region. Officials said no injuries were reported by the tornadoes, which were caused by the first storm of the season in Northern California. The National Weather Service said preliminary reports indicated that the tornadoes touched down in Sutter, Yuba and Butte counties. The unstable weather prompted the agency to issue a tornado warning for Placer County. Officials said they received reports from residents of toppled trees and power lines and damage to rooftops after shingles were ripped off by powerful winds.
22.10.2012
Tornado
USA
State of Pennsylvania, Fern Glen [Lancaster County]
Authorities have confirmed that a tornado caused a pavilion to collapse at a Lancaster County park, injuring 15 people and causing millions of dollars in damage. The EF-1 tornado touched down shortly after 8 p.m. Friday and over the next 10 minutes traveled about 16 miles from Fern Glen to Paradise in Lancaster County, packing maximum winds of 100 to 110 m.p.h., the National Weather Service said Sunday. Officials said several dozen people attending a baseball game near Paradise sought shelter at the 40-by-40-foot pavilion, but high winds collapsed it. Police said 10 to 12 people were injured, but the weather service put the injury total at 15. Authorities said most of the injuries were minor; one person had a broken bone. The tornado damage was sporadic and contained within a larger area of straight-line wind damage, weather observers said. Officials said 50 structures were damaged, including several barns that were destroyed. Two small high-tension towers and thousands of trees were toppled. The county emergency management office estimated damage at $3 million to $5 million.
More than 20 schoolchildren, who have fallen sick in some posh localities of the city, are attending their classes, posing a danger to others kids. Teachers suspect students are afflicted with chickenpox. With blisters over body, fever and tiredness, these students are going to school. The parents say they have to send their children to schools as their absence from the school would affect studies and they might miss the chance of writing their annual test because of falling short of minimum attendance necessary to appear in examination. “I know many children who are suffering from chickenpox, a woman teacher, residing in Arera Colony, told TOI. Instead of quarantining such kids, their parents were sending them to schools, which may trigger the spread of the contagious disease, she said. These kids, some from my locality, are from the posh localities, she said. The health officials should take some steps and visit schools.
Biohazard name:
Chicken Pox
Biohazard level:
2/4 Medium
Biohazard desc.:
Bacteria and viruses that cause only mild disease to humans, or are difficult to contract via aerosol in a lab setting, such as hepatitis A, B, and C, influenza A, Lyme disease, salmonella, mumps, measles, scrapie, dengue fever, and HIV. “Routine diagnostic work with clinical specimens can be done safely at Biosafety Level 2, using Biosafety Level 2 practices and procedures. Research work (including co-cultivation, virus replication studies, or manipulations involving concentrated virus) can be done in a BSL-2 (P2) facility, using BSL-3 practices and procedures. Virus production activities, including virus concentrations, require a BSL-3 (P3) facility and use of BSL-3 practices and procedures”, see Recommended Biosafety Levels for Infectious Agents.
Hospitals in the city have reported cases of rickettsial disease caused by tick bites – a rare infectious fever that is common in hilly regions having a tropical climate. Though doctors said the disease “is very rare” in Delhi, AIIMS has reported at least two cases in its paediatric unit over the past six weeks. Serological reports from the National Centre for Disease Control (NCDC) confirmed that these patients were afflicted with scrub typhus, a variant of rickettsia. Doctors at three private hospitals said they had sent samples to the NCDC and received confirmed reports. Serological tests to confirm the infection is not available in government and most private hospitals. The Director of Health Services (DHS) Dr N V Kamat said the city’s infectious disease surveillance programme was yet to be notified about the cases. Dr V K Paul, the head of paediatrics in AIIMS, said: “The disease is very rare and we do not often get patients suffering from the it in Delhi. But we have received confirmation from the NCDC that two of our patients were diagnosed with Scrub Typhus over the past six weeks.” Dr Atul Gogia, associate consultant of internal medicine in Sir Ganga Ram Hospital said: “We have seen 8-10 cases of scrub typhus in the past month. We used to see a case once a year. This year, there has been a sudden jump. So we are sending every suspected, unexplained fever for tests.” Dr Gogia said patients have a characteristic black mark, known as eschar, left by the mite on the body accompanied by fever.
Biohazard name:
Typhus (Scrub)
Biohazard level:
3/4 Hight
Biohazard desc.:
Bacteria and viruses that can cause severe to fatal disease in humans, but for which vaccines or other treatments exist, such as anthrax, West Nile virus, Venezuelan equine encephalitis, SARS virus, variola virus (smallpox), tuberculosis, typhus, Rift Valley fever, Rocky Mountain spotted fever, yellow fever, and malaria. Among parasites Plasmodium falciparum, which causes Malaria, and Trypanosoma cruzi, which causes trypanosomiasis, also come under this level.
Solar activity has increased to active during the past 24 hours, featuring a long duration M9.1 flare and six C flares.
The M9.1 flare was released by sunspot region 1598 on the east limb of the Sun and peaked at 18:14 UT on October 20th. A high-speed shock wave registered 516 kilometers per second (320 miles per second) observed at 18:15 UT. An associated CME was observed by LASCO C2 at 19:00 UT, but is not directed towards Earth.
Earlier today sunspot region 1596 produced a M1.3 (2003UT), C7.8 (0316UT), and C5.6 (0534UT). Both regions 1596 and 1598 maintain potential for further isolated M-class to X-class activity.
Solar wind speed is expected to increase slightly days one and two under the influence of a coronal hole wind stream. NASA and NOAA has issued a WARNING for high flying aircraft, the ISS, NSSO and NSTAC due to an increased possibility of satellite deep dielectric discharge.
In a flux of high energy charged particles, they penetrate the spacecraft or satellite’s outer surface and bury themselves in dielectric materials such as circuit boards and the insulation in coaxial cables. The buildup of charge will continue until the dielectric strength of the material is exceeded, when a sudden electrical discharge will occur. This miniature lightning stroke can cause permanent damage in the associated or nearby circuitry.
Watch for increased extreme weather events which include earthquake, volcano, tornado, and cyclone activity over the next 48 to 72 hours.
A gray, 2-inch rock that hit a Novato home is the first confirmed chunk of the meteor that dramatically exploded over the Bay Area, a scientist said Sunday. Lisa Webber, 61, found the meteorite in her yard on Saturday, three days after the object fell onto the roof of her home on St. Francis Avenue. She had heard a strange sound at the time but didn’t think twice about it until she read a Chronicle story saying debris from the meteor would be found in a band stretching east of San Rafael toward Napa and Sonoma. Some have marveled at the potential cosmic significance of the fact that it hit a home belonging to a man of the cloth – Webber’s husband, Kent Webber, is pastor at Presbyterian Church of Novato. The space rock, in fact, had first hit the roof of his study, she said. “It’s just science – and it’s cool,” said Lisa Webber, an administrative nurse at UCSF Medical Center. “It’s wonderful. It’s like the heavens coming down, and history and this thing probably came from an asteroid belt between Mars and Jupiter – I mean, how cool is that?” Peter Jenniskens, a leading meteor hunter at the Seti Institute in Mountain View, confirmed that the space rock was indeed debris from the meteor that streaked over the sky Wednesday night.”The significance of this find is that we can now hope to use our fireball trajectory to trace this type of meteorite back to its origins in the asteroid belt,” Jenniskens wrote on his group’s website. At the time the object hit her roof, Webber thought the sound she heard had come from an animal that was rummaging on her property. She checked the roof, found nothing, and quickly forgot about it until she read The Chronicle on Friday night. That’s when she went searching through the yard and found a rock. She summoned her neighbor’s son, the two put a magnet to the object, and they stuck together. On Saturday, neighbor Luis Rivera climbed onto the roof and found an indentation left by the meteorite. “The surprising thing about it all is that it’s something from the orbit between Mars and Jupiter, and it ended up in Novato,” Rivera said. “And when Lisa was relating all of this to me, it took a while to sink in as to the odds of this happening.”
Russia could start building a space rocket capable of destroying asteroids threatening the Earth, chief of rocket and space corporation Energia said Friday.
“There are three large asteroids, including Apophis, whose orbits cross the Earth’s orbit and which could hit the Earth in the next several decades,” Vitaly Lopota told the state newspaper Rossiyskaya Gazeta.
To change the orbit of a small planet of Apophis’ size, a 70-ton rocket was needed to “tow” an asteroid away from Earth or to destroy it with a thermonuclear blast, Lopota said.
Apophis was discovered in 2004. It will approach the Earth dangerously close, at about 30,000 km, which is less than one-tenth of the Moon’s distance from Earth, in 2029.
Experts calculate impact of a collision between Apophis and the Earth will be equal to a 1,700-Megaton explosion.
Lopota said existing Russian rocket carriers with RD-171 engines could be redesigned to produce a rocket capable of destroying an asteroid. Energia was ready to build such a rocket within three to five years, he said.
Currently, RD-171 engines made by NPO Energomash have been used on Zenit-3SL missiles employed in the Russia-Ukraine-Norway-U.S. joint project Sea Launch.
“We call them Tsar Engines, which no other country possesses,” Lopota said, referring to Russian artifacts, the Tsar Cannon and Tsar Bell, which were the world’s largest in their time.
by Francis Reddy for Goddard Space Flight Center
Greenbelt MD (SPX)
This plot shows the fractions of settled disk galaxies in four time spans, each about 3 billion years long. (full size chart) There is a steady shift toward higher percentages of settled galaxies closer to the present time. At any given time, the most massive galaxies are the most settled. More distant and less massive galaxies on average exhibit more disorganized internal motions, with gas moving in multiple directions, and slower rotation speeds. Credit: NASA’s Goddard Space Flight Center.
A comprehensive study of hundreds of galaxies observed by the Keck telescopes in Hawaii and NASA’s Hubble Space Telescope has revealed an unexpected pattern of change that extends back 8 billion years, or more than half the age of the universe.
“Astronomers thought disk galaxies in the nearby universe had settled into their present form by about 8 billion years ago, with little additional development since,” said Susan Kassin, an astronomer at NASA’s Goddard Space Flight Center in Greenbelt, Md., and the study’s lead researcher. “The trend we’ve observed instead shows the opposite, that galaxies were steadily changing over this time period.”
Today, star-forming galaxies take the form of orderly disk-shaped systems, such as the Andromeda Galaxy or the Milky Way, where rotation dominates over other internal motions. The most distant blue galaxies in the study tend to be very different, exhibiting disorganized motions in multiple directions. There is a steady shift toward greater organization to the present time as the disorganized motions dissipate and rotation speeds increase. These galaxies are gradually settling into well-behaved disks.
Blue galaxies – their color indicates stars are forming within them – show less disorganized motions and ever-faster rotation speeds the closer they are observed to the present. This trend holds true for galaxies of all masses, but the most massive systems always show the highest level of organization.
Researchers say the distant blue galaxies they studied are gradually transforming into rotating disk galaxies like our own Milky Way.
“Previous studies removed galaxies that did not look like the well-ordered rotating disks now common in the universe today,” said co-author Benjamin Weiner, an astronomer at the University of Arizona in Tucson. “By neglecting them, these studies examined only those rare galaxies in the distant universe that are well-behaved and concluded that galaxies didn’t change.”
Rather than limit their sample to certain galaxy types, the researchers instead looked at all galaxies with emission lines bright enough to be used for determining internal motions. Emission lines are the discrete wavelengths of radiation characteristically emitted by the gas within a galaxy. They are revealed when a galaxy’s light is separated into its component colors. These emission lines also carry information about the galaxy’s internal motions and distance.
The team studied a sample of 544 blue galaxies from the Deep Extragalactic Evolutionary Probe 2 (DEEP2) Redshift Survey, a project that employs Hubble and the twin 10-meter telescopes at the W. M. Keck Observatory in Hawaii. Located between 2 billion and 8 billion light-years away, the galaxies have stellar masses ranging from about 0.3 percent to 100 percent of the mass of our home galaxy.
A paper describing these findings will be published Oct. 20 in The Astrophysical Journal.
The Milky Way galaxy must have gone through the same rough-and-tumble evolution as the galaxies in the DEEP2 sample, and gradually settled into its present state as the sun and solar system were being formed.
In the past 8 billion years, the number of mergers between galaxies large and small has decreased sharply. So has the overall rate of star formation and disruptions of supernova explosions associated with star formation. Scientists speculate these factors may play a role in creating the evolutionary trend they observe.
Now that astronomers see this pattern, they can adjust computer simulations of galaxy evolution until these models are able to replicate the observed trend. This will guide scientists to the physical processes most responsible for it.
The DEEP2 survey is led by Lick Observatory at the University of California at Santa Cruz in collaboration with the University of California at Berkeley, the University of Hawaii at Manoa, Johns Hopkins University in Baltimore, Md., the University of Chicago and the California Institute of Technology in Pasadena.
The Hubble Space Telescope is a project of international cooperation between NASA and the European Space Agency. NASA’s Goddard Space Flight Center in Greenbelt, Md., manages the telescope. The Space Telescope Science Institute (STScI) in Baltimore, Md., conducts Hubble science operations. STScI is operated by the Association of Universities for Research in Astronomy, Inc. in Washington.
A bright fireball, reportedly with hues of red and orange, streaked across the night sky visible from San Francisco’s Bay Area on Wednesday, October 18, around 8 p.m. local time (3UTC on October 18). Many say they heard a boom, which was so loud it “shook their homes,” some residents said, making them think it may be an earthquake.
Wes Jones in Belmont, California caught the meteor disappearing behind the trees while using a wide-field camera. Image copyright Wes Jones. Used with permission.
Belmont, California astronomer Wes Jones captured the fireball as it sailed across the sky on October 17, just as it was entering the trees.
Here is the capture data for the Wes Jones’ image above:
Camera: Interactiveastronomy Skyeye Camera
Camera Location: 122°16’31.73″ W, 37°31’1.17″ N
Altitude: 17 Meters
Exposure Duration: 30 seconds
File Write Time: 07:44:44 PM PDT 10/17/2012
The video above is raw footage from the security camera at Lick Observatory, located in the hills above San Jose, California. Camera is a little out of focus. Round structure to the left is the 40-inch Nickel refracting telescope dome. Lights in the background are the San Jose cityscape. Video posted to YouTube by Erik Kovacs.
Screen grab from Google maps (not clickable) of area where October 17, 2012 meteorite might have fallen. One expert said it might have come down in the hills north of Martinez, California. If so, he said, hikers might be able to find pieces of the meteorite.
Jonathan Braidman, astronomy instructor at Oakland’s Chabot Space and Science Center, told SuiSunCityPatch.com that the meteor may have been “roughly the size of a car when it broke up over the Bay Area.” He said hikers might be able to find small pieces of the meteorite in the hills north of Martinez, California.
Was the October 17, 2012 meteor seen over the Bay Area associated with the Orionid meteor shower? If it were associated, it would have to have radiated from the same point in the sky as the Orionids. That point is in the the same famous constellation Orion the Hunter, shown here. Can anyone who saw the October 17 meteor tell us if it radiated from this constellation? More about this weekend’s Orionid meteor shower here.
Is the October 17, 2012 meteor associated with the Orionid meteor shower? That shower is coming up this weekend. Although I didn’t see it, and don’t know if its path could be traced back to the constellation Orion – which is the radiant point for all meteors in the Orionid shower – the answer is likely that the two are not associated. Meteors in annual showers are tiny, icy bits left behind by comets orbiting the sun. The Orionids, in particular, come from one of the most famous comets, Comet Halley, which last visited Earth in 1986. The meteor seen over the Bay Area on October 17, 2012 was more likely a larger, rocky meteor, just a random chunk of space debris that entered Earth’s atmosphere and vaporized due to friction with the air.
The October 17, 2012 meteor sighting is reminiscent of another meteor sighting earlier this year, when – on the morning of April 22, 2012 – many in Nevada and California saw a bright flash across the sky, and heard an audible boom, or explosion. The object was later called “a small asteroid” whose estimated weight was some 70 metric tons.
Wikimedia Commons image of a bollide or fireball – a piece of space debris entering Earth’s atmosphere and causing a particularly bright streak across the sky.
Astronomers use the word bolide to describe an exceptionally bright fireball such as this one. The term bolide – which comes the Greek word bolis, meaning a missile or to flash – is particularly applicable when the object is so bright it can be seen in broad daylight, when the object explodes in the atmosphere and when it creates audible sounds. In other words, all of these phenomena are known to occur, and astronomers even have a word for it.
Bright meteors or bollides were also seen in the U.K. and New Zealand in 2012. They are not uncommon, if you are considering the entire globe.
However, from any one spot on Earth, they are uncommon, Among astronomers, it’s sometimes said you might witness one bolide, or very bright fireball, in your lifetime. So if you saw this one, this was yours!
Bottom line: Many in San Francisco’s Bay Area saw an exceptionally bright meteor, and heard a loud boom, on the night of October 17, 2012. Photo and video in this post, plus information on the Orionid meteor shower, which peaks on the morning of October 21.
Concentrations of red tide have been detected from Charlotte County to Collier County. Hundreds of dead fish are washing ashore and a foul odor now fills the air at many beaches throughout Southwest Florida. Many residents and visitors are hoping that red tide is on its way out of town, but at Wiggins Pass State Park in Collier County, things aren’t looking too great. Thousands of dead fish remain in sight. But beachgoers we spoke with said they aren’t letting the toxic algae ruin their fun. “This is the first time I’ve seen this,” said Karl Udo, who has been visiting Southwest Florida from Germany for over 20 years. “It’s no good.” The toxic algae started to wash through Collier County beaches just last week, carrying with it the unpleasant stench. “You got to breathe through your mouth. So don’t take deep breaths through your nose,” said Liz Koch, who is visiting from Chicago. The latest tests done by county officials show that red tide is at medium levels throughout some of Collier’s beaches. The toxin can cause respiratory irritation, a concern for county officials with tourist season in sight.
Crews working on an old Air Force fuel spill have found potentially cancer-causing chemicals beneath a southeast Albuquerque neighborhood, Kirtland Air Force Base announced. The New Mexico Environment Department said Friday that Air Force crews found the pollutant Perchloroethylene, or PCE, in water around 500 feet underground while installing test wells. However, officials say they don’t believe the recently discovered pollutant is connected to a decades-old Kirtland Air Force Base jet fuel spill threatening Albuquerque’s water supply that could be as large as 24 million gallons. Davis tsaid that the chemicals likely came from a dry cleaner. Jim Davis, head of New Mexico Environment Department Resource Protection, told reporters that the chemical is threatening groundwater and not residents in the neighborhood above the contamination. Still, the discovery could trigger action under the federal Superfund law, a program aimed at the nation’s most serious hazardous chemical contamination problems. New Mexico Environment Department Secretary David Martin praised crews for making the discovery.The department has launched a probe to see if any businesses that used PCE were located in the vicinity of the well clusters in the past. The Air Force is two years away from finalizing a cleanup plan in connection with a toxin-laden plume from a 40-year underground pipe leak was discovered at Kirtland Air Force Base. The spill was first discovered in 1999 when the Air Force noticed a pool of fuel coming up out of the ground at its old aircraft fuel storage center, which dates back to the 1950s. Air Force officials say the fuel was leaking from an underground pipe for at least 40 years as tests on elements in the plume — which contains the cancer-causing Benzyne and other harmful toxins — show it dates back to at least the 1970s. Less than half a million gallons have been pumped out of the ground.
[In accordance with Title 17 U.S.C. Section 107, this material is distributed without profit, for research and/or educational purposes. This constitutes ‘FAIR USE’ of any such copyrighted material.]
An earthquake in Southern Maine reverberated all the way to the Boston metropolitan area at 7:12 p.m. Tuesday evening.
“Notice how it seemed to kind of ‘roll’ through, shaking momentarily but kind of coming in a wave,” New England Sports Network, based in Boston, reported of feeling the quake.
Registering at a 4.5 magnitude, the temblor was centered 3.7 miles Maine’s Lake Arrowhead, Reuters reported.
There were no reported injuries or damage.
Maine has experienced over 80 earthquakes since 1997, according to the state’s Bureau of Geology. The state’s most serious earthquake was in 1904. It registered as a 5.1 on the Richter scale, and was felt through most of New England and the Canadian provinces of New Brunswick and Nova Scotia.
PORTLAND, Maine (AP) — An earthquake that hit southern Maine Tuesday night rattled nearby New England states as far as Connecticut, including the Boston area, but caused no injuries or apparent damage.
The U.S. Geological Survey at first estimated the 7:12 p.m. quake as a 4.6 magnitude, but later downgraded that to 4.0. The epicenter, about 3 miles west of Hollis Center, Maine, is about 3 miles deep. That location is about 20 miles west of Portland.
About 10 miles away in Waterboro, about 20 customers and staff at Waterboro House of Pizza ran outside when they heard a loud bang and the building shook.
“It was loudest bang you ever heard in your life. We actually thought it was an explosion of some type,” said owner Jessica Hill. “The back door and door to the basement blew open.”
In the same town, employees at the Milk Room said towels and other items started falling off shelves.
“I heard a bang, and it felt like the building was just shaking it went on for three seconds and then it started shaking again,” said George Moutsos, an employee.
In nearby Saco, Sue Hadiaris said, “The whole house shook. It felt like a train was coming right through the house. It was very unnerving because you could feel the floor shaking. There was a queasy feeling.”
Afterward, Hadiaris called her 15-year-old niece in Falmouth to make sure she was safe. “She said, `We can cross that off our bucket list. We’ve lived through an earthquake,”‘ Hadiaris said.
Lynette Miller, a spokeswoman for the Maine Emergency Management Agency, said her dogs started barking several seconds before the quake. “It was several seconds of good shaking but nothing falling down,” Miller said from her home in Readfield, about 60 miles north of Portland.
The Seabrook Station nuclear plant, about 63 miles away in New Hampshire, declared an unusual event — the lowest of four emergency classifications, but said it was not affected. The plant has been offline for refueling.
“There has been no impact at all to the plant from the earthquake and our refueling maintenance activities have not been affected,” said Alan Griffith, spokesman for Next EnergyEra Seabrook Station.
Jim Van Dongen, public information officer for the New Hampshire Department of Safety said New Hampshire 911 got about 1,000 calls in the first hour after the quake, but they later dropped off. He said no major damage was reported.
Brief, but noticeable shaking was felt in downtown Boston and the surrounding area.
In Melrose, just north of Boston, Peter Ward said the shaking he felt seemed to last about four seconds. “It felt like a big gust of wind shaking the house. I don’t want to overstate it, but the glass did rattle a little,” he said.
Former Maine resident Victoria Brett, who also has lived in San Francisco, felt the quake in Northampton, Mass.
“At first, it felt like something slowly wiggling the outside walls of the house. Then the table and floor started vibrating. I looked around and the water in the glass flower vase looked like a wave pool. I knew right away it was an earthquake,” she said.
Earthquakes are rare in New England but they’re not unheard of. In 2006 there was a series of earthquakes around Maine’s Acadia National Park, including one with a magnitude of 4.2 that caused boulders to fall from ledges onto Acadia National Park’s loop road. One of the park’s trails was closed for three years because of damage from the quake.
The strongest earthquake recorded in Maine occurred in 1904 in the Eastport area, near the state’s eastern border with Canada, according the Weston Observatory at Boston College. With a magnitude estimated at 5.7 to 5.9, it damaged chimneys and brick walls and could be felt in Massachusetts and New Hampshire.
East Coast quakes are rarely strong enough to be felt over a wide area. A quake of magnitude 5.8 on Aug. 23, 2011, was centered in Virginia and felt all along the coast, including in New York City and Boston. Experts say the region’s geology can make the effects felt in an area up to 10 times larger than quakes of similar size on the West Coast.
RENO, Nev. (KRNV & MyNews4.com) — Some rattling and rolling in the area has earthquake experts on alert. In the past week more than 100 small earthquakes have shaken the earth beneath Spanish Springs.
So far they’ve been too small to feel, but quake experts want you to know they’re happening. There’s no reason to panic – but it’s a good reminder to make sure you’re prepared.
“People can consider certain mitigation steps in case these earthquakes increase in intensity and there’s a larger one,” said Ken Smith, associate director of the Nevada Seismological Laboratory.
Smith says most injuries from earthquakes are caused by falling or flying objects – and you don’t want to wait for a big quake to get ready.
“Secure your water heaters. Secure your valuables. Secure your book cases,” Smith said.
It’s not strange for a dozen quakes this size to happen in a week, but there have been at least 115 since October 8, and about 60 of those have been since Thursday.
“These things are totally unpredictable,” Smith said. “It could stop today, or it could keep going at a level of very small events that no one would feel.”
Or they could get stronger. so far they’re small – with the biggest two quakes shaking at magnitude one – but there’s potential for one that really rocks Reno.
“We have faults around here that are capable of magnitude seven type events,” Smith said.
So this week the Great Nevada Shakeout will teach people to drop, cover and hold-on just in case there’s a big quake. It’s Nevada’s largest earthquake drill and it’s this Thursday, October 18 at 10:18 am.
The US Geological Survey (USGS) says an earthquake occurred Wednesday evening in Western Nebraska. About 1330 miles southeast of Rapid City.
The 3.6 magnitude earthquake occurred at 11:21 pm at a depth of about4 miles , 18 miles northwest of Hyannis, Nebraska.
Although not as common as in some other states earthquakes do occur in Nebraska. The strongest occurred on November 15, 1877 with a magnitude of 5.1. Two shocks 45 minutes apart rocked most of Nebraska and portions of surrounding states , including South Dakota.
In this Oct. 15, 2009 file photo, children participate in the “Great California ShakeOut” earthquake drill at the Para Los Ninos Elementary School in Los Angeles. Millions in the United States and several countries are set to participate in an earthquake preparedness drill, dubbed the “Great ShakeOut,” Thursday, Oct. 18, 2012.
LOS ANGELES — Get ready to rumble. Millions in the United States and several countries are set to participate in an earthquake preparedness drill Thursday.
Dubbed the “Great ShakeOut,” homeowners, schoolchildren and office workers across the West and Southeast will practice dropping to the ground, covering their heads and holding on to something sturdy – a technique that experts say minimizes injuries during strong shaking. Residents in British Columbia, Italy, Puerto Rico and Guam also signed up for the exercise.
Organizers estimated some 14 million people, including 9.3 million in California, will participate. Newcomers include Washington, D.C., Maryland and Virginia, where a magnitude-5.8 hit last year that was felt along the East Coast.
Play Video
Northeast Shaken by Quake
In Los Angeles, commuters at Union Station will be asked to duck and take cover. Subways and light-rail trains will slow down so that operators can visually inspect the tracks – a process that’s expected to take 15 minutes. In an actual quake, trains can be stopped. Transportation officials also planned to show the public tips to safely evacuate a train.
Southern California held the first safety drill in 2008 based on a fictional magnitude-7.8 event on the southern San Andreas Fault. The entire state participated the following year and the exercise has since spread around the world.
“It’s not looking at earthquakes as doom and gloom,” said organizer Mark Benthien. “It’s all about what we’re going to do as a community to be prepared so that when there’s an earthquake, we’ll get back on our feet and recover.”
Southern California has not experienced a seismic disaster since the 1994 Northridge quake, which killed 72 people and caused $25 billion in damage to the Los Angeles region.
Listado Terremotos últimos 10 días
List of Earthquakes For The Last 10 days
Terremotos de los últimos 10 días en las Islas Canarias de magnitud igual o superior a 1.5 o sentidos:
List of earthquakes for the last 10 days for the Canary Islands of magnitude equal to or greater than 1.5
La información de terremotos de magnitud inferior se puede obtener en Catálogo y boletines sísmicos. Information for earthquakes of lesser intensity can be obtained at Catálogo y boletines sísmicos.Esta información está sujeta a modificaciones como consecuencia de la continua revisión del análisis sísmico.This information is subject to modification as a consequence of continuous revision and analysis of seismic data.Event Date Time Lat. Long. Depth Mag. Location Info.
Chief of Police in Hvolsvöllur, a representative of the Icelandic Road Administration and geophysicist Magnús Tumi Guðmundsson will discuss at a meeting on Thursday whether the levees to the east of Vík, which lies across the Ring Road near the river Múlakvísl, must be raised to prove effective in case of a volcanic eruption in Katla.
Vík. Photo by Bernhild Vögel.
Geologist Ari Trausti Guðmundsson stated in an article in Morgunblaðið yesterday that it is important to raise the levees judging by the information available on the volume and depth of flooding from Katla, ruv.is reports.
The volcano lies underneath the Mýrdalsjökull icecap and a volcanic eruption is likely to cause a major glacier outburst.
The levees are the responsibility of the Icelandic Road Administration and according to a report conducted by Einar Hafliðason, a representative of the Road Administration, last spring there was no need to raise the levees given the conditions at hand.
The levees are now five meters high and 4,000-5,000 meters long.
Scientists are monitoring the volcano closely due to ongoing seismic activity.
An underwater volcanic eruption was detected Wednesday morning close to Minami-Iwoto island in the Pacific Ocean and an expert speculated that the eruption could form a permanent island. A coast guard vessel spotted a white plume of smoke rising from the sea about three miles north-northeast of the island. It was the first time since July 2005 that volcanic smoke had been detected in the area, which is located about 745 miles south of central Tokyo. According to an announcement by the 3rd Regional Coast Guard Headquarters of the Japan Coast Guard, based in Yokohama, the volcano spewed ash and smoke about 100 meters into the air, and the surrounding sea area changed to a yellowish-green color while other parts became a cloudy gray. According to the Meteorological Agency, the volcano, known as Fukutokuokanoba, has erupted seven times since 1904, when its activities were first recorded. On three occasions, land masses were formed, but all later sank below the waterline. Tokyo Institute of Technology Prof. Kenji Nogami, an expert in geoscience, said: “In the 1986 eruption, a new island appeared after lava accumulated. The island was washed away by waves, but seabed upheaval reduced the water depth to 22 meters in 1999. It’s possible that this (recent) volcanic activity could form a permanent island.”
The highest active volcano in Eurasia, Klyuchevskaya Sopka has started to erupt, officials with the Institute of Volcanology and Seismology said. On the night of October 15, there was light seen over the summit of the volcano indicating a blowout of lava in its crater, Vesti.ru reports. Experts believe the release of ash to the height of 6 feet above sea level may start any moment. Lava flows on the slopes of the volcano are also expected. Yellow aviation color code has been assigned to the volcano to warn about the potential danger that the volcanic ash and gases may pose to aircraft engines. Nothing has been said about the possible threat to human settlements. The nearest settlement is 30 kilometers far from Klyuchevskaya Sopka. The last eruption of Klyuchevskaya Sopka took place from September 2009 to December 2010. In June this year, the giant began to wake up again.
disclaimer: image is for illustration purposes only
Increasing drought conditions across the planet are part of a “new normal” which oddly presents new business opportunities, a new Bank of America Merrill Lynch report says.
The report comes just after insurer Munich Re’s findings that North America has borne the brunt of weather-related natural catastrophes, with 30,000 deaths and insured losses of $510 billion in the 1980-2011 period.
The ongoing drought is the worst in the United States since at least 1956, with 63 percent of the lower 48 states suffering drought conditions in August, says the BofA Merrill Lynch report, “Global Drought — Opportunities and Risks.”
While conditions are far from those in the Dust Bowl years of the 1930s, drought conditions are the new normal, the report said.
Previous reports in a series focused on obesity, energy efficiency and safety and security.
“Food, water and energy security are increasingly bigger issues, and as governments, businesses and other players struggle to adapt to and mitigate drought conditions, there will be an evolving set of opportunities and risks for investors,” the bankers said in their findings.
For investors interested in the fight against drought and in promoting food, water and energy security, the financial group has introduced a screen that identifies liquid stocks exposed to global drought-related themes under the Bloomberg ticker MLEIARID.
The stocks included in the screen are those that it considers to be long-term solution providers in such areas as water, fertilizers, crop science, energy efficiency, second-generation biofuels and renewables.
“The severity of the global drought underscores the long-term challenges for national and global economies,” said Sarbjit Nahal, a co-author of the report.
“Food, water and energy security are increasingly bigger issues, and as governments, businesses and other players struggle to adapt to and mitigate drought conditions, there will be an evolving set of opportunities and risks for investors.”
The Munich Re report also cited conditions in which North American stakeholders could benefit by learning about the weather risks.
The study was prepared in order to support underwriters and Munich Re clients in North America, the world’s largest insurance and reinsurance market.
“The North American continent is exposed to every type of hazardous weather peril — tropical cyclone, thunderstorm, winter storm, tornado, wildfire, drought and flood. One reason for this is that there is no mountain range running east to west that separates hot from cold air,” said the report.
Nowhere in the world is the rising number of natural catastrophes more evident than in North America, it said.
Munich Re’s Geo Risks Research unit head Peter Hoppe called on all concerned to “collaborate and close ranks” to meet the situation.
Peter Roder, Munich Re board member with responsibility for the U.S. market, said, “We should prepare for the weather risk changes that lie ahead, and nowhere more so than in North America.”
Twenty-two houses at Kampung Sungai Burung and Jalan Baru Sungai Korok here were badly damaged during a severe thunderstorm today. In the noon incident, the winds blew away rooftops while falling trees compounded the destruction on the houses. Resident Zulkiflee Mat Yusof, 50, said many of the electrical items in his house were damaged by rain water, fanned by the winds into the house. A Bakso stall operator who only wanted to be identified as Anis, 31, said she was busy serving customers when the thunderstorm struck. “It was so sudden that I had no time to act,” she said, finding her stall and wares completely destroyed in the aftermath. Senior citizen Jamaludin Ahamad, 65, said he and his family were having their lunch in the living room when a tree at the back of the house fell and hit the kitchen roof.
Tropical Cyclone Anais is estimated to have a maximum wind of 115 mph as of early this morning, which is equivalent to a category 3 hurricane in the Atlantic Ocean.
The southwestern Indian Ocean is prone to tropical cyclones but what makes Anais so rare is that it is occurring in October, which is early springtime in the southern Hemisphere.
The peak period for tropical events in this part of the world is normally during our winter months of January-March.
Anais is forecast to move southwest in the general direction of Madagascar for the next five days and weaken as it moves into cooler waters and unfavorable winds.
We rarely hear much about the southern Indian Ocean storms as the area has little land and the storms mostly stay at sea.
Occasionally Madagascar or the island nations of Mauritius and Reunion will take a hit, and more rarely a storm will reach mainland Africa.
Forecast responsibility for this region is through the French weather service, Meteo France, located in La Reunion to the east of Madagascar.
The countries in the Indian Ocean simply refer to these storms as Tropical Cyclones, regardless of intensity.
Tropical Cyclone Anais is the same thing as a hurricane in the Atlantic or typhoon in the western Pacific.
However, note that it rotates the opposite direction, clockwise, because it is in the southern Hemisphere.
To illustrate how unusual this event is, Anais is like having a Category 3 hurricane in the Caribbean in April.
Storm surges are considered to be the most dangerous and the most destructive aspect of tropical cyclones. The study shows that globally warm years has been associated with a significantly higher risk of extreme hurricane storm surges like the one that followed Katrina, which hit the New Orleans area in 2005 and caused devastating floods and thousands of deaths. Credit: Credit: LCDR Mark Moran, NOAA Corps, NMAO/AOC.
Are there more tropical cyclones now than in the past? – or is it just something we believe because we now hear more about them through media coverage and are better able detect them with satellites?
New research from the Niels Bohr Institute clearly shows that there is an increasing tendency for cyclones when the climate is warmer, as it has been in recent years. The results are published in the scientific journal PNAS.
How can you examine the frequency of tropical cyclones throughout history when they have not been systematically registered? Today cyclones are monitored from satellites and you can follow their progress and direction very accurately. But it is only the last approx. 40 years that we have been able to do this.
Previously, they used observations from ships and aircraft, but these were not systematic measurements. In order to get a long-term view of the frequency of cyclones, it is necessary to go further back in time and use a uniform reference.
Climate scientist Aslak Grinsted of the Centre for Ice and Climate at the Niels Bohr Institute at the University of Copenhagen therefore wanted to find some instruments that have stood and registered measurements continuously over a long period of time.
Correlation between sea levels and cyclones “Tropical cyclones typically form out in the Atlantic Ocean and move towards the U.S. East Coast and the Gulf of Mexico.
“I found that there were monitoring stations along the Eastern Seaboard of the United States where they had recorded the daily tide levels all the way back to 1923.
“I have looked at every time there was a rapid change in sea level and I could see that there was a close correlation between sudden changes in sea level and historical accounts of tropical storms,” explains Aslak Grinsted.
Aslak Grinsted now had a tool to create statistics on the frequency of cyclones that make landfall – all the way back to 1923. He could see that there has been an increasing trend in the number of major storm surges since 1923.
Correlation between cyclones and climate Together with colleagues in China and England, he then looked at the global temperatures over the period to see whether there was a trend for a higher frequency of cyclones in a warmer climate.
The global temperature has increased 0.7 degrees C since 1923, but there are variations. For example, there was a warm period in the 1940s but the temperature has really risen since 1980.
“We simply counted how many extreme cyclones with storm surges there were in warm years compared to cold years and we could see that there was a tendency for more cyclones in warmer years,” says Aslak Grinsted.
But not all cyclones are equally harmful and those with the highest storm surges tend to cause the most damage. Cyclones with a strength like Katrina, which hit the New Orleans area in 2005 and caused devastating floods and thousands of deaths, make landfall every 10-30 years on average.
“We have calculated that extreme hurricane surges like Katrina are twice as likely in warm years than in cold years. So when the global climate becomes 3 degrees warmer in the future, as predictions show, what happens then?,” reflects Aslak Grinsted.
At least eight people were injured as a round of severe storms, including a few tornadoes, swept through the Mississippi Valley and South Wednesday and Wednesday night.
A potent cold front moving across the Lower Mississippi Valley acted as the ignition for the thunderstorms. Enough humid air was in place to support the growth of severe thunderstorms capable of spawning tornadoes. Twisting winds in the atmosphere aided the rotation in thunderstorms, further aiding tornado development.
Strong winds, wind damage or hail was reported across a half dozen states in total, from Illinois to Mississippi.
One particularly damaging tornado tracked across Sharkey County, Miss., shortly before 11:00 p.m. local time, destroying numerous mobile homes and injuring five near the town of Louise, which sustained “heavy” damage according to local law enforcement.
The same tornadic thunderstorm narrowly missed nearby Yazoo City, which was devastated by a pair of tornadoes in 2010.
The towns of Clarendon and West Jericho, Ark., and Shelby, Miss., were also impacted by tornadoes Wednesday evening, according to various reports.
Severe storm reports from Wed., Oct. 17. Strong winds and wind damage incidents are indicated in blue, while tornadoes are plotted in red and hail in green. (SPC)
It is possible that more tornadoes will be confirmed to have touched down across the region as other incidents of wind damage are assessed by the National Weather Service over the next couple of days.
One such incident occurred in Scott County, Miss., where a person was injured when a tree fell onto their mobile home.
Strong thunderstorm winds heavily damaged about a dozen buildings in Bland, Mo., earlier in the day, including the town’s post office, where two people sustained minor injuries.
As of 4:30 a.m. EST Thursday, there were nearly 100 reports of severe weather and damage from the severe weather outbreak. Eighty of the reports alone were wind damage, ranging from downed trees and power lines to partially collapsed structures.
While not as prolific, a few storms produced one-inch diameter hail stones in Arkansas, Mississippi and Tennessee.
The National Weather Service has confirmed that at least four tornadoes were part of the storm system that raked northern and central Mississippi on Wednesday night and Thursday morning. The biggest of the four storms was a twister that traveled 16 miles from Scott into Newton counties east of Jackson. With a half-mile-wide damage path, it was rated EF-3 on the Fujita scale, with peak winds estimated at 140 mph. That storm blew down trees as well as three electrical transmission towers. One person was injured when a tree fell through a roof. Authorities said Thursday that at least seven people were injured when a line of storms pushed across the state.
As severe storms pounded central and eastern Arkansas Wednesday evening, the Monroe County town of Clarendon experienced widespread power outages and heavy damage to some buildings. With most of the town without power for much of the night, several community members drove around town trying to offer help as best they could. Metal awnings from a building were ripped off and tossed across the street, and trees were downed, including one that hit a Clarendon video store just moments after the owner, Denise Davenport, left. Davenport said she left after friends called her and told her the storm was approaching. Shortly afterward, she says she heard the city’s weather sirens sound. Davenport also credits the support from the community for keeping her safe in a dangerous situation.
By John Breneman jbreneman@seacoastonline.com
SEABROOK — An “unusual event” indeed. The 4.0 magnitude earthquake that rumbled across the Seacoast and beyond Tuesday evening triggered normal safety protocols at the Seabrook Station nuclear power plant.
The Nuclear Regulatory Commission declared an “unusual event” — NRC-speak for the lowest of its four levels of emergency classifications — at 7:20 p.m. Tuesday. The declaration was prompted by on-site ground motion resulting from an earthquake centered near Hollis, Maine — about 50 miles from the plant.
“There was absolutely no impact to the plant from the earthquake,” said Al Griffith, spokesman for NextEra Energy, the plant’s owner. Griffith said a series of mandated safety checks were conducted at the plant, concluding at 1:49 a.m., some six and a half hours after the tremor.
Citing the “robustness” of the plant’s design, Griffith assured that it is capable of withstanding a far, far greater impact than Tuesday’s quake.
There are seismic monitors on site and Griffith said officials will be conducting “a very thorough examination and analysis of all of our data.”
An NRC resident inspector assigned to Seabrook responded to the site last night to confirm that there were no immediate safety issues at the plant, which is currently shut down for a scheduled refueling and maintenance outage.
“The reactor was fully shut down at the time the earthquake occurred,” said Neil Sheehan, regional public officer for the NRC.
“Following procedures used when there is seismic activity affecting the plant, NextEra personnel conducted initial walkdowns, i.e., visual inspections, and confirmed that all key safety systems were functioning properly and that there was no significant structural damage,” Sheehan said in a statement. “The company will subsequently gather more seismic data and perform more detailed inspections.”
Asked about the need to be vigilant in preparing for and reacting to any seismic activity, particularly in the wake of the March 2011 disaster following an earthquake and tsunami at the Fukushima Nuclear Power Plant in Japan, Sheehan said, “What happened at Fukushima served as a vivid reminder” of why the highest safety protocols are put in place and enforced.
Last April, NextEra Energy conducted a tsunami drill Tuesday at the Seabrook Station plant in order to identify strengths and weaknesses of the plant in case of such a disaster.
Health experts have confirmed an outbreak of the deadly Marburg virus in the western district of Kabale after samples from two relatives taken to the Uganda Virus Institute tested positive. Police Thursday stopped the burial of Boaz Turyahikayo a lecturer at Uganda Christian University and his sister Mildrid Asasira after it emerged that their family had lost four people from a mysterious disease in just a month. The other two are Lillian Banegura their mother and an elder brother Bernard Rutaro who passed away early this month. Dr. Patrick Tusiime the Kabale district health officer said a team from the Ministry of Health and World Health Organization is on its way to oversee the burial of the two victims. The Marburg virus was last reported in Uganda in 2008. It carries symptoms similar to those of Ebola that include fever, vomiting and internal bleeding.
Biohazard name:
Marburg virus disease (MVD)
Biohazard level:
4/4 Hazardous
Biohazard desc.:
Viruses and bacteria that cause severe to fatal disease in humans, and for which vaccines or other treatments are not available, such as Bolivian and Argentine hemorrhagic fevers, H5N1(bird flu), Dengue hemorrhagic fever, Marburg virus, Ebola virus, hantaviruses, Lassa fever, Crimean-Congo hemorrhagic fever, and other hemorrhagic or unidentified diseases. When dealing with biological hazards at this level the use of a Hazmat suit and a self-contained oxygen supply is mandatory. The entrance and exit of a Level Four biolab will contain multiple showers, a vacuum room, an ultraviolet light room, autonomous detection system, and other safety precautions designed to destroy all traces of the biohazard. Multiple airlocks are employed and are electronically secured to prevent both doors opening at the same time. All air and water service going to and coming from a Biosafety Level 4 (P4) lab will undergo similar decontamination procedures to eliminate the possibility of an accidental release.
Eighteen people are confirmed to be suffering from dengue fever in the Portuguese archipelago of Madeira and another 191 probably have the mosquito-borne disease which is also called “breakbone fever” because of the severe pain it can cause. The European Centre for Disease Prevention and Control (ECDC.L) which monitors disease in the European Union, said the outbreak was “significant but not entirely unexpected” given that the most efficient carriers of the disease, mosquitoes known as Aedes aegypti, have an established presence in Madeira. “Portuguese public health authorities are implementing control measures to reduce the risk of sustained transmission locally, the export of infected vectors from the island, and to minimise the impact on the affected population,” it said. The ECDC said the risk for tourists visiting Madeira and for residents of the island would “depend on the course of the outbreak in the coming weeks and the effectiveness of the control measures.” It did not recommend any restrictions on travel or tourism to Madeira, but advised people to protect themselves adequately against mosquito bites, particularly during the day which is when dengue-carrying mosquitoes are most active.
Biohazard name:
Dengue Fever
Biohazard level:
2/4 Medium
Biohazard desc.:
Bacteria and viruses that cause only mild disease to humans, or are difficult to contract via aerosol in a lab setting, such as hepatitis A, B, and C, influenza A, Lyme disease, salmonella, mumps, measles, scrapie, dengue fever, and HIV. “Routine diagnostic work with clinical specimens can be done safely at Biosafety Level 2, using Biosafety Level 2 practices and procedures. Research work (including co-cultivation, virus replication studies, or manipulations involving concentrated virus) can be done in a BSL-2 (P2) facility, using BSL-3 practices and procedures. Virus production activities, including virus concentrations, require a BSL-3 (P3) facility and use of BSL-3 practices and procedures”, see Recommended Biosafety Levels for Infectious Agents.
Symptoms:
The disease is a viral infection that can cause a range of symptoms, from mild flu-like illness to more serious illnesses including rashes and bone pain. Severe and potentially deadly forms develop in around 5 percent of patients.
The United Kingdomâs Health Protection Agency reported 18 confirmed cases of dengue fever on the Madeira archipelago in Portugal and 191 probable cases since early October. The reported cases mark the first time that the mosquito-borne viral infection has been reported in Madeira. Health authorities in Madeira are looking into the cases and are implementing prevention and control measures along with a public awareness campaign. âDengue fever cannot be passed from person to person and infection occurs after being bitten by the Aedes mosquito carrying the virus,â Jane Jones, a travel-associated infection expert at the HPA, said. âTo minimize the risk of being bitten it is advisable to wear appropriate clothing to cover up â such as long sleeve tops and trousers, and to use insect repellents.â Dengue can cause multiple clinical symptoms, including a mild flu-like illness. It can also cause more serious symptoms such as rash, bone pain and severe complications. âThere is no specific preventive medicine or vaccination against dengue fever and prevention relies on avoiding mosquito bites particularly around dusk and dawn when the day biting mosquitoes are most active,â Dipti Patel, the joint director of the National Travel Health Network and Center, said. âAnyone who develops a fever or flu-like symptoms within two weeks of returning from a trip to Madeira should seek medical advice from NHS Direct or their GP.â Approximately 2.5 billion people worldwide are at risk of acquiring dengue fever, according to the World Health Organization.
17.10.2012
Epidemic Hazard
Zambia
Central State, [Lukanga Swamps (Kapiri Mposhi district)]
The diarrhoeal disease which broke-out last week and has since claimed over 14 lives of fishermen in Lukanga Swamps in Kapiri Mposhi district has been confirmed to be cholera. Kapiri Mposhi District Medical Officer, Charles Mwinuna confirmed to ZANIS today that according to the second-round of tests conducted on the samples obtained from the patients admitted at Waya clinic in the area, the diarrheal disease was confirmed cholera. Over 20 patients are admitted to Waya clinic after experiencing severe diarrhoea and vomiting. Dr Mwinuna said officers from the District Health Management Team have since been dispatched to Lukanga Swamps and were treating people with cholera symptoms. He also said precautionary measures were being taken to ensure that the disease does not spread to other areas in the district. Dr Mwinuna said the health personnel dispatched to Lukanga Swamps are also conducting further tests and contact tracing of the origin of patients admitted to the clinic and were sensitizing the community on hygiene and providing chlorine to households to reduce the chances of spreading the diarrheal disease. Fourteen people have so far died of the disease which was earlier mistaken to be severe diarrhoea. The diarrhoea and vomiting disease broke out at Kaswende, Waya, Kabosha and Ngwenya fishing camps on Lukanga Swamps. The bodies of the deceased are being buried at a cholera designated graveyard in the area Meanwhile, a traditional leader has appealed to the Ministry of Health to open-up cholera Centres in all fishing camps to treat patients and reduce chances of further spreading the diarrheal disease. Headwoman Agnes Chimbuleni noted that the disease has claimed many lives in the area because of the distances patients had to cover to Waya clinic from the fishing camps for treatment.
Biohazard name:
Cholera
Biohazard level:
2/4 Medium
Biohazard desc.:
Bacteria and viruses that cause only mild disease to humans, or are difficult to contract via aerosol in a lab setting, such as hepatitis A, B, and C, influenza A, Lyme disease, salmonella, mumps, measles, scrapie, dengue fever, and HIV. “Routine diagnostic work with clinical specimens can be done safely at Biosafety Level 2, using Biosafety Level 2 practices and procedures. Research work (including co-cultivation, virus replication studies, or manipulations involving concentrated virus) can be done in a BSL-2 (P2) facility, using BSL-3 practices and procedures. Virus production activities, including virus concentrations, require a BSL-3 (P3) facility and use of BSL-3 practices and procedures”, see Recommended Biosafety Levels for Infectious Agents.
Scientists have found support for the controversial idea that global warming is causing more frequent and destructive hurricanes, a subject that has been hotly debated during the past decade.
Data gathered from tide gauges, which monitor the rapid changes to sea levels caused by storm surges, show a significant link between both the frequency and intensity of tropical storms and increases in annual temperatures since the tidal records began in 1923.
The study found that during the 90-year period, when the average global temperature has increased by 0.7C, extreme hurricanes similar to Katrina, which devastated New Orleans in 2005, were nearly twice as likely in warmer years as colder years.
Although scientists were not able to prove that climate change is causing more large hurricanes, they believe the study is consistent with the predictions that global warming and warmer seas could bring about more intense tropical storms.
Hurricanes form when the sea’s surface temperature increases above 26C. However, they result from a chaotic interaction between the difference in sea and air temperatures, humidity and wind, so there is disagreement about how frequent they will become in a warmer world.
Studying the link between global warming and tropical storms has been hampered by the lack of data on hurricanes before the satellite age. Many hurricanes out at sea were missed before the first weather satellites were launched about 40 years ago.
However, a network of tide gauges around the south-east coast of the US has produced a reliable record of the rapid changes to sea level caused by storm surges resulting from tropical cyclones, said Aslak Grinsted of the Niels Bohr Institute at Copenhagen University.
“I found that there were monitoring stations along the eastern seaboard of the United States where they had recorded the daily tide levels all the way back to 1923. I have looked at every time there was a rapid change in sea level and I could see there was a close correlation between sudden changes in sea level and historical accounts of tropical storms,” Dr Grinsted said.
Once the correlation between storm surges and tropical storms was established, the researchers analysed global temperature records to compare the number of storm surges in warm years with the number observed in cold years.
“We simply counted how many extreme cyclones with storm surges there were in warm years compared with cold years and we could see that there was a tendency for more cyclones in warmer years,” Dr Grinsted said.
Storms of destruction: devastating weather
Wilma (2005)
The most intense Atlantic hurricane on record started in the Caribbean Sea near Jamaica, moving across the Gulf of Mexico to Cancun where it hit land with devastating consequences.
Katrina (2005)
The most costly hurricane in history caused damages of $85bn. The category-3 storm formed over the Bahamas crossed Florida and the Gulf of Mexico before striking New Orleans.
Gilbert (1988)
The second most intense hurricane observed in the Atlantic. It began to the east of Barbados before hitting Jamaica and the Gulf of Mexico. It raged for nine days, killing 433 people.
Global temperatures directly affect the acidity of the ocean, which in turn changes the acoustical properties of sea water. New research suggests that global warming may give Earth’s oceans the same hi-fi sound qualities they had more than 100 million years ago, during the Age of the Dinosaurs.
The reason for this surprising communication upgrade is that whales vocalize in the low-frequency sound range, typically less than 200 hertz, and the new research predicts that by the year 2100, global warming will acidify saltwater sufficiently to make low-frequency sound near the ocean surface travel significantly farther than it currently does – perhaps twice as far.
Rhode Island acoustician David G. Browning, lead scientist on the research team, will present his findings at the 164th meeting of the Acoustical Society of America (ASA), held Oct. 22 – 26 in Kansas City, Missouri.
He explains the sea change this way: “We call it the Cretaceous acoustic effect, because ocean acidification forced by global warming appears to be leading us back to the similar ocean acoustic conditions as those that existed 110 million years ago, during the Age of Dinosaurs.”
Their work builds on the recent investigation by other researchers who analyzed historic levels of boron in seafloor sediments to reconstruct ocean acidity for the past 300 million years.
Using boron’s sound absorption traits and impact on low-frequency transmission, Browning and his colleagues were able to predict the soundscape of ancient oceans to conclude that 300 million years ago, during the Paleozoic, the low frequency sound transmission in the ocean was similar to conditions today.
They also found that transmission improved as the ocean became more acidic, reaching its best transmission value around 110 million years ago – allowing low frequency sound to travel twice as far.
“This knowledge is important in many ways,” notes Browning.
“It impacts the design and performance prediction of sonar systems. It affects estimation of low frequency ambient noise levels in the ocean. And it’s something we have to consider to improve our understanding of the sound environment of marine mammals and the effects of human activity on that environment.”
If further work validates this model, future SCUBA divers might hear in the oceans with the same clarity as the dinosaurs.
Scientists have discovered why the ‘broken world’ following the worst extinction of all time lasted so long – it was simply too hot to survive.
The end-Permian mass extinction, which occurred around 250 million years ago in the pre-dinosaur era, wiped out nearly all the world’s species. Typically, a mass extinction is followed by a ‘dead zone’ during which new species are not seen for tens of thousands of years. In this case, the dead zone, during the Early Triassic period which followed, lasted for a perplexingly long period: five million years.
A study jointly led by the University of Leeds and China University of Geosciences (Wuhan), in collaboration with the University of Erlangen-Nurnburg (Germany), shows the cause of this lengthy devastation was a temperature rise to lethal levels in the tropics: around 50-60 degrees C on land, and 40 degrees C at the sea-surface.
Lead author Yadong Sun, who is based in Leeds while completing a joint PhD in geology, says: “Global warming has long been linked to the end-Permian mass extinction, but this study is the first to show extreme temperatures kept life from re-starting in Equatorial latitudes for millions of years.”
It is also the first study to show water temperatures close to the ocean’s surface can reach 40 degrees C – a near-lethal value at which marine life dies and photosynthesis stops. Until now, climate modellers have assumed sea-surface temperatures cannot surpass 30 degrees C. The findings may help us understand future climate change patterns.
The dead zone would have been a strange world – very wet in the tropics but with almost nothing growing. No forests grew, only shrubs and ferns. No fish or marine reptiles were to be found in the tropics, only shellfish, and virtually no land animals existed because their high metabolic rate made it impossible to deal with the extreme temperatures. Only the polar regions provided a refuge from the baking heat.
Before the end-Permian mass extinction the Earth had teemed with plants and animals including primitive reptiles and amphibians, and a wide variety of sea creatures including coral and sea lillies.
This broken world scenario was caused by a breakdown in global carbon cycling. In normal circumstances, plants help regulate temperature by absorbing Co2 and burying it as dead plant matter. Without plants, levels of Co2 can rise unchecked, which causes temperatures to increase.
The study, published [19 October 2012] in the journal Science, is the most detailed temperature record of this study period (252-247 million years ago) to date.
Sun and his colleagues collected data from 15,000 ancient conodonts (tiny teeth of extinct eel-like fishes) extracted from two tonnes of rocks from South China. Conodonts form a skeleton using oxygen.
The isotopes of oxygen in skeletons are temperature controlled, so by studying the ratio of oxygen isotopes in the conodonts he was able to detect temperature levels hundreds of millions of years ago.
Professor Paul Wignall from the School of Earth and Environment at the University of Leeds, one of the study’s co-authors, said: “Nobody has ever dared say that past climates attained these levels of heat.
Hopefully future global warming won’t get anywhere near temperatures of 250 million years ago, but if it does we have shown that it may take millions of years to recover.”
The study is the latest collaboration in a 20-year research partnership between the University of Leeds and China University of Geosciences in Wuhan. It was funded by the Chinese Science Foundation.
‘Lethally hot temperatures during the early Triassic greenhouse’ by Yadong Sun (University of Leeds and China University of Geosciences), Michael Joachimski (University Erlangen-Nurnberg, Germany), Paul B. Wignall (University of Leeds), Chunbo Yan (China University of Geosciences), Yanlong Chen (University of Graz, Austria), Haishui Jiang (China University of Geosciences, Lina Wang (China University of Geosciences) and Xulong Lai (China University of Geosciences) is published in Science on 19 October 2012.
A large solar flare has burst forth from the sun, showcasing the awesome scale in the universe.
A gigantic solar flare, 100,000 miles across, has erupted from the sun, showcasing how truly great the scale of things can be in the universe. In comparison, the Earth only has a diameter of roughly 7926 miles.
An image of the solar flare. Earth would fit more than ten times along the length of the flare.
Solar flares are a massive energy release of the sun, sometimes up to a sixth of the sun’s total energy output, or 160,000,000,000 megatons of TNT, which can be seen as a sudden brightening in the sun and is often followed by a coronal mass ejection (CME), essentially a burst of solar material being flung out into the solar system.
These CMEs usually reach earth about one or two days later, and it is the earth’s interaction with these ionized particles which, together with regular solar winds, are the cause of auroras. If a solar flare is powerful enough though, they may cause damage, disturbing power grids and radio systems. A particularly disastrous solar flare may even permanently disable many electronic components, such as transformers, leading to widespread power outages.
Solar flares affect the entire solar system though; one hazard that would be encountered during a manned missions to Mars for example, would be the radiation emitted from solar winds, which the astronauts would somehow have to shield against during the entire flight.
The Bay Area was buzzing Wednesday night after a bright streak moved across the sky. It was accompanied by a loud boom.
This happened around 7:40 p.m.
Early bets said it was a meteor. The Orionids meteor shower is happening right now, but experts told NBC Bay Area that Wednesday’s streak was not from Orion because the earth is shielding us from those meteors tonight.
Whatever it was, it caught the attention of hundreds, if not thousands of people.
NASA Ames astronomer Peter Jennikens helped us get the photo at the top of this article and below. Jennikens said he will be up all night researching where the meteor may have landed. He will be out early Thursday morning looking for remnants. He’s hoping to get more video from security cameras that might have been rolling when the meteor hit.
Beppy Tobeler told us on our Facebook page that she saw it from Dublin Security Storage. “It was so low and close I thought it was someone setting off fireworks,” Tobeler said. She said it sailed across the sky and broke up in several pieces.
Steve Siegel said he saw it from Sunnyvale. He described it as a super bright streak going north about 30 degrees into the sky. He said it lasted for 7 or 8 seconds.
“I saw one giant, bright as close as a firework ball of light with long tail out visiting my parents in Forestville. One of the coolest things I’ve ever seen nothing at all like a shooting star,” Jessica Collins said on our Facebook page.
People at the Lick Observatory posted two raw clips of the what they said was a meteor breaking up over San Jose. It was taken by a security camera from the top of the observatory.
NASA posted on a science Website earlier this week that said this is the week to watch for the Orionid meteor shower caused by Halley’s Comet.
An article on NASA Science News said that every year in mid-to-late October, the Earth passes through a stream of dusty debris from Comet Halley. It promised sightings in the pre-dawn hours. Wednesday night’s streak was in the evening hours. Also, usually the meteor showers related to Hailey’s Comet are much smaller than what is being described.
NASA said that the highlight of the Orionid meteor shower is coming this weekend
“We expect to see about 25 meteors per hour when the shower peaks on Sunday morning, Oct 21st,” says Bill Cooke, the head of NASA’s Meteoroid Environment Office.
An extremely brief reversal of the geomagnetic field, climate variability and a super volcano
41,000 years ago, a complete and rapid reversal of the geomagnetic field occured. Magnetic studies of the GFZ German Research Centre for Geosciences on sediment cores from the Black Sea show that during this period, during the last ice age, a compass at the Black Sea would have pointed to the south instead of north. Moreover, data obtained by the research team formed around GFZ researchers Dr. Norbert Nowaczyk and Prof. Helge Arz, together with additional data from other studies in the North Atlantic, the South Pacific and Hawaii, prove that this polarity reversal was a global event. Their results are published in the latest issue of the scientific journal “Earth and Planetary Science Letters“.
What is remarkable is the speed of the reversal: “The field geometry of reversed polarity, with field lines pointing into the opposite direction when compared to today’s configuration, lasted for only about 440 years, and it was associated with a field strength that was only one quarter of today’s field,” explains Norbert Nowaczyk. “The actual polarity changes lasted only 250 years. In terms of geological time scales, that is very fast.” During this period, the field was even weaker, with only 5% of today’s field strength. As a consequence, the Earth nearly completely lost its protection shield against hard cosmic rays, leading to a significantly increased radiation exposure.
This is documented by peaks of radioactive beryllium (10Be) in ice cores from this time, recovered from the Greenland ice sheet. 10Be as well as radioactive carbon (14C) is caused by the collision of high-energy protons from space with atoms of the atmosphere.
The Laschamp event
The polarity reversal now found with the magnetisation of Black Sea sediments has already been known for 45 years. It was first discovered after the analysis of the magnetisation of several lava flows near the village Laschamp near Clermont-Ferrand in the Massif Central, which differed significantly from today’s direction of the geomagnetic field. Since then, this geomagnetic feature is known as the ‘Laschamp event’. However, the data of the Massif Central represent only some point readings of the geomagnetic field during the last ice age, whereas the new data from the Black Sea give a complete image of geomagnetic field variability at a high temporal resolution.
Abrupt climate changes and a super volcano
Besides giving evidence for a geomagnetic field reversal 41,000 years ago, the geoscientists from Potsdam discovered numerous abrupt climate changes during the last ice age in the analysed cores from the Black Sea, as it was already known from the Greenland ice cores. This ultimately allowed a high precision synchronisation of the two data records from the Black Sea and Greenland. The largest volcanic eruption on the Northern hemisphere in the past 100 000 years, namely the eruption of the super volcano 39400 years ago in the area of today’s Phlegraean Fields near Naples, Italy, is also documented within the studied sediments from the Black Sea. The ashes of this eruption, during which about 350 cubic kilometers of rock and lava were ejected, were distributed over the entire eastern Mediterranean and up to central Russia. These three extreme scenarios, a short and fast reversal of the Earth’s magnetic field, short-term climate variability of the last ice age and the volcanic eruption in Italy, have been investigated for the first time in a single geological archive and placed in precise chronological order.
DEDICATED
~October.15.2012~ You were a wonderful pet. I miss you already.
Information courtesy of NASA, NOAA, the US Library, the Goddard Space Flight Center, the Jet Propulsion Lab, the Environmental Visualization Laboratory, the NASA Earth Observatory, SDO, SOHO, Stereo, ISWA, SSEC, HAARP, and SolarIMG – Your information, images, and videos were essential to this video.
A massive fish kill on the Neuse River Tuesday washed up on the beach by Neuse Harbor. Mitch Blake, Neuse Riverkeeper, viewed the fish kill Tuesday afternoon, saying there were several hundred thousand washed up on the beach and in the river. For 21 days, mostly Atlantic menhaden have been dying over a large portion of the river from New Bern to Hancock Creek, Blake said.
Chuck Beckley/Sun Journal
By Eddie Fitzgerald, Sun Journal Staff
Published: Wednesday, October 17, 2012 at 15:35 PM.
A massive fish kill on the Neuse River that has been ongoing for nearly a month has resulted in thousands of menhaden washed up on beaches near Neuse Harbor.
Mitch Blake, Neuse Riverkeeper, viewed the area Tuesday afternoon, saying there were several hundred thousand dead fish washed up on the beach and in the river.
For 21 days, mostly Atlantic menhaden have been dying over a large portion of the river from New Bern to Hancock Creek, Blake said in an email.
Some of the dead menhaden have ulcers that National Oceanic and Atmospheric Administration officials have identified as Aphanomyces invadans from six samples analyzed in Beaufort. Fish samples were taken from the Neuse River in an impaired region by the Neuse Riverkeeper Foundation at the first sign of menhaden showing problems, Blake said.
“Over the 21-day period fish have been reported dead from New Bern to Hancock Creek and include areas in Slocum, Beard, Goose, Upper Broad, Northwest and Duck Creek,” he said.
Very few other species have been reported dead during the fish kill, except for isolated spots around Bay Point, which also had red drum, striped bass and spot.
“At this time we continue to see large schools of Atlantic menhaden, some floating, some are sinking to the bottom upon death,” Blake said. “An accurate count has not been totaled due to the massive area but just (Tuesday) I counted areas that were over 500 yards in length with approximately 90 dead fish per foot. With numbers like this it could easily go into the millions. In these areas there are dead, decaying, and in some cases just bones to reveal the timeline and magnitude of the kill.”
Joe Freemon, who lives in Neuse Harbor, said that on Tuesday there was a solid belt of dead fish on the beach of the river that bordered his property.
“You could stand there and see lots of others floating on top of the water,” Freemon said. “It’s the biggest (fish kill) I’ve seen and I’ve been on the water here over 50 years. You could smell it a couple of hundred feet away. … It’s a bad situation and unfortunate. ”
Blake said experts have told him the fish kill may continue due to the complexity of the area and lack of funding to run the proper analyzing equipment.
“There have been issues with oxygen, phytoplankton, stratification, nitrogen, pollutants among others, so the exact cause of death in the areas listed, has been complex to say the least,” he said.
Blake said he has been talking to a lot of people in the scientific community about what is causing the fish to die.
“I’m trying to put together a team to analyze it better,” Blake said.
As a nonprofit and staff of three to cover the Neuse Basin, The Neuse Riverkeeper Foundation depends on community support and volunteers.
“I’ve been working diligently to get information to the scientific community, the translation that comes from that is very important to the communities and people along the Neuse,” Blake said. “I think these menhaden stocks are extremely important to the dynamics of the estuary and millions of dead fish adding to the nutrient load creates its own set of concerns. As a community we have to address the impacts we have on the basin and we deserve to know where these impacts are coming from.”
Jill Paxson, environmental senior specialist with the N.C. Division of Water Quality, said for the past three weeks her office has been inundated with calls about menhaden fish kills, and not only in the Neuse River. There has been large kills in the Pamlico Sound also, she said.
Paxson said menhaden have a tough time living in a fresh and salt water estuary like the Neuse River. Some of the tributaries are shallow and the water can cool or warm up fast, causing a strain for the fish, she said.
“It is a very difficult place if you are a fish,” she said.
Paxson said as a precaution people should not go in the water around the fish or let their pets in the water and should wash if they do come in contact with the fish or water.
People usually don’t eat menhaden. They are on the bottom of the food chain and are eaten by larger fish like tuna and sharks, Paxson said.
Eddie Fitzgerald can be reached at 252-635-5675 or at eddie.fitzgerald@newbernsj.com. Follow him on Twitter @staffwriter3.
Today
Biological Hazard
Vietnam
Province of Dien Bien , Noong Luong Commune [Dien Bien District]
Cases of bird flu have been reported in Noong Luong Commune, Dien Bien District in the northern mountainous province of Dien Bien. Director of the provincial Department of Animal Health Cao Thi Tuyet Lan said bird flu outbreaks were discovered last Friday in two households in the commune’s Village 12, with nearly 720 livestock suffering from the disease. Three days later, local authority discovered nearly 400 other livestock infected with the H5N1 virus in Village 15. Since the outbreak, authorities have detected and culled more than 1,000 sick livestock in the commune. The province banned sick livestock from being transported, processed and traded out of the affected area, and closely supervised slaughter and trade in other districts and communes of the province. The provincial People’s Committee also quarantined the affected areas, and counted the number of livestock, especially ducks in Noong Luong Commune and Muong Thanh District, to ensure that a bird flu epidemic does not spread. The Department of Agriculture and Rural Development also gave guidance on carrying out preventive measures such as sterilisation of farms where infected poultry have been reported.
Biohazard name:
H5N1 – Highly pathogenic avian influenza virus
Biohazard level:
4/4 Hazardous
Biohazard desc.:
Viruses and bacteria that cause severe to fatal disease in humans, and for which vaccines or other treatments are not available, such as Bolivian and Argentine hemorrhagic fevers, H5N1(bird flu), Dengue hemorrhagic fever, Marburg virus, Ebola virus, hantaviruses, Lassa fever, Crimean-Congo hemorrhagic fever, and other hemorrhagic or unidentified diseases. When dealing with biological hazards at this level the use of a Hazmat suit and a self-contained oxygen supply is mandatory. The entrance and exit of a Level Four biolab will contain multiple showers, a vacuum room, an ultraviolet light room, autonomous detection system, and other safety precautions designed to destroy all traces of the biohazard. Multiple airlocks are employed and are electronically secured to prevent both doors opening at the same time. All air and water service going to and coming from a Biosafety Level 4 (P4) lab will undergo similar decontamination procedures to eliminate the possibility of an accidental release.
Officials closed beaches around Kanaha Beach Park Thursday morning after a shark bit a stand-up paddle board around 7:30 a.m. off of an area known as “Kite Beach,” or Kaa Point. Stand-up paddle boarder David Peterson of Pukalani was not injured, officials said. The 55-year-old paddle board and surfboard shaper said he was standing on his board waiting for waves to come in and “all of a sudden (I get) knocked off my board. I didn’t see anything.” He said the shark had a hold of his board and would not let go of it, so Peterson hit the shark with his paddle as he was in the water. The shark let go but then came between him and the board and with his hands Peterson pushed the shark away and jumped back on his board. Peterson said he suffered some scrapes from getting back onto the damaged board. Otherwise, he wasn’t hurt. The shark is estimated to be 6 to 8 feet long. Staff officials said it is unknown what type of shark was involved. Shark warning signs were to be posted, according to the state Department of Land and Natural Resources.
Biohazard name:
Shark attack (non-fatal)
Biohazard level:
0/4 —
Biohazard desc.:
This does not included biological hazard category.
Authorities in Bhaktapur’s Bode have culled more than 1500 chickens following a suspected outbreak of bird flu, health officials said. The outbreak of avian influenza initially killed 500 chickens out of 2000 at the poultry farm of a local Om Khadka. A meeting of health officials is underway at Bhaktapur to confirm whether the reported case is of bird flu.
Biohazard name:
H5N1 – Highly pathogenic avian influenza virus
Biohazard level:
4/4 Hazardous
Biohazard desc.:
Viruses and bacteria that cause severe to fatal disease in humans, and for which vaccines or other treatments are not available, such as Bolivian and Argentine hemorrhagic fevers, H5N1(bird flu), Dengue hemorrhagic fever, Marburg virus, Ebola virus, hantaviruses, Lassa fever, Crimean-Congo hemorrhagic fever, and other hemorrhagic or unidentified diseases. When dealing with biological hazards at this level the use of a Hazmat suit and a self-contained oxygen supply is mandatory. The entrance and exit of a Level Four biolab will contain multiple showers, a vacuum room, an ultraviolet light room, autonomous detection system, and other safety precautions designed to destroy all traces of the biohazard. Multiple airlocks are employed and are electronically secured to prevent both doors opening at the same time. All air and water service going to and coming from a Biosafety Level 4 (P4) lab will undergo similar decontamination procedures to eliminate the possibility of an accidental release.
Hundreds of birds have been culled in central Nepal following confirmation of a highly pathogenic avian influenza outbreak on a poultry farm. Animal health officials decided to cull all birds and destroy eggs suspected to be infected with a strain of H5N1 virus in Bhaktapur district, 15 km east of the capital Kathmandu. The Directorate of Animal Health killed 780 chickens at the poultry farm following the confirmation and around 150 crates of eggs and six sacks of feeds stored at the farm were also destroyed as part of preventive measures. Samples were sent to an animal health laboratory for examination after a sudden spurt in deaths at the farm. According to officials out of 2,500 chickens at the farm, 1,200 had already died of infection from the virus. “Surveillance will be intensified and veterinary officials deployed to monitor other poultry farms in the area,” said Dr Narayan Prasad Ghimire, a senior veterinary officer at Department of Animal Health. High alert was issued in and around Kathmandu to prevent the spreading of the virus.
A grenade left over from the second World War left 13 people needing hospital treatment in England. The casualties were exposed to toxic fumes after workmen disturbed the stockpile of phosphorous grenades left in the sealed-up cellar of a property in Bamber Bridge near Preston, Lancashire. It is thought one of the grenades, issued to members of the Home Guard during the war, was dislodged and cracked, Lancashire Fire and Rescue Service said. The devices, glass bottles about eight inches long, were intended to release a highly flammable mixture of phosphorus and benzene after being thrown, self-igniting on exposure to air. They were to be used by reservists against Nazi occupiers if Britain had fallen to German invasion, but had lain forgotten for almost 70 years in the sealed-off cellar of a former fire station, now used as a printing firm premises. A further six such devices were found in cellar space which had been bricked up for some years.
Firefighters were first called to reports of a fire at the premises of Sprint Print on Station Road in Bamber Bridge at 12.23pm yesterday. On arrival they established the smoke was in fact chemical fumes from what was thought to be a small container or bottle of acid in the cellar. Two drainage company employees investigating a report from the occupier of damp masonry are thought to have inadvertently dislodged one of the bottles in the stockpile, causing it to leak. They were exposed to the fumes and were injured along with three workers at Sprint Print. Of these five casualties, two suffered chemical burns and three experienced breathing problems. Two paramedics and six hospital staff at the Royal Preston Hospital – where the casualties had been taken – subsequently also complained of breathing difficulties. All 13 casualties responded well to treatment and have been allowed home. The cracked grenade was made safe and removed for disposal by an army disposal team and the rest of the stockpile will be disposed of in a controlled explosion, the fire service said.
Winds gusting up to 52 miles per hour and transformer fires were blamed for power outages Thursday that affected more than 2,000 homes and businesses in Sioux City. Service was restored to many of the homes within a few hours. The first outages were reported at 5:47 a.m. near 15th and Pierce streets. Outages caused by transformer fires were reported at 10:17 a.m. at 4105 Gordon Drive and about 12:30 p.m. at 2116 W. Third St. Officials at MidAmerican Energy Co. aren’t sure what caused the transformer fires but suspect the weather was a factor, company spokeswoman Tina Potthoff said. The company’s transmission system had been trouble-free before the powerful wind gusts arrived, she said. The top of a power pole exploded with a bang at Ultra No Touch Car Wash at 4105 Gordon Drive, said manager Brandon Swift. The flash was so intense, he thought something at the business had been struck by lighting.
[In accordance with Title 17 U.S.C. Section 107, this material is distributed without profit, for research and/or educational purposes. This constitutes ‘FAIR USE’ of any such copyrighted material.]
Tsunami Information Bulletin in Aru Islands Region Indonesia, Indian Ocean
000
WEIO23 PHEB 120037
TIBIOX

TSUNAMI BULLETIN NUMBER 001
PACIFIC TSUNAMI WARNING CENTER/NOAA/NWS
ISSUED AT 0037Z 12 OCT 2012

THIS BULLETIN IS FOR ALL AREAS OF THE INDIAN OCEAN.

... TSUNAMI INFORMATION BULLETIN ...

THIS MESSAGE IS FOR INFORMATION ONLY.

THIS BULLETIN IS ISSUED AS ADVICE TO GOVERNMENT AGENCIES.  ONLY
NATIONAL AND LOCAL GOVERNMENT AGENCIES HAVE THE AUTHORITY TO MAKE
DECISIONS REGARDING THE OFFICIAL STATE OF ALERT IN THEIR AREA AND
ANY ACTIONS TO BE TAKEN IN RESPONSE.

AN EARTHQUAKE HAS OCCURRED WITH THESE PRELIMINARY PARAMETERS

 ORIGIN TIME -  0032Z 12 OCT 2012
 COORDINATES -   5.1 SOUTH  134.1 EAST
 LOCATION    -  ARU ISLANDS REGION  INDONESIA
 MAGNITUDE   -  6.7

EVALUATION

 A DESTRUCTIVE WIDESPREAD TSUNAMI THREAT DOES NOT EXIST BASED ON
 HISTORICAL EARTHQUAKE AND TSUNAMI DATA.

 HOWEVER - THERE IS A VERY SMALL POSSIBILITY OF A LOCAL TSUNAMI
 THAT COULD AFFECT COASTS LOCATED USUALLY NO MORE THAN A HUNDRED
 KILOMETERS FROM THE EARTHQUAKE EPICENTER. AUTHORITIES IN THE
 REGION NEAR THE EPICENTER SHOULD BE MADE AWARE OF THIS
 POSSIBILITY.

THIS WILL BE THE ONLY BULLETIN ISSUED BY THE PACIFIC TSUNAMI
WARNING CENTER FOR THIS EVENT UNLESS ADDITIONAL INFORMATION
BECOMES AVAILABLE.

THE JAPAN METEOROLOGICAL AGENCY MAY ISSUE ADDITIONAL INFORMATION
FOR THIS EVENT. IN THE CASE OF CONFLICTING INFORMATION...THE
MORE CONSERVATIVE INFORMATION SHOULD BE USED FOR SAFETY.
The CVGHM (or VSI) raised the Alert Level for Paluweh to ORANGE on 13 October based on ‘seismic and visual monitoring without specifying the activity; eruptive activity is most definitely on-going.
The Darwin VAAC has detected no ash plumes from Paluweh in the past 7 days.
Radar data from ERS-1, -2 and Envisat show a central uplift of about 10 mm per year near the Uturuncu volcano (dark red). The surrounding region shows a slower subsidence at a rate of about 2 mm per year (blue). Data were acquired 1992–2010. Scientists refer to the deformation pattern as the ‘sombrero uplift’. Credit: Y. Fialko, SIO/UCSD
Brett Smith for redOrbit.com – Your Universe Online
Geophysicists at University of California, San Diego (UCSD) have identified a unique phenomenon in Altiplano-Puna plateau, located in the central Andes near the borders of Bolivia, Chile and Argentina.
Magma underneath the Earth’s crust is forcing the ground up in one spot, and at the same time sinking the ground around it. The result is something the researchers have described as the “sombrero uplift,” after the popular Mexican hat.
According to their report on the phenomenon, published in the journal Science, the two UC San Diego scientists recorded uplift in the crust that measured about 0.4 inches per year for 20 years across an area 62 miles wide; the surrounding area sunk at a lower rate—about eight-hundredths of an inch.
“It’s a subtle motion, pushing up little by little every day, but it’s this persistence that makes this uplift unusual. Most other magmatic systems that we know about show episodes of inflation and deflation,” said Yuri Fialko, a professor of geophysics at UCSD and Planetary Physics at the Scripps Institute of Oceanography.
Fialko and co-author Jill Pearse said the phenomenon was the result of a diapir, or a blob of magma, that rises to Earth’s crust like heated wax inside a lava lamp.
Using satellite data from European Remote Sensing (ERS) and Envisat missions, the geophysicists were able to study the uplift in great detail. In 2006, the team asked for the satellites to gather more data from their orbits over Altiplano-Puna.
“It was really important to have good data from different lines of sight, as this allowed us to estimate contributions from vertical and horizontal motion of Earth’s surface, and place crucial constraints on depth and mechanism of the inflation source,” Fialko said.
“Back in 2006, it looked like the satellites stopped acquiring data from the ascending orbits over the area of interest. Fortunately, ESA was very responsive to our requests, and generated an excellent dataset that made our study possible.”
“Satellite data and computer models allowed us to make the important link between what’s observed at the surface and what’s happening with the magma body at depth,” he added.
Fialko said the study’s findings could fuel future research around magmatic events, including the formation of large calderas. Although this diapir in the Altiplano-Puna plateau appears unlikely to cause such a phenomenon—the creation of large calderas, “supervolcanoes,” are highly destructive events that spew thousands of cubic kilometers of magma into the atmosphere. An event of this type would dwarf the Icelandic volcano eruption in 2011 that ejected large amounts of ash into the atmosphere and disrupted global air travel, Fialko said.
Diapirs have been known to exist before, but this new study is the first to recognize an active diapir currently rising through the crust. Fialko said a less prominent uplift phenomenon is taking place near Socorro, New Mexico.
The Altiplano-Puna plateau is a highly active area for magma and is part of a South American volcanic arc that extends along the northwest side of the continent. Experts have described the area as the largest known active magma body in Earth’s continental crust.
Source: Brett Smith for redOrbit.com – Your Universe Online
According to the Volcanological and Seismological Observatory of Manizales, an earthquake measuring 2.6 on the Richter scale occurred yesterday at 11:54 am. The communique also points out that the incident “is associated with rock fracturing within the volcanic edifice.” The volcano-tectonic earthquake occurred to the southeast of the main dome at a depth of 12.33 kilometers ( approx. 8 miles). Although the movement was felt in the district Tapias, rural zone of Ibagué, Eduardo Rodríguez, director of the Departmental Committee for Risk Management, confirmed that no emergencies have been reported thus far. The Cerro Machin volcano alert remains yellow. There have been three earthquakes reported in the vicinity of the volcano within a week. On Sunday two separate seismic occurrences were recorded at 9:32 and 9:35 pm with a magnitude of 4.6 and 3.9 on the Richter scale, respectively, located southeast of the main dome at a depth of 12 kilometers ( approx. 7 miles). The two municipalities which experienced the tremors are Cajamarca and Ibague.
The Klyuchevskoy volcano, the highest active volcano in Eurasia, has started erupting in Kamchatka, in the Russian Far East.
The luminescence over the volcano summit is evidence that glowing lava is flowing in the crater.
The volcano may start blowing out ash any moment now.
The Level of Concern Colour Code has been raised to Yellow, which is a potential danger warning for aircraft. The giant volcano last erupted from September 2009 to December 2010, and it began to again wake up in June this year. Klyuchevskoy volcano is 4,750 metres above sea.
A Japanese scientist has warned Mount Fuji is due for a “big-scale explosive eruption” that could affect millions of people and cause billions of dollars worth of damage.
It said the added pressure could have been caused by last year’s earthquake, which was followed a few days later by another large tremor directly underneath Fuji.
Professor Toshitsugu Fujii, the head of Japan’s volcanic eruption prediction panel, says an eruption could cause chaos and carnage all the way to Tokyo.
“Mount Fuji has been resting for 300 years now, and this is abnormal,” he told Saturday AM.
“It usually erupts in some form every 30 years.
“So the next eruption could be a big-scale explosive eruption.”
Ever since last year’s massive 9.0-magnitude earthquake off Japan’s north-east, the country’s meteorological agency has been keeping a closer eye on Mount Fuji.
Of even greater concern to the agency was a magnitude-6.2 quake right under the volcano a few days after the big one.
“It’s known that when a large earthquake happens, it can trigger a nearby volcano to erupt,” Professor Fujii said.
“That’s what happened 300 years ago, when Fuji erupted just 40 days after a big quake.”
If there is a large eruption, the government fears it could cause more than $30 billion in damage to public health and agriculture.
Ash accumulations in some areas could be as high as 60 centimetres.
Even Tokyo, 100 kilometres to the north-east, could be coated in volcanic ash.
“Volcanic rocks will fall near the mountain,” Professor Fujii said.
“Tokyo will be covered in a few centimetres of ash. Yokohama will be under 10 centimetres.
“Trains will stop, planes won’t fly and crops will fail.
“Millions will be affected.”
For the hundreds of thousands who live in the shadow of Fuji, an eruption is a constant worry.
Haruo Tomitsuka, a professional photographer who lives by a lake on the east side of the mountain, has been taking photos of Fuji for nearly three decades.
“I’m worried about an eruption, but mostly I worry it will change the beautiful shape of the mountain,” he said.
But for now Fuji remains a sleeping giant, and everyone living in the shadow of the national symbol is hoping the volcano’s slumber will long continue.
12.10.2012
Volcano Activity
Indonesia
East Nusa Tenggara, [Mount Rokatenda Volcano, Pulue Island]
Hundreds of local residents have been forced to evacuate as hot ashes spewed by Mount Rokatenda in Pulue Island, Sikka, East Nusa Tenggara on Thursday. “Volcanic ashes have reached four villages: Nitunglea, Rokirole, Kesokoja and Lidi. Our team has distributed masks and medicine for the residents,” Sikka disaster management agency head Silvanus Tibo said on Friday. Rokatenda’s volcanic activities have increased since Oct. 1, records show that there have been more than 50 volcanic earthquakes and 15 local tectonic earthquakes coupled with flames. The volcano’s last eruption was on March 23, 1985, with volcanic ashes reaching two kilometers above the mountain’s peak. Rokatenda also erupted during the period of Aug. 4 to Sept.25 1928. Nearly 6,000 people are currently living in four villages surrounding Mount Rokatenda.
The highest active volcano in Eurasia, Klyuchevskaya Sopka has started to erupt, officials with the Institute of Volcanology and Seismology said. On the night of October 15, there was light seen over the summit of the volcano indicating a blowout of lava in its crater, Vesti.ru reports. Experts believe the release of ash to the height of 6 feet above sea level may start any moment. Lava flows on the slopes of the volcano are also expected. Yellow aviation color code has been assigned to the volcano to warn about the potential danger that the volcanic ash and gases may pose to aircraft engines. Nothing has been said about the possible threat to human settlements. The nearest settlement is 30 kilometers far from Klyuchevskaya Sopka. The last eruption of Klyuchevskaya Sopka took place from September 2009 to December 2010. In June this year, the giant began to wake up again.
SNOW has fallen across New South Wales and the ACT as a cold snap hits the region.
The unseasonal weather saw residents in areas including the Blue Mountains and southern tablelands waking up to snow on Friday.
There is also snow around Canberra, following the coldest October day there in more than 40 years. There was a maximum temperature of 8C in the Canberra area on Thursday, 11 degrees below the October average and the coldest since 1967.
Overnight snow fell in the hills between Canberra and Bungendore and in areas around Goulburn and Crookwell to the north.
The Bureau of Meteorology said many areas could see snow, frost and hail as the result of a low pressure system moving across NSW.
“We’ve had quite a few reports of snow. We’re expecting snow down to 700m over many parts of the state,” said meteorologist Julie Evans.
Sussex Inlet on the south coast experienced a thunderstorm about 4am on Friday, with “extensive small hail” falling, Ms Evans said.
“We do get this late season snow but it doesn’t happen very often,” she added.
“The last time was in 2008 when we saw snow in the Snowy Mountains and central tablelands in November.”
In some areas, the temperatures will struggle to reach double figures on Friday, with central western Orange seeing a high of 9C. On Saturday, temperatures will dip below zero with Walcha, in the state’s north, due to get a low of -4C.
The low pressure was expected to affect Sydney in the form of heavy rain on Friday, along with a “sharp increase in wind”, Ms Evans said.
Coastal areas will bear the brunt and surfing conditions were described by the meteorologist as dangerous.
On Saturday there is likely to be extensive frost up and down the tablelands but temperatures are set to improve across the state as the weekend progresses.
Ausgrid has warned residents in Sydney, the Central Coast and Hunter Valley to beware of powerlines that may have fallen as a result of the bad weather.
Ulladulla on the NSW south coast was hit by strong winds and rainfall.
The town saw 225mm of rain fall in less than 24 hours and there were gusts of 47 knots on Friday morning, approaching 90km an hour.
South of the town, heavy storms led to even higher falls, with 288mm at Burrill Lake in the same period.
In Sydney, large swells caused the cancellation of ferries between Manly and Circular Quay.
The Great Western Highway has been closed in both directions at Wentworth Falls due to heavy snow and black ice.
At least 19 people were killed and an estimated 1,500 fishermen are missing after tropical storms smashed into Bangladesh’s southern coastal islands and districts early Thursday, police said.
Police said at least 1,500 mud, tin and straw-built houses were also levelled in the storms that swept Bhola, Hatiya and Sandwip Islands and half a dozen coastal districts after Wednesday midnight.
At the worst-hit island of Hatiya, at least seven people were killed after they were buried under their houses or hit by fallen trees, said local police chief Moktar Hossain. More than 1,000 houses were flattened.
“More than 100 fishing trawlers, each carrying at least 10 fishermen, have been missing since the storm,” he told AFP, calling it one of the most powerful in decades.
Many fishermen are expected to have taken shelter in other remote islands in the Bay of Bengal or in the neighbouring Sundarbans, the world’s largest mangrove forest.
In the past, many fishermen thought to be missing from storms returned home to coastal villages a week or two later.
Four people were killed in Bhola, three each in Sandwip and Companyganj and two at Char Jabbar, police said.
The police chief of Bhola district, Bashir Ahmed, told AFP more than 500 fishermen were missing from the country’s largest island and at least 500 mud and straw-built houses were levelled by the sudden storm.
Bangladesh’s weather office forecast heavy rain in the coastal region and advised fishermen to take care near the shore, but there was no major storm warning.
“We only got the warning signal number three. But the storm was so powerful, the weather office should have hoisted the signal number seven or eight,” said Ahmed, referring to the intensity of the storm on a scale of ten.
“It caught the fishermen and coastal people by surprise. Till now we haven’t had any reports from the missing fishermen,” he said, adding the authorities had sent relief to thousands of affected people.
The provincial government of South Cotabato has ordered the evacuation of around 600 residents from three upland communities in Lake Sebu town following a series of landslides in the area since last week. Lawyer Hilario de Pedro III, acting Provincial Disaster Risk Reduction and Management Office (PDRRMO) chief, said Friday they decided to evacuate residents from sitios Bentung, Lemuti and Tokobokong in Barangay Lamlahak, Lake Sebu to avert a possible tragedy due to the threats of landslides in the area. He said the three communities are considered as high-risk or in a danger zone due to the “multiple landslides” that occurred in the area since September 28. A PDRRMO report cited that the landslides initially displaced 109 families in the area.
It said the incident was caused by almost a week of continuous rains that eventually triggered several ridges of the area’s barren mountain slopes to give in. “(The rains) generated earth cracks which caused the soil descent,” de Pedro said. John Lorca, PDRRMO’s disaster operations chief, said 25 families were also affected in another landslide that occurred in the area earlier this week. He said two houses were destroyed in the incident, which was caused anew by the heavy rains in the area. Lorca said that three to four hectares of the area’s mountains were deemed highly vulnerable to landslides due to the presence of ground cracks. De Pedro, who is also the acting provincial administrator, said 155 families or a total of 620 individuals have been evacuated from the affected communities. He said the provincial government initially delivered food and other relief items to the evacuees, who are currently taking temporary shelter at the village center in Lamlahak. The official said they initially requested the Department of Environment and Natural Resources’ Mines and Geosciences Bureau (MGB) to conduct an assessment of the affected areas and determine whether it’s still safe for the residents to return there.
Significant damage from a possible tornado has been reported in Monroe County in northeast Mississippi. Law enforcement reported the roof of a home was removed with numerous trees downed about three miles south southeast of the town of Wren at around 7:04 p.m. Sunday. The National Weather Service issued a tornado warning for northern Monroe County from 6:52 p.m. to 7:30 p.m., indicating that a rotating severe storm was located near Wren and or seven miles northwest of Aberdeen, moving east at 25 mph. Luckily, there have not been any reports of injuries. The severe storm was associated with a cold front that was moving across the state. Mississippi is approaching what is considered the state’s second severe weather season in the late fall. The month of November is historically the second most active month for tornadoes behind April. The state observes Severe Weather Awareness Day on Oct. 24. Statewide tornado drills will also be conducted.
Forecasters say strong winds spun up a small tornado in Mayfield. Only one injury was reported after the storm on Sunday, but property damage included the scoreboard toppled at War Memorial Stadium. Graves County Sheriff Dewayne Redmon said Lions Club Park was heavily damaged. National Weather Service meteorologist Rick Shanklin said an EF-1 tornado struck near the Mills Manor nursing home with winds of 105 mph. No residents of the home were hurt, but cars were moved about in the parking lot and car windows blew out. Graves County Emergency Management Director Jamey Locke said at least two businesses and about a dozen homes were damaged. A homeowner was injured when the storm blew the roof of another building into his house.
A small tornado damaged a farm in Lexington, about 70 miles east of Austin in Lee County. Cecil and Darene Rexroat’s home in lexington was hit hard Saturday night. “It was like a bomb went off,” said home owner Darene Rexroat. The damage is easy to see. The tin on the roof crumpled like paper. Limbs of a centuries old tree broken off and thrown around the yard. Glass shattered and scattered inside. “About 6:45, apparently, there was a tornado that came through here. We weren’t at home,” said Darene Rexroat. Dispatchers at the Lee County Sheiff’s Office said the tornado was small, and quickly disappated after touching the ground. The Rexroat home took most of the damage. “It was scary. It was scary not knowing what, what was damaged or how damaged or anything like that because we couldn’t get in because the electrical line was laying on the ground so we didn’t go anywhere near it,” said Darene. Rexroat says professionals will come look at the house monday. In the mean time, she and her husband will be hard at work. A task that will be made a little easier with the company of friends and neighbors. Helping the Rexroat’s find serenity and peace among the destruction.
An unkown disease showing symptoms of fever is now fast spreading in Tamu town, neighbouring Moreh on the Indo-Myanmar border. The disease is suspected to be dengue. An official of the National Vector Borne Disease Control Society, however, maintained that they have received reports about outbreak of an unknown disease showing symptoms of fever but no definite information about the particular disease has been received so far.
Biohazard name:
Unknown fever illness (Susp. Dengue)
Biohazard level:
3/4 Hight
Biohazard desc.:
Bacteria and viruses that can cause severe to fatal disease in humans, but for which vaccines or other treatments exist, such as anthrax, West Nile virus, Venezuelan equine encephalitis, SARS virus, variola virus (smallpox), tuberculosis, typhus, Rift Valley fever, Rocky Mountain spotted fever, yellow fever, and malaria. Among parasites Plasmodium falciparum, which causes Malaria, and Trypanosoma cruzi, which causes trypanosomiasis, also come under this level.
The most bizarre theory was from a man convinced Daleks had surrounded the city
By Lloyd Burr
News of the ‘Wellington hum’ has reverberated across the country with the local council inundated with calls on theories about the phenomenon.
The Wellington City Council says calls have flooded in since the noise was first reported in parts of the city three days ago.
The cause of the noise is still unknown but council spokesperson Clayton Anderson says there are several theories floating around.
“We’ve had around 20 phone calls and got around a dozen emails from around New Zealand from people speculating what it is,” he says.
One theory is that the Wellington sewerage pump station is reverberating through the pipes into people’s house.
Another caller said the work being carried out on the Mt Victoria Tunnel ventilation shaft could be producing a low-pitched hum.
The most bizarre theory was from a man convinced Daleks – fictional mutant aliens from the TV series Doctor Who – had surrounded the city.
But Daleks or not, it appears the noise is spreading with the council receiving its first call from a resident in Berhampore last night.
It takes the total to around 20 noise complaints from Mt Victoria, Mt Cook, Newtown, Berhampore and Karori.
“We’ve put the word out to our business units about what could potentially be making that noise and they’ve all come back saying it’s not us,” says Mr Anderson.
He says the council will continue to go out and monitor noise complaints.
Authorities in Bhaktapur’s Bode have culled more than 1500 chickens following a suspected outbreak of bird flu, health officials said. The outbreak of avian influenza initially killed 500 chickens out of 2000 at the poultry farm of a local Om Khadka. A meeting of health officials is underway at Bhaktapur to confirm whether the reported case is of bird flu.
Biohazard name:
H5N1 – Highly pathogenic avian influenza virus
Biohazard level:
4/4 Hazardous
Biohazard desc.:
Viruses and bacteria that cause severe to fatal disease in humans, and for which vaccines or other treatments are not available, such as Bolivian and Argentine hemorrhagic fevers, H5N1(bird flu), Dengue hemorrhagic fever, Marburg virus, Ebola virus, hantaviruses, Lassa fever, Crimean-Congo hemorrhagic fever, and other hemorrhagic or unidentified diseases. When dealing with biological hazards at this level the use of a Hazmat suit and a self-contained oxygen supply is mandatory. The entrance and exit of a Level Four biolab will contain multiple showers, a vacuum room, an ultraviolet light room, autonomous detection system, and other safety precautions designed to destroy all traces of the biohazard. Multiple airlocks are employed and are electronically secured to prevent both doors opening at the same time. All air and water service going to and coming from a Biosafety Level 4 (P4) lab will undergo similar decontamination procedures to eliminate the possibility of an accidental release.
Symptoms:
Status:
confirmed
Today
Environment Pollution
USA
Gulf of Mexico, [Location of Deepwater Horizon disaster]
The Federal On-Scene Coordinator for the Deepwater Horizon oil spill in New Orleans issued a Notice of Federal Interest to BP and Transocean Tuesday. Coast Guard Capt. Duke Walker issued the NOFI following sample results from an oil sheen located in the vicinity of where the Deepwater Horizon drill rig exploded and sank more than two years ago. The sheen was first reported to the National Response Center Sept. 16 by BP based on satellite images from the 9th and 14th overpasses in the Mississippi Canyon, block 252, approximately 50 miles off the coast of Louisiana. The sheen is not feasible to recover and does not pose a risk to the shoreline. The Coast Guard, in concert with BP and NOAA, has conducted regular assessments of the sheen by aircraft and boat since its discovery. The observed sheen size has varied over time depending upon the conditions present. Samples of the sheen were taken by Coast Guard Marine Safety Unit Morgan City Sept. 26 and sent to the Coast Guard Marine Safety Lab in New London, Conn. The Marine Safety Laboratory results indicate the sheen correlates to oil that originated from BP’s Macondo Well. The exact source of the sheen is uncertain at this time but could be residual oil associated with wreckage and/or debris left on the seabed from the Deepwater Horizon incident in 2010. The NOFI effectively informs BP and Transocean that the Coast Guard matched the sheen samples to the Deepwater Horizon spill or sunken drilling debris and that either party or both may be held accountable for any cost associated with further assessments or operations related to this sheen. The Gulf Coast Incident Management Team remains committed to the continued cleanup of the Gulf Coast and all shorelines affected as a result of the Deepwater Horizon oil rig explosion. The FOSC is determined to continue response activities to remove all oil where it is technologically feasible, environmentally beneficial and safe for workers to perform recovery operations.
About 18,000 DTE Energy customers are without power after high winds blasted through southeast Michigan overnight. The outages include 7,000 customers without power in Wayne County, with the rest scattered throughout Macomb, Oakland and Washtenaw counties, DTE spokesman Scott Simons said this morning. “They should be back by sometime today,” Simons said. “It was high winds: gusts up to 45 miles per hour.” DTE provides electric power to 2.1 million customers throughout southeast Michigan. The power outage closed Detroit Public Schools’ Thirkell Elementary, 7724 14th Street, for the day today. National Weather Service meteorologist Mike Richter said today that the highest winds blew through between 8 p.m. and midnight Sunday. High gusts at 44 m.p.h. were clocked at Detroit Metro Airport at 9:52 p.m. Sunday and City Airport 10:42 p.m. “It was a really strong cold front that moved through, so we had a good burst of wind,” Richter said this morning from the agency’s White Lake Township office. “We’re going to have gusts about 25 m.p.h through most of the day today — considerably cooler today. It’s not going to get much warmer than what it is now.” Today’s high temperature is expected to reach 53 degrees, with a 30% chance of light showers across the region, he said. Temperatures will start to climb again on Tuesday, with a high of 60 degrees and a high of 70 degrees expected on Wednesday. Another front arrives with chances of rain Wednesday night and into Thursday, Richter said. Temperatures will drop again to highs around 60 on Thursday, then down to highs in the mid-50s for the weekend. “It’s going to be a little bit of a roller coaster ride,” Richter said.
At a meeting with New England commercial fishermen last December, physical oceanographers Glen Gawarkiewicz and Al Plueddemann from the Woods Hole Oceanographic Institution (WHOI) were alerted by three fishermen about unusually high surface water temperatures and strong currents on the outer continental shelf south of New England.
“I promised them I would look into why that was happening,” Gawarkiewicz says.
The result of his investigation was a discovery that the Gulf Stream diverged well to the north of its normal path beginning in late October 2011, causing the warmer-than-usual ocean temperatures along the New England continental shelf.
The researchers’ findings, “Direct interaction between the Gulf Stream and the shelfbreak south of New England,” were published in the August 2012 issue of the journal Scientific Reports.
To begin to unravel the mystery, Gawarkiewicz and his colleagues assembled data from a variety of sources and recreated a record of the Gulf Stream path during the fall of 2011.
First, they tapped into data collected by a program called eMOLT, a non-profit collaboration of fishing industry, research, academic and government entities, run by James Manning of National Oceanic and Atmospheric Administration’s Northeast Fisheries Science Center. For more than a decade the program has recorded near-bottom ocean temperatures by distributing temperature probes to lobstermen.
Manning and scientists from WHOI, including Robert Todd and Magdalena Andres, analyzed a time series of temperatures from two eMOLT sites, OC01 and TA51, which were located over the outer continental shelf near the shelfbreak, and identified two events when temperatures suddenly increased by 6.2 and 6.7 degrees C, respectively, to highs of more than 18 degrees C.
“These are very dramatic events for the outer continental shelf, at least 2 degrees C warmer than we’ve seen since 2001,” says Gawarkiewicz. “Near-bottom temperatures of 18 degrees C on the outer shelf are extremely high for late autumn.” The maximum recorded temperature in December 2011 was the warmest bottom temperature recorded in 6 years of records at the OC01 site.
In typical years, the warm Gulf Stream waters only indirectly influence ocean currents and temperatures near the continental shelfbreak south of New England when eddies, called warm core rings, pinch off from the Gulf Stream and drift toward the outer continental shelf. Such rings normally drift past a site after a few weeks, and therefore cause only limited warming of the water on the outer shelf.
Gawarkiewicz and his colleagues collected additional data on water temperature and salinity from December 4, 2011 through January 4, 2012, from instruments on temporary test moorings placed 12 km south of the shelfbreak by the Ocean Observatories Initiative (OOI). The researchers compared those salinity measurements to historical data, and discovered that high salinity levels – consistent with the salinity of waters carried by the Gulf Stream – coincided with the warming periods.
The extent and duration of the two 2011 warming events combined with the high salinity observed by the researchers suggested the cause was not a transient warm core ring, but the Gulf Stream itself that carried warm, salty water to the outer shelf.
To solidify that finding, Gawarkiewicz received serendipitous help from students in the Marine Advanced Technology Education (MATE) program at Cape Fear Community College in Wilmington, NC, who had deployed a surface drifter during the period coinciding with the two warming events. Drifters use satellites to transmit their positions roughly every six hours, key information for the WHOI scientists, who analyzed the drifter tracks and speeds.
“Drifters around the edges of warm core rings drift toward the continental shelf at about 1 knot,” Gawarkiewicz says. “But we saw the drifter cut across the slope towards the shelf at about 2.5 knots. It only took it eight days to travel from Cape Fear, North Carolina, to a point 40 miles south of Georges Bank, a total distance of 580 miles.”
The periods of high speeds for the drifters coincided with the records for high temperatures on the outer shelf, which told the scientists that the core of the Gulf Stream had diverted to 39.9 degrees N at 68 degrees W – 125 miles north of its mean position, further north than had ever been recorded by satellite altimeters at this particular longitude.
The temporary shift in Gulf Stream path observed last fall potentially has significant longer-term implications. Studies have shown that temperature increases of 2 degrees C have caused major shifts in silver hake populations, for example, and in spring 2012, migratory bluefish and striped bass were observed off the coast of Cape Cod much earlier than in previous years.
But, the scientists say, more research is needed to determine just how the Gulf Stream’s behavior in 2011 affected the continental shelf ecosystem and marine organisms.
It is unclear what might have caused this shift in the Gulf Stream path. It occurred shortly after Hurricanes Irene and Katia drenched the east coast with rain, and this might have impacted the Gulf Stream separation from the continental shelf near Cape Hatteras.
Another possibility is that a cold core ring, an eddy south of the Gulf Stream core, might have deflected the Gulf Stream. Further research will be necessary to determine exactly how and why this occurred, which will be helpful in the long term in predicting Gulf Stream motions.
In the meantime, Gawarkiewicz and his colleagues will be keeping an eye on what the Gulf Stream does this fall, with the hope of someday being able to predict such a shift. “We’re checking in from time to time to monitor it. We’ll be talking to the fishermen, and academics, and keeping an eye on things,” he says.
Fishermen David Spencer, Fred Mattera, and Norbert Stamps first alerted the researchers to the anomaly. Profile data were made available by the OOI, which is funded by the National Science Foundation and managed by the Consortium for Ocean Leadership. Tim Shaw and David Calhoun at Cape Fear Community College provided drifter data. WHOI scientists on this project were supported by the NSF, the Cooperative Institute for the North Atlantic Region, the Penzance Endowed Fund in Support of Assistant Scientists, and the Postdoctoral Scholar Program at WHOI.
[In accordance with Title 17 U.S.C. Section 107, this material is distributed without profit, for research and/or educational purposes. This constitutes ‘FAIR USE’ of any such copyrighted material.]
Parts of Washington and Oregon are in the midst of silent earthquakes this week. You can’t feel this so-called “slow slip” quake and it doesn’t cause damage. Still, scientists want to learn more about the recently discovered phenomenon.
Little is certain so far, but there’s a possibility these deep tremors could trigger a damaging earthquake or serve as a warning bell for the Big One.
A bank of computer monitors covers one wall of the University of Washington seismology lab. Some display seismograph readouts that look like jagged mountain ranges stacked one over the other. A big screen shows a current map of tremors under the Pacific Northwest. It is lit up with activity.
“Each dot represents the location of a five minute burst of tremor,” says earth scientist Ken Creager.
He scrutinizes a dense slash of blue, yellow, green and red dots. The arc stretches south from mid-Vancouver Island, goes under the Olympic Peninsula, Puget Sound and peters out south of Olympia. A separate patch of color radiates out from near Roseburg, Ore.
Washington State Seismologist John Vidale is also keeping an eye on the busy map.
“This kind of earthquake is distinctly different than the earthquakes we have been watching for a hundred years, because this patch of fault that we’re watching takes three weeks to break. Whereas ordinarily something a hundred miles long would take a minute or less to break.”
“About half of our instruments can see it,” Vidale adds. “It’s a very slight level of rattling. I don’t think I have ever heard of somebody who we believed could feel it.”
Local seismologists woke up to the phenomenon about a decade ago and have since discovered a big non-volcanic tremor swarm happens fairly routinely around here — every 14 months or so in western Washington, a little less often in Oregon and more often in northern California.
Scientists have coined a variety of names including “slow slip quake” or “episodic tremor and slip” to describe what they’re seeing.
Vidale says the mechanisms at work deep underground remain fairly mysterious. This current slow slip quake under the Salish Sea has lasted five weeks. Creager says scientists have calculated that a significant event like this releases the equivalent energy of a magnitude 6.5 regular quake.
“It’s a lot of energy being released,” Creager says. “It just happens so slowly that you’re not going to feel it. This is the way we like to see energy released.”
But there’s a flip side. The grinding and slippage at depth increases the strain closer to the surface where the North American plate and the oceanic plate are stuck together or “locked.” When that offshore fault zone eventually gives way, we get the damaging Big One.
University of Oregon Professor David Schmidt makes an analogy to a car teetering partway over a cliff.
“And these small slow slip events are somebody standing behind that car giving it a little nudge every several months. So even though the nudge is small, at some point that nudge might be enough to kind of tip us over the edge and cause the car to fall off the cliff.”
Or set off the Cascadia megaquake in this analogy.
Schmidt points to a study published in the journal Science that describes how last year’s great earthquake and tsunami in Japan was preceded by slow slip and tremor near the epicenter.
John Vidale mentions another killer earthquake, in Turkey in 1999, where instruments picked up a slow slip precursor.
“One of the goals of our research is to say, how often does that slow slip trigger a great earthquake? How often are great earthquakes triggered by slow slip? That’s almost completely unknown at this point.”
Vidale and his colleague Creager are more certain that we don’t need to quake with worry. They note that great earthquakes strike very infrequently in the Northwest.
So even if a megaquake becomes more likely during a slow slip event, the chances of one happening are still quite slim.
The eruption of a so-called maar-diatreme volcano is short-lived but violent. Magma creeps up through a crack in the Earth’s crust and mixes with water, setting off a series of explosions — as many as a few each hour for several weeks. When the action stops, a crater-topped, rock-filled fracture called a diatreme is left behind. Now researchers are proposing a new way to think about how these structures are formed, which could help geologists predict eruptions and find new sources of diamonds. “Previously it was thought that those explosions started at very shallow levels and got progressively deeper,” geologist Greg Valentine, a professor at the University at Buffalo in New York, told LiveScience. This old model seemed to explain the shape of a diatreme, which sits like an inverted cone beneath a shallow maar, or crater. But that model didn’t match with what geologists were finding at volcanic sites, Valentine said. If the explosions started at shallow levels and moved deeper, shallow rocks would be spewed from the mouth of the volcano first and the deeper rock deposits would pile up on top. At maar sites, however, scientists were finding deep rock fragments mixed mostly with shallow fragments, indicating that explosions occur at essentially every depth throughout the episode. Valentine and James White, an associate professor at the University of Otago in New Zealand, created a new model to account for the apparently more jumbled order of explosions. Their model, published online Sept. 18 by the journal Geology, also shows that individual explosions are relatively small, and shallow explosions are more likely than deep explosions to cause eruptions. The last known maar-diatreme eruption occurred in 1977 in Alaska’s remote Aleutian Range, forming two vents known as the Ukinrek Maars. The threats associated with these volcanoes tend to be localized, but they can still be significant, Valentine said. “These volcanoes can send ash deposits into populated areas. They could easily produce the same effects that the one in Iceland did when it disrupted air travel, so what we’re trying to do is understand the way they behave,” he explained in a statement.
A volatile volcano in northern Indonesia erupted Sunday, spewing smoke and ash that caused muddy rain to fall in nearby villages, an official said. Mount Lokon in North Sulawesi province rumbled as heavy rain fell around its cloud-covered crater, local monitoring official Farid Ruskanda Bina said. He said the sound was heard 5 kilometers (3 miles) away but the height of the eruption was not visible. The ash made the rain thick and muddy in six villages, Bina said. “Soldiers are distributing masks to the villagers,” he said. There was no plan for evacuations because the nearest villages are beyond the danger area, he said. More than 33,000 people live along the fertile slopes of the 5,741-foot (1,750-meter) mountain. Mount Lokon is one of about 129 active volcanoes in Indonesia. Its last major eruption in 1991 killed a Swiss hiker and forced thousands of people to flee their homes.
A slight increase in shaking was reported at Etna volcano on the island of Sicily but it does not appear in danger of eruption, volcano experts said Friday. Activity on a recently opened crater has been registered since Wednesday, Italian news agency ANSA reported. The activity has been accompanied by “a slight increase in volcanic shaking,” volcano experts said. Etna has experienced nine “eruptive events” this year. The volcano belched a plume of smoke in a full-blown explosion in January that led to the temporary closure of Catania airport.
Recently, fire occurrence surveys were conducted in Namtumbo and Tunduru districts, covering all villages in Selous-Niassa Wildlife Protection Corridor (SNWPC) Project Area. The surveys were conducted by teams composed of staff belonging to natural resources sectors.Similar situations where wild fires are seen include Coast Region, Morogoro, Singida, Kigoma and Mara. The selected area served as a study case to general situation in rural areas where this dry season phenomenon is common to the detriment of the environment.It has been found that the major cause for fires is shifting cultivation but other factors also come into play, such as poachers, lumberers, honey gatherers and charcoal burners. Also cases of accidental fires cannot be ruled out. However, fires that occur often get out of hand due to lack of action from villagers as well as lack of laws to control fire occurrences and where laws exist there is a lot of laxity in enforcing them. The report compiled by staff from Natural Resources Sector revealed that incidents of wildfire have increased along with effects of climatic changes. Fires are rare in the wet season because the grass usually has high water content to burn properly. The above situation is also applicable to other areas in Coast Region, Morogoro and Tanga, since wildfires are a commonplace in many parts during the dry season.The majority of interviewed residents and villagers agreed that wildfires tend to occur during the dry season, from July to November. This is the time when the grass is tinder dry and, unfortunately, wild fires can often get out of hand. Again, this is the period most peasants are preparing their plots for the next farming season.The fires are used as short-cut measures in removing long grasses and thick bushes.
Rescuers have found the bodies of all 18 children buried when a landslide engulfed their primary school in China as they made up classes lost due to recent deadly earthquakes, state media said Friday.
The landslide, triggered by sustained rains, buried the school and three farmhouses on Thursday in the village of Zhenhe in Yunnan province where a pair of earthquakes last month killed 81 people and injured hundreds.
Any last hope for survivors evaporated early Friday when rescuers pulled the body of the last missing child from the landslide debris, China National Radio said in a report on its website.
The disaster in the village of Zhenhe is likely to raise questions over why the children had been brought back into the school, located in a deep mountain valley, when the rest of China was on a week-long national holiday.
But local officials have said the children needed to make up class time lost due to disruptions stemming from the September 7 earthquakes.
China has a highly competitive education system built around cramming for high-stress testing that determines entry into good schools later.
A local villager also was buried under the rubble and has yet to be found by rescuers, China National Radio said.
State media reports initially identified the school as the Youfang Primary School, but subsequent reports have said its official name is the Tiantou Primary School.
School safety is a sensitive issue in China after thousands of students died when an 8.0-magnitude tremor centred in Sichuan province rocked the southwest of the country in 2008.
Many schools collapsed in that quake, which killed more than 80,000 people.
This led to accusations that corner-cutting in construction projects and possibly corruption led to shoddy buildings, especially as many buildings near such schools held firm.
There have so far been no such allegations in the Yunnan landslide.
However, like many schools, homes, and other structures in the rugged region, the disaster-hit primary school was located at the base of steep slopes.
Mountainous southwestern China is prone to deadly landslides, a threat worsened by frequent seismic activity.
The 2008 earthquake triggered giant landslides that left whole mountainsides scarred.
The students killed in Thursday’s landslide were from another school who were brought in to study because their own school had been too heavily damaged in last month’s quakes, state-run Xinhua news agency said.
The two 5.6-magnitude quakes left more than 820 people injured and 201,000 displaced in the poor region.
Thursday’s landslide also blocked a nearby river, creating a lake and forcing the evacuation of more than 800 residents living downstream, the agency said.
Almost 2,000 people had been mobilised to unblock the waterway and help in the rescue, it said.
At least 30 students had been scheduled to resume classes at the school in Zhenhe. Those who were unharmed by the landslide will resume classes at a nearby school, Xinhua said.
Rescuers say a rockslide slammed into Italy’s popular Way of Love hiking trail in the coastal Cinque Terre resort area, injuring four Australian women. One was crushed by rocks and another was knocked off the steep path. Dr. Davide Battistella said those two hikers were in grave condition and two others were less seriously injured by the landslide Monday morning on the trail, which cuts into a steep hillside overlooking the Ligurian Sea south of Genoa. Battistella told The Associated Press that one woman was dug out from under the rocks and flown by helicopter to a hospital. The woman who landed on a precarious perch on the hillside was carried out by a human chain of rescuers. The Cinque Terre area is breathtakingly beautiful but geologically fragile.
(Reuters) – A steroid medication linked to the death of at least five people from rare fungal meningitis may have been administered to patients in 23 states, the U.S. Centers for Disease Control said on Thursday, raising fears the rare outbreak could spread.
In a briefing for reporters, the CDC said five people had died so far and 35 had taken ill from fungal meningitis in six states. The outbreak was first reported in Tennessee, where three people have died and 25 of the cases have been reported.
The other confirmed deaths were in Virginia and Maryland.
The CDC said it had not yet determined the rate of infection among those patients who received the potentially tainted steroid. The rate of infection is an important barometer of the potential for the outbreak to spread.
The steroid is administered to patients, usually by injection, primarily to control back pain.
All the cases have so far been traced to three lots of Methylprednisolene Acetate from a pharmaceutical compounding plant in Massachusetts, according to the briefing.
The company, New England Compounding Center Inc, or NECC, in Framingham, Massachusetts, prepared the medication, which has been voluntarily recalled. The company has also voluntarily surrendered its license. NECC could not immediately be reached for comment.
“We are encouraging all health facilities to immediately cease use of any product produced by NECC,” Dr. Madeleine Biondolillo, Massachusetts public health director of safety, told reporters in a conference call from Boston.
NECC could not immediately be reached for comment.
A fungus linked to the steroid medication has been identified in specimens from five patients, according to the CDC’s Dr. Benjamin Park.
The Massachusetts Health Department said there were 17,676 vials of medication in each of the three lots under investigation. They were sent out July through September and have a shelf life of 180 days.
The CDC said the fungal contamination was detected in the examination of one of the sealed vials taken at that company.
Fungal meningitis is rare and life-threatening, but is not contagious from person to person. Meningitis can be passed to humans from steroid medications that weaken the immune system. Symptoms include a sudden onset of fever, headache, stiff neck, nausea, and vomiting, according to the CDC web site.
In addition to the 25 cases in Tennessee, one has been reported in North Carolina, two in Florida, four in Virginia, two in Maryland and one in Indiana, according to CDC’s Park.
SOME TENNESSEE PATIENTS ‘REALLY CRITICALLY ILL’
About 75 facilities could have received the steroid in the 23 states. They include California, Connecticut, Florida, Georgia, Idaho, Illinois, Indiana, Maryland, Michigan, Minnesota, North Carolina, New Hampshire, New Jersey, Nevada, New York, Ohio, Pennsylvania, Rhode Island, South Carolina, Tennessee, Virginia, Texas and West Virginia, according to Park.
In one example of how widespread the steroid was distributed, one facility in Indiana, St. Mary’s Health, said on Thursday that 560 patients had received the recalled medication. They received the steroid at the Surgicare Cross Pointe clinic in Evansville, said St. Mary’s spokeswoman Laura Forbes. It was not immediately known if any patients were infected there.
In Tennessee, the worst-hit state, Dr. John Dreyzehner, the state health commissioner, said expectations were that the number of cases would rise. “We are awaiting results of tests from other cases,” he told a news conference in Nashville.
Some Tennessee patients are “really critically ill” and in intensive care units, said Dr. Marion Kainer of the state health department. She declined to say how many were critical.
The Massachusetts Health Department said there had been several complaints against the company linked to the steroid. Complaints in 2002 and 2003 about the processing of medication resulted in an agreement with government agencies in 2006 to correct deficiencies
In 2011, there was another inspection of the facility and no deficiencies were found. In March 2012, another complaint was made about the potency of a product used in eye surgery procedures. That investigation is continuing, the state health department said.
(Additional reporting by Mary Wisniewski and Susan Guyett; Writing by Greg McCune; Editing by Cynthia Johnston and Peter Cooney)
Experts believe the next deadly human pandemic will almost certainly be a virus that spills over from wildlife to humans. The reasons why have a lot to do with the frenetic pace with which we are destroying wild places and disrupting ecosystems.
by david quammen
Emerging diseases are in the news again. Scary viruses are making themselves noticed and felt. There’s been a lot of that during the past several months — West Nile fever kills 17 people in the Dallas area, three tourists succumb to hantavirus after visiting Yosemite National Park, an Ebola outbreak in the Democratic Republic of the Congo claims 33 lives. A separate Ebola outbreak, across the border in Uganda, registers a death toll of 17. A peculiar new coronavirus, related to SARS, proves fatal for a Saudi man and puts a Qatari into critical condition, while disease scientists all over the world wonder: Is this one — or is that one — going to turn into the Next Big One?
By the Next Big One, I mean a murderous pandemic that sweeps around the planet, killing millions of people, as the so-called “Spanish” influenza did in 1918-19, as AIDS has been doing in slower motion, and as SARS might have done in 2003 if it hadn’t been stopped by fast science, rigorous
Carl De Souza/AFP/Getty Images
An official from the Scottish Agricultural College holds a dead swan to be tested for avian flu.
measures of public health, and luck. Experts I’ve interviewed over the past six years generally agree that such a Next Big One is not only possible but probable. They agree that it will almost certainly be a zoonotic disease — one that emerges from wildlife — and that the causal agent will most likely be a virus. They agree that sheer human abundance, density, and interconnectedness make us highly vulnerable. Our population now stands above seven billion, after all, a vast multitude of potential victims, many of us living at close quarters in big cities, traveling quickly and often from place to place, sharing infections with one another; and there are dangerous new viruses lately emerging against which we haven’t been immunized. Another major pandemic seems as logically inevitable as the prospect that a very dry, very thick forest will eventually burn.
That raises serious issues in the realm of health policy, preparedness, and medical response. It also suggests a few urgent questions on the scientific side — we might even say, the conservation side — of the discussion. Those questions, in simplest form, are: Where? How? and Why? Addressing them is crucial to understanding the dynamics of emerging diseases, and understanding is crucial to preparedness and response.
First question: From where will the Next Big One emerge? Answer, as I’ve noted: Most likely from wildlife. It will be a zoonosis — an animal infection that spills over into humans.
Everything comes from somewhere. New human diseases don’t arrive from Mars. Notwithstanding the vivid anxieties of The Andromeda Strain (1969) and other such fictions, lethal microbes don’t arrive on contaminated satellites returning from deep space. (Or anyway, knock wood, they haven’t so far.) They emerge from nonhuman animals, earthly ones, and spill over into human populations, catching hold, replicating, sometimes adapting and prospering, then passing onward from human to human.
According to one study, 58 percent of all pathogen species infecting humans are zoonotic. Another study found that 72 percent of all recently emerged zoonotic pathogens have come from wildlife. That list includes
According to one study, 72 percent of all recently emerged zoonotic pathogens have come from wildlife.
everything from Ebola and Marburg and the HIVs and the influenzas to West Nile virus, monkeypox, and the SARS bug.
In Malaysia, a virus called Nipah spilled over from fruit bats in 1998. Its route into humans was indirect but efficient: The bats fed in fruit trees overshadowing factory-scale pigsties; the bat droppings carried virus, which infected many pigs; the virus replicated abundantly in the pigs, and from them infected piggery workers and employees at abattoirs. That outbreak killed 109 people and ended with the culling of 1.1 million pigs.
Second question: How do such pathogens get into humans? The particulars are various but the general answer is: contact. Contact equals opportunity, and the successful pathogens are those that seize opportunities to proliferate and to spread, not just from one host to another but from one kind of host to another.
Wild aquatic birds defecate in a village duck pond, passing a new strain of influenza to domestic ducks; the ducks pass it to a Chinese boy charged with their care, after which the boy passes it to his brother and sister. A man in Cameroon butchers a chimpanzee and, elbow deep in its blood, acquires a simian virus that becomes HIV-1. A miner in Uganda enters a shaft filled with bats carrying Marburg virus and, somehow, by ingesting or breathing bat wastes, gets infected. Contact between people and wildlife, sometime direct, sometimes with livestock as intermediaries, presents opportunities for their infections to become ours.
Third question: Whydo such spillovers seem to be happening now more than ever? There’s been a steady drumbeat of new zoonotic viruses
We are interacting with wild animals and disrupting the ecosystems they inhabit to an unprecedented degree.
emerging into the human population within recent decades: Machupo (1961), Marburg (1967), Lassa (1969), Ebola (1976), HIV-1 (inferred in 1981, first isolated in 1983), HIV-2 (1986), Sin Nombre (the first-recognized American hantavirus, 1993), Hendra (1994), the strain of influenza called “avian flu” (1997), Nipah (1998), West Nile (1999), SARS (2003), and others. These are not independent events. They are parts of a pattern. They reflect things that we’re doing, not just things that are happening to us.
What we’re doing is interacting with wild animals and disrupting the ecosystems that they inhabit — all to an unprecedented degree. Of course, humans have always killed wildlife and disrupted ecosystems, clearing and fragmenting forests, converting habitat into cropland and settlement, adding livestock to the landscape, driving native species toward extinction, introducing exotics. But now that there are seven billion of us on the planet, with greater tools, greater hungers, greater mobility, we’re pressing into the wild places like never before, and one of the things that we’re finding there is… new infections. And once we’ve acquired a new infection, the chance of spreading it globally is also greater than ever.
We cut our way through the Congo. We cut our way through the Amazon. We cut our way through Borneo and Madagascar and northeastern Australia. We shake the trees, figuratively and literally, and things fall out. We kill and butcher and eat many of the wild animals found there. We settle in those places, creating villages, work camps, towns, extractive
Evolution seizes opportunity, explores possibilities, and helps convert spillovers to pandemics.
industries, new cities. We bring in our domesticated animals, replacing the wild herbivores with livestock. We multiply our livestock as we’ve multiplied ourselves, operating huge factory-scale operations such as the piggeries in Malaysia, into which Nipah virus fell from the bats feeding in fruit trees planted nearby, after the bats’ native forest habitats had been destroyed. We export and import livestock across great distances and at high speeds. We export and import other live animals, especially primates, for medical research. We export and import animal skins, exotic pets, contraband bushmeat, and plants, some of which carry secret microbial passengers.
We travel, moving between cities and continents even more quickly than our transported livestock. We eat in restaurants where the cook may have butchered a porcupine before working on our scallops. We visit monkey temples in Asia, live markets in India, picturesque villages in South America, dusty archeological sites in New Mexico, dairy towns in the Netherlands, bat caves in East Africa, racetracks in Australia — breathing the air, feeding the animals, touching things, shaking hands with the friendly locals — and then we jump on our planes and fly home. We get bit by mosquitoes and ticks. We alter the global climate with our carbon emissions, which may in turn alter the latitudinal ranges within which those mosquitoes and ticks live. We provide an irresistible opportunity for enterprising microbes by the ubiquity and abundance of our human bodies.
For decades, deadly outbreaks of cholera were attributed to the spread of disease through poor sanitation. But recent research demonstrates how closely cholera is tied to environmental and hydrological factors and to weather patterns — all of which may lead to more frequent cholera outbreaks as the world warms.
Everything I’ve just mentioned is encompassed within this rubric: the ecology and evolutionary biology of zoonotic diseases. Ecological circumstance provides opportunity for spillover. Evolution seizes opportunity, explores possibilities, and helps convert spillovers to pandemics. But the majesty of the sheer biological phenomena involved is no consolation for the human miseries, the deaths, and the current level of risk.
There are things that can be done — research, vigilance, anticipation, fast and effective response — to stave off or at least mitigate the Next Big One. My point here is different. My point is about human ecology, not human medicine. It behooves us to remember that we too are animals, interconnected with the rest of earthly biota by shared diseases, among other ways. We should recall that salubriuous biblical warning from the Book of Proverbs: “He that troubleth his own house shall inherit the wind.” The planet is our home, but not ours only, and we’d be wise to tread a little more lightly within this wonderful, germy world.
NEW: The pharmacy that manufactured the steroid recalls all its other products
The number of cases grows to 64 people in 9 states
It is linked to contaminated steroid injections
The steroid is used to treat pain and inflammation
Atlanta (CNN) — The death toll from an outbreak of fungal meningitis linked to contaminated steroid injections has risen to seven, the Centers for Disease Control and Prevention said Saturday.
The total number of cases has also grown to 64 people in nine states, the CDC said. That is 17 more cases and two more states than the day before.
Patients contracted the deadly meningitis after being injected in their spine with a preservative-free steroid called methylprednisolone acetate that was contaminated by a fungus. The steroid is used to treat pain and inflammation.
The New England Compounding Center, the Massachusetts-based pharmacy that made the contaminated injections, voluntarily recalled three lots of the injected steroid last week.
On Saturday, the same pharmacy announced a voluntary nationwide recall of all its other products as well. NECC said the new recall was being announced out of an abundance of caution and that there is no indication any of its other products are contaminated.
The Food and Drug Administration has already asked doctors, clinics, and consumers to stop using any of the pharmacy’s products. The pharmacy on Wednesday voluntarily surrendered its license to operate until the FDA investigation into the contamination is complete.
The CDC raised the death toll Saturday after two people died in Michigan. Other deaths have been reported in Maryland, Tennessee, and Virginia.
Tennessee is reporting the most number of overall cases — 29 — which includes three deaths, according to the CDC.
There are also confirmed cases in Florida, Indiana, Minnesota, North Carolina and Ohio.
The other states that received the contaminated products from NECC are California, Connecticut, Georgia, Idaho, Illinois, New Hampshire, New Jersey, Nevada, New York, Pennsylvania, Rhode Island, South Carolina, Texas and West Virginia.
Federal health inspectors began inspecting the NECC plant last Monday. Inspectors found foreign particles in unopened vials, and after testing one of the unopened vials, they determined the substance was a fungus.
The investigation is still under way.
Nearly 10% of drugs administered in the United States come from compound pharmacies, according to a 2003 Government Accountability Office report.
Drugs manufactured by compound pharmacies do not have to go through FDA-mandated pre-market approval. Instead, oversight and licensing of these pharmacies comes from state health pharmacy boards.
Compound pharmacists create customized medication solutions for patients for whom manufactured pharmaceuticals won’t work, according to the International Academy of Compounding Pharmacists.
Meningitis is an inflammation of the protective membranes covering the brain and spinal cord. It is usually caused by an infection, frequently with bacteria or a virus, but it can also be caused by less common pathogens like fungi, according to the CDC.
Fungal meningitis is very rare and, unlike viral and bacterial meningitis, it is not contagious.
Symptoms of fungal meningitis are similar to symptoms from other forms of meningitis, but they often appear more gradually and can be very mild at first, the CDC says.
Dr. William Schaffner, chairman of the Department of Preventive Medicine at Vanderbilt University Medical Center, told CNN that fungal infections are not usually mild. He said when a fungus invades small blood vessels, it can cause them to clot or bleed, which can lead to symptoms of small strokes.
In addition to typical meningitis symptoms like headache, fever, nausea and stiffness of the neck, people with fungal meningitis may also experience confusion, dizziness and discomfort from bright lights. Patients might just have one or two of these symptoms, the CDC says.
Health officials say any patients who received an injection at one of the facilities beginning July 1 and who began showing symptoms between one and three weeks after being injected should see their doctor right away.
The earlier a patient gets treatment, the more likely he or she will survive.
Patients are treated with anti-fungal medication, which is given intravenously so patients have to be admitted to the hospital, the CDC said. Patients may need to be treated for months.
The FDA is urging anyone who has experienced problems following an injection with the NECC product to report it to MedWatch, the FDA’s voluntary reporting program, by phone at 1-800-FDA-1088 or online at http://www.fda.gov/medwatch/report.htm.
The vector-borne disease of chicken pox has been spreading among the inmates of a government-run residential school in Kandhamal district. At least 19 inmates, aged 6 to 12 years, in the residential school at Daberi in Daringibadi block, have been infected with the disease. There are 131 inmates in the hostel at present. “The situation is under control and there is no cause to panic,” a senior medical officer said, however. District malaria officer (DMO) J N Patnaik visited the hostel along with a team of doctors on Sunday. “The infected children were segregated in a room to prevent the spread of the disease. They are being administered the required medication,” the DMO said. He said the condition of the other students, who have already left the hostel after being infected, was not known. “We are trying to bring them to the hostel for treatment. If their parents do not agree, the medical staff will go to their respective places to provide treatment,” Patnaik said. The outbreak of chicken pox was first reported in the hostel on September 29, sources said. The disease spread gradually. “It’s a viral disease which spreads through the air and after contact with the affected persons. We have advised the school authorities not to allow the affected students to venture outside the hostel,” the DFO said.
Biohazard name:
Chicken pox
Biohazard level:
2/4 Medium
Biohazard desc.:
Bacteria and viruses that cause only mild disease to humans, or are difficult to contract via aerosol in a lab setting, such as hepatitis A, B, and C, influenza A, Lyme disease, salmonella, mumps, measles, scrapie, dengue fever, and HIV. “Routine diagnostic work with clinical specimens can be done safely at Biosafety Level 2, using Biosafety Level 2 practices and procedures. Research work (including co-cultivation, virus replication studies, or manipulations involving concentrated virus) can be done in a BSL-2 (P2) facility, using BSL-3 practices and procedures. Virus production activities, including virus concentrations, require a BSL-3 (P3) facility and use of BSL-3 practices and procedures”, see Recommended Biosafety Levels for Infectious Agents.
This September, sea ice covering the Arctic Ocean fell to the lowest extent in the satellite record, which began in 1979. Satellite data analyzed by NSIDC scientists showed that the sea ice cover reached its lowest extent on September 16. Sea ice extent averaged for the month of September was also the lowest in the satellite record.
The near-record ice melt occurred without the unusual weather conditions that contributed to the extreme melt of 2007. In 2007, winds and weather patterns helped melt large expanses of ice. “Atmospheric and oceanic conditions were not as conducive to ice loss this year, but the melt still reached a new record low,” said NSIDC scientist Walt Meier. “This probably reflects loss of multi-year ice in the Arctic, as well as other factors that are making the ice more vulnerable.” Multi-year ice is ice that has survived more than one melt season and is thicker than first-year ice.
NSIDC Director Mark Serreze said, “It looks like the spring ice cover is so thin now that large areas melt out in summer, even without persistent extreme weather patterns.” A storm that tracked through the Arctic in August helped break up the weakened ice pack.
Arctic sea ice extent reached its lowest point this year on September 16, 2012 when sea ice extent dropped to 3.41 million square kilometers (1.32 million square miles). Averaged over the month of September, ice extent was 3.61 million square kilometers (1.39 million square miles). This places 2012 as the lowest ice extent both for the daily minimum extent and the monthly average. Ice extent was 3.29 million square kilometers (1.27 million square miles) below the 1979 to 2000 average.
The Arctic ice cap grows each winter as the sun sets for several months and shrinks each summer as the sun rises higher in the northern sky. Each year the Arctic sea ice reaches its annual minimum extent in September. It hit its previous record low in 2007. This summer’s low ice extent continued the downward trend seen over the last 33 years. Scientists attribute this trend in large part to warming temperatures caused by climate change. Since 1979, September Arctic sea ice extent has declined by 13 percent per decade. Summer sea ice extent is important because, among other things, it reflects sunlight, keeping the Arctic region cool and moderating global climate.
In addition to the decline in sea ice extent, a two-dimensional measure of the ice cover, the ice cover has grown thinner and less resistant to summer melt. Recent data on the age of sea ice, which scientists use to estimate the thickness of the ice cover, shows that the youngest, thinnest ice, which has survived only one or two melt seasons, now makes up the large majority of the ice cover.
Climate models have suggested that the Arctic could lose almost all of its summer ice cover by 2100, but in recent years, ice extent has declined faster than the models predicted. Serreze said, “The big summer ice loss in 2011 set us up for another big melt year in 2012. We may be looking at an Arctic Ocean essentially free of summer ice only a few decades from now.” NSIDC scientist Julienne Stroeve recently spent three weeks in the Arctic Ocean on an icebreaker ship, and was surprised by how thin the ice was and how much open water existed between the individual ice floes. “According to the satellite data, I expected to be in nearly 90% ice cover, but instead the ice concentrations were typically below 50%,” she said.
As the Arctic was experiencing a record low minimum extent, the Antarctic sea ice was reaching record high levels, culminating in a Southern Hemisphere winter maximum extent of 19.44 million square kilometers (7.51 million square miles) on September 26. The September 2012 monthly average was also a record high, at 19.39 million square kilometers (7.49 million square miles) slightly higher than the previous record in 2006. Temperatures over Antarctica were near average this austral winter. Scientists largely attribute the increase in Antarctic sea ice extent to stronger circumpolar winds, which blow the sea ice outward, increasing extent.
NSIDC scientist Ted Scambos said, “Antarctica’s changes — in winter, in the sea ice — are due more to wind than to warmth, because the warming does not take much of the sea ice area above the freezing point during winter. Instead, the winds that blow around the continent, the “westerlies,” have gotten stronger in response to a stubbornly cold continent, and the warming ocean and land to the north.”
MessageToEagle.com – The intensity of two such high-pressure systems, present over the northern Pacific and Atlantic oceans during the summer, has changed in recent years.
Scientists do not know whether these changes are related to climate warming.
Conducted simulations from the Intergovernmental Panel on Climate Change Fourth Assessment Report suggest that these summertime highs are likely to intensify in the twenty-first century as a result of an increase in atmospheric greenhouse-gas concentrations, according to a Duke University-led study published online this week in Nature Geoscience.
Click on image to enlargeSouth Indian Ocean, Oval-shaped Hole in a Blanket of Marine Stratocumulus Clouds photographed off Australia on June 5, 2012. High-pressure weather systems often bring fair weather and relatively clear skies. In early June 2012, a high off the coast of Tasmania did just that…and in spectacular fashion. The Moderate Resolution Imaging Spectroradiometer (MODIS) on NASA’s Aqua satellite acquired this view of a hole in a cloud formation at 3:00 p.m. local time (05:00 Universal Time) on June 5, 2012.
The weather system over the Great Australian Bight cut out the oval-shaped hole from a blanket of marine stratocumulus clouds. The cloud hole, with a diameter that stretched as far as 1,000 kilometers (620 miles) across, was caused by sinking air associated with an area of high pressure near the surface. Credits: NASA
High-pressure systems over oceans that largely determine the tracks of tropical cyclones and hydrological extremes will posssibly play an increasingly important role regarding drought and extreme summer rainfall.
The black lines of all the historical tropical storm and hurricane paths curving around that subtropical ridge. If that ridge extends far to the west, tropical storms or hurricanes south of it can in turn be forced far to the west. Credits: http://www.weather.com
Changes in the dominant heating component between the twenty-first- and twentieth-century run. p>Blue, red and green colours denote long-wave radiative cooling, sensible heating and condensational heating, respectively, obtained from the CMIP3 multi-model ensemble mean. Credits: Duke University
A team of scientists led by Wenhong Li, assistant professor of earth and ocean sciences at Duke’s Nicholas School of the Environment, conducted a series of simulations predicting future changes in the strength of the annually occurring North Atlantic Subtropical High “subtropical ridge” (also known as the Bermuda High), and the North Pacific Subtropical High.
Based on their results, these changes will intensify over the 21st century as a result of increasing greenhouse-gas concentrations and – the difference between ocean and land heating, as Earth’s climate warms – will fuel the systems’ intensification.
MessageToEagle.com – Scientists from Fukuoka Institute of Technology, Japan developed a small artificial satellite named FITSAT-1. It also has the nickname “NIWAKA”.
The shape is a 10cm cube, and the weight is 1.33kg.
The main mission of this satellite is to demonstrate the high speed transmitter developed. It can send a jpeg VGA-picture(480×640) within 6 sec.
NIWAKA, which is now in a regular orbit, was launched from the International Space Station 390 kilometres (242 miles) above Earth at 15:44 on 4th October 2012 (UTC).
NIWAKA will write messages in the night sky with Morse code as:
Click on image to enlargeA Morse code in the night sky – transmitted by a palm sized satellite, NIWAKA designed by scientists from Fukuoka Institute of Technology. Credits: Fukuoka Institute of Technology, Japan
NIWAKA will test the possibility of optical communication by satellite. It will actually twinkle as an artificial star.
The minisatellite’s high power LEDs, which is driven with more than 200W pulses to produce extremely bright flashes, will be observable by the unaided eye or with small binoculars.
Click on image to enlargeThe beacon signal is a standard Morse code CW signal. The signal starts with “HI DE NIWAKA …” and telemetry data follows. Credits: Fukuoka Institute of Technology
The LEDs will also be driven in detecting faint light mode. The light will received by a photo-multiplier equipped telescope linked to the 5.8 GHz parabolic antenna.
Duty 30%, 10Hz signal is modulated with also duty 30%, 5kHz signal. So the average input power will be 220W x 0.3 x 0.3 = 20W. In order to detect the faint light, a high gain amplifier with 5kHz filter may be useful.
While, the Morse code is modulated with duty 15%, 1kHz signal. So, the signal can directly drive a speaker with AF-amplifier to hear Morse sound.
Click on image to enlargeFlight Model – Credits: Fukuoka Institute of Technology
The NIWAKA body is made by cutting a section of 10cm square aluminum pipe. Both ends of the cut pipe are covered with aluminum plates. The surface of the body is finished with black anodic coating.
Click on image to enlargeBottom View of The Model – Credits: Fukuoka Institute of Technology
The CubeSat slide rails and side plates are not separate; they are made as a single unit. The thickness of the square pipe is 3mm, but the surfaces attached by solar cells are thinned to 1.5mm because of weight limit.
In order to make the 8.5mm square CubeSat rails, 5.5mm square aluminum sticks are attached to the four corners of the square pipe.
Click on image to enlargeCredits: Fukuoka Institute of Technology
The trajectory of the ISS is inclined 51.6 deg from the equator, so NIWAKA will travel between 51.6 degrees south latitude and 51.6 degrees north latitude.
NIWAKA minisatellite will carry a mounted neodymium magnet to force it to always point to magnetic north like a compass. When NIWAKA rises above the horizon, it will be to the south of the Fukuoka ground station, and both the 5.8 GHz antenna and the LEDs will be aimed accurately enough by the magnet aligning itself and the satellite with the earth’s magnetic field that the Fukuoka ground station will be within the main beams.
Click on image to enlargeScientists perform both 5.8 GHz high-speed and optical communication experiments for about 3 minutes as the satellite travels along the orbit shown as the red line in the figure. Credits: Fukuoka Institute of Technology
After Deployment from NASA pictures:
Click on image to enlargeCredits: Fukuoka Institute of Technology
Click on image to enlargeCredits: Fukuoka Institute of Technology
Click on image to enlargeProfessor Takushi Tanaka holding a palm sized satellite at his laboratory in Fukuoka. Credits: Fukuoka Institute of Technology
Scientists will perform both 5.8 GHz high-speed and optical communication experiments for about 3 minutes as the satellite travels along the orbit shown as the red line in the figure.
MessageToEagle.com – A new stellar-mass black hole has been discovered in our Milky Way galaxy by NASA’s Swift satellite.
The presence of a previously unknown black hole, was revealed by high-energy X-rays emanating from a source towards the center of our galaxy.
“Bright X-ray novae are so rare that they’re essentially once-a- mission events and this is the first one Swift has seen,” according to Neil Gehrels, the mission’s principal investigator at NASA’s Goddard Space Flight Center.
Click on image to enlargeCredit: NASA’s Goddard Space Flight Center
“This is really something we’ve been waiting for.”
An X-ray nova is a short-lived X-ray source that appears suddenly, reaches its emission peak in a few days and then fades out over a period of months. The outburst arises when a torrent of stored gas suddenly rushes toward one of the most compact objects known.
The nova – dubbed Swift J1745-26 – is located a few degrees from the center of our galaxy toward the constellation Sagittarius. While astronomers do not know its precise distance, they think the object resides about 20,000 to 30,000 light-years away in the galaxy’s inner region.
The nova peaked in X-rays — energies above 10,000 electron volts, or several thousand times that of visible light — on September 18, when it reached an intensity equivalent to that of the famous Crab Nebula, a supernova remnant that serves as a calibration target for high-energy observatories and is considered one of the brightest sources beyond the solar system at these energies.
Click on image to enlargeCredit: NASA’s Goddard Space Flight Center
As it dimmed at higher energies, the nova brightened in the lower-energy emissions detected by Swift’s X-ray Telescope.
“The pattern we’re seeing is observed in X-ray novae where the central object is a black hole,” said Boris Sbarufatti, an astrophysicist at Brera Observatory in Milan, who currently is working with other Swift team members at Pennsylvania State
“Once the X-rays fade away, we hope to measure its mass and confirm its black hole status.”
(Oct 4, 2012) Almost 8,500 deer across Michigan have died from EHD according to the Michigan Department of Natural Resources. EHD is a disease that causes deer to suffer a high fever and internal bleeding. The DNR says a small fly known as a midge bites the deer transferring the disease. Officials say nearly half of the deer that have died from EHD have been found in Ionia County. Just two days into bow hunting season and many are talking about the problem. Steve Hayes, a manager at Bob’s Gun and Tackle Shop in Barry County, says people are not putting away their bows just yet.”Our customers are concerned, they are also concerned sportsman too. They’re deciding if they are going to back off on the number of deer they are going to shoot this year, but what we are seeing so far is most people are still interested in going out and doing some deer hunting,” said Hayes. James Waller says the outbreak will cause him to cutback because he has a concern of wiping out too many prize game. Waller says he usually gets out around 15-20 times per season.”A lot of the big bucks, the DNA that is there, we are losing that gene of that deer. We’re trying to create a really good herd to raise some nice deer,” said Waller. “Something like this comes along and it wipes out a lot of work, time and effort.””We’re going to be carefully watching the situation to and watching how it affects business, so we can react to that going forward,” says Hayes. A frost is expected to hit as early as this weekend, leaving many hopeful it will put an end to the disease and see hunting season can return to normal. http://www.wlns.com/story/19724898/dnr-over-8000-deer-dead-in-michigan
(Zephaniah 1:2-3) “I will utterly consume all things from off the land, saith the Lord.I will consume man and beast; I will consume the fowls of the heaven, and the fishes of the sea, and the stumbling blocks with the wicked: and I will cut off man from off the land, saith the Lord.”
(Hosea 4:3) “Therefore shall the land mourn, and every one that dwelleth therein shall languish, with the beasts of the field, and with the fowls of heaven; yea, the fishes of the sea also shall be taken away.”
A small radioactive cylinder that went missing from a Halliburton (HAL) truck last month was found on a Texas road late Thursday, the company said, ending a weeks-long hunt for the device that involved local, state and federal authorities. The seven-inch stainless steel tube, which contained a small amount of radioactive material, was lost by an oil-and-gas crew somewhere along the 130-mile journey from the vicinity of Pecos to Odessa, in West Texas. A Halliburton spokesman said Friday that the device was found late Thursday on a road in Reeves County, Texas. The company first reported it missing to the state health department on Sept. 11, according to another report to the U.S. Nuclear Regulatory Commission. State officials, company inspectors and members of a Texas National Guard unit had combed the area for the device, which is used in the process of measuring and evaluating conditions within oil and gas wells. The Nuclear Regulatory Commission report stated that the tube was a “category 3” radioactive device, a class that includes some pacemakers.
Over 50 labourers fell ill on Sunday in an industrial area of Jalgaon city in Maharashtra owing to a chlorine gas leak from a factory, police said. “The workers belonged to a factory called Tulsi Pipes. They suffered from breathing problems and acute vomiting as one of the 25 chlorine cylinders stacked in the adjoining Kalpataru Agro-Chem Industries leaked,” an official from Jalgaon police station said. The manager of Kalpataru Agro-Chem told police that the cylinders were kept on the factory premises for being taken to another plant. He said that he did not know how the chlorine leaked from one of the cylinders, police said. “All victims have been sent to hospital. While 10 labourers are still under medical care, others have been discharged,” the official added. A complaint has been registered by one of the labourers, Mohammed Aslam Mehboob Ilahi, against owners of Kalpataru Agro-Chem under Indian Penal Code Sections 284 (negligent conduct with respect to poisonous substance), 336 (act endangering life or personal safety of other), 337 (causing hurt by act endangering life or personal safety of other) and 338 (causing grievous hurt by act endangering life or personal safety of other), the official said.
[In accordance with Title 17 U.S.C. Section 107, this material is distributed without profit, for research and/or educational purposes. This constitutes ‘FAIR USE’ of any such copyrighted material.]
On 22. September, a French-German team sets out from La Reunion to map the upwelling of hot magma that powers one of the oldest and most active regions of volcanic activity in the world. An expedition blog will keep interested landlubbers up to date.
Volcanic activity on and around La Reunion is driven by a localized upwelling of hot buoyant magma. Unlike most magma sources, this is not located on the boundary between two tectonic plates, and rises from much greater depths.
It is a so-called hotspot, and has left behind on the overlying mobile crust a track of volcanic activity that stretches 5500 km northwards to the Deccan Plateau in India. Some 65 million years ago, in a process that had a massive impact on world climate, the Deccan area was covered with enormous amounts of lava as the Indian Plate passed over the hotspot.
Such a long-lived upwelling of hot molten rock, which penetrates the overlying material like a blowtorch, is referred to as a mantle plume. Where exactly mantle plumes originate is the subject of a controversial debate among geoscientists.
During the course of a French-German expedition, LMU geophysicist Dr. Karin Sigloch, leader of the German contingent, wants to find out more about the putative plume under La Reunion. The goal is to determine the depth of the plume and to map the conduits by which the magma reaches the Earth’s surface.
The largest plume survey campaign ever “We want to look deeper into the Earth’s interior than any previous expedition, down to the bottom of the mantle at a depth of about 2900 km; earlier efforts reached half that depth, at most,” says Sigloch. To achieve this goal, the researchers must deploy a dense array of seismometers over a wide area.
On 22 September, the team will board the French research vessel Marion Dufresne on a cruise that will place nearly 60 seismometers on the seabed, dispersed over an area of some 4 million km2. As 30 additional instruments will be installed on land, this will be the largest such campaign ever undertaken. Data from a further 70 or so observatories located along the coasts of the Indian Ocean will complement the results obtained with the new network.
The data collected will be used to create three-dimensional tomographic images that will give us a picture of the Earth from the bottom of the crust to the core, and provide new insights into the structure, dynamics and history of the Earth.
As they effectively short-circuit the transport of heat from the core to the surface, plumes may play an important role in the Earth’s heat budget, and are a major force in shaping the Earth’s surface. Analysis of the new data will begin in a year’s time, after the German RV Meteor retrieves the newly deployed seismometers from the seabed.
In addition to the team from LMU, researchers from the Alfred Wegener Institute in Bremerhaven, the universities in Frankfurt and Munster, the University of La Reunion and the Institut de Physique du Globe in Paris (IPG Paris) are involved in the project.
August 2012 was the globe’s 4th warmest August on record, according to the National Oceanic and Atmospheric Administration’s National Climatic Data Center (NCDC).NASA rated August 2012 the 6th warmest on record. August 2012 global land temperatures were the 2nd warmest on record, and global ocean temperatures were the 5th warmest on record. August 2012 was the 330th consecutive month with global temperatures warmer than the 20th century average; the last time global temperatures were below average was February 1985. Global satellite-measured temperatures in August for the lowest 8 km of the atmosphere were 3rd warmest in the 34-year record, according to the University of Alabama Huntsville (UAH). Wunderground’s weather historian, Christopher C. Burt, has a comprehensive post on the notable weather events of August in his August 2012 Global Weather Extremes Summary.
Figure 1. Departure of temperature from average for August 2012. Most areas of the world experienced much higher-than-average monthly temperatures, including much of Canada, Southeast Europe, and Western Asia. Central Russia was much cooler than average. Image credit: National Climatic Data Center (NCDC) .
El Niño watch continues
Sea surface temperatures were at 0.5°C above average as of September 17 in the equatorial Pacific off the coast of South America, and have been near or above the 0.5°C above average–the threshold needed for a weak El Niño event–since the beginning of July. However, winds, pressures, and cloud cover over the region have not responded in the fashion typically associated with an El Niño, and NOAA’s Climate Prediction Center (CPC) classified conditions as being neutral in their September 6 El Niño discussion. They continued their El Niño watch, and gave a 69% chance that an El Niño event will be in place by the end of September. El Niño conditions tend to decrease Atlantic hurricane activity, by increasing wind shear over the tropical Atlantic. Wind shear has been close to average over the tropical Atlantic since the beginning of hurricane season in June. However, the past few runs of the GFS model have predicted a significant rise in wind shear over the Caribbean and tropical Atlantic by early October, which may represent El Niño finally beginning to kick in and affect the atmospheric circulation over the Atlantic.
Figure 2. Arctic sea ice extent as of September 18, 2012 (black line) compared to the previous record low years, in millions of square kilometers. This year’s extent is far below any previous year, and is close to its minimum for the year. Satellite measurements of ice extent began in 1979. Image credit: Danish Meteorological Institute.
Arctic sea ice falls to all-time record low during August
August 2012 Arctic sea ice extent reached its lowest August extent in the 35-year satellite record, according to the National Snow and Ice Data Center (NSIDC). The new sea ice record was set on August 26, a full three weeks before the usual end of the melting season. Every major scientific institution that tracks Arctic sea ice agrees that new records for low ice area, extent, and volume have been set (see the comprehensive collection of sea ice graphs here.) Satellite records of sea ice extent date back to 1979, though a 2011 study by Kinnard et al. shows that the Arctic hasn’t seen a melt like this for at least 1,450 years (see a more detailed article on this over at skepticalscience.com.) The latest September 18, 2012 extent of 3.5 million square kilometers is approximately a 50% reduction in the area of Arctic covered by sea ice, compared to the average from 1979 – 2000. The amount of open ocean exposed this September compared to September 1980 is about 43% of the size of the contiguous United States. The ice extent is close to its minimum for the year, and should start in increase within the next week or two, but that open water over the Arctic will provide a significant amount of heat and moisture to the atmosphere over the next few months that will significantly alter weather patterns. One possible impact may be an increase in the intensity and duration of extreme weather events during fall and winter.
24.09.2012
Extreme Weather
United Kingdom
Multiple region, [South west, northern England and Scotland]
Britain is bracing itself for a battering from gales and torrential rain – with forecasters predicting a month’s rainfall in one day. The Met Office and Environment Agency warned homeowners to be on standby as rivers threatened to burst their banks and motorists were advised to drive with caution. Fire crews across the south were also on alert as the wind and rain were predicted to get worse. Forecasters predict up to 80mm rainfall and 50mph winds over the next 36 hours, with pockets of the south west, northern England and Scotland particularly threatened by flooding. The Environment Agency has warned of significant travel disruption and flooding of properties over the next 24 hours. Paul Mott, senior meteorologist at MeteoGroup, warned: âThere is going to be a big change in the weather from what we have had recently. âThere is likely to be some localised flooding, and gusts of up to 60mph in parts of Scotland, which is enough to pull up the odd tree.â Parts of Britain have basked in warm temperatures in the mid-20s during September, a welcome break from the rain and wind that dogged much of July and August. But Environment Agency director of operations David Jordan said: âWe are expecting flooding across the country from this evening and in to Monday and Tuesday. âWe strongly urge people to sign up to flood warnings, keep a close eye on local weather forecasts and be prepared for the possibility of flooding.
…………………………
24.09.2012
Forest / Wild Fire
Spain
Autonomous Community of Valencia, [Chulilla, Gestalgar, Pedralba and Bugarra]
Around 2,000 people have had to be evacuated on Monday due to a wildfire that hit the Autonomous Community of Valencia in east Spain. The fire, which broke out around 50 kilometers north-west of the city of Valencia has sent villagers of Chulilla, Gestalgar, Pedralba and Bugarra to be evacuated because of the threat of the advancing flames. Over 600 people are currently combating the fire, among them firemen and members of Spain’s Emergency Military Unit (UME), with the help of a total of 31 planes and helicopters. However, fire-fighting has been made more difficult by strong gusts of wind in the region, while the smoke and dust has led to eight small roads being closed to the public. Authorities are optimistic that the arrival of cooler weather from the north-west will see a fall in temperatures and a reduction in wind-speeds, while there is also the possibility of some rain falling in the afternoon.
Firefighters battled a forest fire whipped up by strong winds in the Spanish region of Valencia on Monday, forcing the evacuation of about 2,000 people, officials said.
The blaze broke out Sunday afternoon and spread quickly, threatening villages about 50 kilometres (30 miles) inland of the eastern city Valencia, which lies on the Mediterranean coast.
About 2,000 people have been evacuated from villages in the area since it broke out Sunday afternoon and several roads were cut off, Valencia officials said.
Some 500 firefighters on the ground, backed by 27 aircraft, were attempting to get the fire under control, they said.
“We are trying to protect areas of housing,” said senior Valencia region government policymaker Serafin Castellano.
“Right now our biggest enemy is the weather, a lot of wind,” he told COPE radio.
Dramatic images in the Spanish media showed flames lighting up the night sky and illuminating clouds of smoke that billowed along hillsides just behind houses.
Enrique Silvestre, mayor of one of the evacuated villages, Chulilla, said the situation was “very difficult”.
“The wind is not helping at all and the night was terrible,” the mayor told Cadena SER radio.
Spain is at particularly high risk of fires this summer after suffering its driest winter in 70 years.
Flames destroyed more than 184,000 hectares (454,000 acres) of land between January 1 and September 16, the largest amount in a decade, according to agriculture ministry figures.
Forest fires devastating Ecuador have left five people dead and 73 injured, consuming more than 17,600 hectares of woodland and crops.
The five deaths, including one of the firefighters, occurred in the provinces of Azuay, Bolivar, Chimborazo, Cotopaxi and Tungurahua, while most of the 73 injured were in Chimborazo and Pichincha.
In all there have been 3069 forest fires since June 1, when a period of drought set in.
The fires have wiped out 17,484ha of woods and scrubland high in the Andes as well as 142ha of crops, while another 31ha of crops were affected but not completely destroyed.
A Hercules C-130 aircraft of the Brazilian air force with a team of 29 soldiers and capable of carrying 12,000 litres of water has arrived in Quito to help extinguish the flames.
Meanwhile, the Ecuadorian armed forces have deployed 21 aircraft, both helicopters and planes, as well as 5693 soldiers, trucks and other equipment.
The province with the most blazes is Pichincha in the Andes region.
Hurricane Miriam, churning far off the Mexican coast in the Pacific Ocean, strengthened to a Category 2 storm early Monday, US forecasters said.
The storm located 415 miles (665 kilometers) south southwest of the southern tip of Baja California, now displayed sustained winds of 105 miles (165 kilometers) an hour, the US National Hurricane Center said.
The center said Miriam was likely to strengthen further “during the next day or so” and possibly even become a major hurricane.
But it is then expected to move further north and lose strength once it encounters cold water and winds.
Strengthening of Typhoon Jelawat Monday has boosted the mighty storm’s status to “Super-typhoon.”
The powerful and extremely dangerous storm has continued to be of great interest to residents of northern Philippines and Taiwan. Those land masses could eventually feel directs effects of Jelawat, depending upon the path it takes.
Jelawat was not yet a “super-typhoon” at the time (about 0600 UTC Monday) of this impressive visible satellite shot, showing the tight, small eye of a well-wrapped tropical cyclone. Southern Philippines is at the lower left. (Joint Typhoon Warning Center)
By 1200 UTC, Monday, top sustained winds about the tightly wrapped storm were reckoned to be 130 knots, or 150 mph, the Joint Typhoon Warning Center (JTWC) said.
The JTWC define “super-typhoon” as a typhoon having highest 1-minute surface winds of at least 65 m/s (130 knots, 150 mph).
Late Monday morning, Eastern Time, the eye of Jelawat was located about 435 miles east of Manila, Philippines. Storm movement was towards the north-northwest at 5 mph, according to the JTWC.
The storm’s dangerous winds and heaviest rains were well east of the Philippines. However, interaction of the storm with the monsoon flow was triggering locally excessive rains in southeastern Philippines.
As it drifts towards the north and west, Jelawat will pose little or no direct threat to land before at least Wednesday, although it will continue to be a very powerful and dangerous storm.
However, beginning Wednesday, the exact path taken by the storm would be critical for both the Philippines and Taiwan.
Although the JTWC have forecast a track east of any land through at least Friday, when a position east of Taiwan is expected, some numerical forecast models have shown a more westerly track, passing over or near the northern mainland of the Philippines. Likewise, the more westerly scenarios could imply a late-week threat to Taiwan.
Elsewhere, Jelawat was joined as of Monday by a second tropical cyclone, the much weaker Tropical Storm Ewiniar.
Ewiniar was only a minimal tropical storm as of late morning, Eastern Time, having a center about 1,000 miles south of Tokyo, Japan.
Ewinar was forecast to strengthen by midweek, but without posing any threat to mainland Japan or any other sizable land mass.
GUWAHATI, India: Floods have forced nearly 1.5 million people to flee their homes in north-eastern India where authorities have declared a health alert, officials said on Monday. “Eighteen of 27 districts of Assam have been hit by floods with 1.4 million displaced and 11 people drowned in separated incidents in the past week,” the Disaster Management agency said in a statement.
The floods, caused by relentless rains, marked the second round of massive flooding in two months to hit India’s impoverished northeast and come towards the end of India’s June-to-September monsoon season. Nearly 130 people died and six million were displaced by floods in Assam state in July. Rescue officials said in the latest floods, at least 2,200 villages had been swamped by overflowing waters from the rain-swollen Brahmaputra River. Himanta Biswa Sarmah, the health minister of Assam state, told AFP that a “maximum health alert” to avert outbreaks of diarrhea or diseases such as typhoid had been declared in the devastated zone. The annual monsoon provides vital irrigation for India’s farmers but also claims many casualties from flooding and landslides.
Officials said flooding victims had been evacuated to temporary shelters on higher ground. “We’ve dispatched doctors and paramedics to ensure there is no outbreak of disease,” Sarmah said in Guwahati, Assam’s largest city. Victims and an opposition party staged protests in flood-hit areas against what they said were shortages of emergency supplies in the Congress-ruled state. “The government has failed to provide adequate relief supplies including food and medicines,” said Sarbananda Sonowal, a local leader of India’s main opposition Bharatiya Janata Party. “In many parts of the state people are even living without food,” he added. Rehab India Foundation, a voluntary group said heavy rains disrupted its plans to supply food and other essential items to flood-hit people.
Almost the entire 420 square kilometres (162 square miles) of Kaziranga National Park was also flooded, the Press Trust of India reported. The wildlife park is home to the world’s single largest population of one-horned rhinos. A 2012 census in Kaziranga counted 2,290 of the rhinos, out of a global population of 3,300. The species declined to near extinction in the early 1990s and is listed as “vulnerable” by the International Union for Conservation of Nature.
Floodwaters are on the rise in Alaska’s Kenai Peninsula, but they’re falling in the tourist town of Talkeetna. The Kenai River near Cooper Landing still hadn’t crested and there were reports of minor flooding, mainly areas close to the shoreline, National Weather Service forecaster Christian Cassell said late Saturday night. A flood warning is in effect until 10 p.m. Monday for the area and Cassell said moderate flooding is likely. “Cooper Landing homeowners are preparing for possible evacuation as Kenai Lake and the upper Kenai River banks are expected to reach broad crest Monday,” Kenai Peninsula Borough emergency officials said in a statement. Meanwhile, nearly 200 miles north, floodwaters receded Saturday from much of Talkeetna. That allowed residents to begin cleaning up the muddy mess left when the river flooded. But officials warned that the danger hadn’t passed and advised that people boil their water. Cassell said water levels have come down dramatically after rivers and streams draining from the Talkeetna Mountains crested. Meteorologists say they don’t expect rainfall to significantly increase river levels there, but a flood warning remained in effect for the area as many waterways remained above flood stage. The Talkeetna River crested at 15.65 feet on Friday, just below the level considered major flooding. It had receded to 12.5 feet by Saturday afternoon, just above the 12-foot flood mark. Only two streets in Talkeetna remained flooded, the Anchorage Daily News reported. Talkeetna is the last stop for climbers heading to Mount McKinley, North America’s tallest mountain. It also has an eclectic population, and h
At least 120 houses were damaged in Barangay Bagong Silangan, Quezon City, after a tornado tore through the community around 5:30 p.m. on Sunday. Barangay chairperson Crisell Beltran said the tornado blew off the roofs of houses and uprooted several trees and electric posts, causing a power outage in the area. According to residents, the tornado hit the communities of Area 5 and Lingayen in Sitio Veterans, Panther Street in Sitio Veterans 4 and a house in Spring Country. Fortunately, no one was reported killed or hurt when it struck. Beltran, meanwhile, asked the city government to provide assistance to affected residents, particularly those who need to repair their damaged houses. Most of the houses in the area which is situated near a small creek were made of light materials.
Huddled in their sleeping bags, the climbers first heard the avalanche roar towards them and then the sound of screaming before being swept hundreds of metres down the slopes of “Killer Mountain”.
Survivors of the weekend tragedy on Nepal’s Manaslu mountain, which killed at least nine people, said the scene resembled a war zone, with an entire camp destroyed by the wall of snow.
“We were sleeping in our tent after having dinner, when all of a sudden we heard the noise of other climbers screaming. Within moments, we were hit by the avalanche,” said Andreas Reiter, one of the trek’s survivors.
Reiter was among a group of European adventurers who were near the peak of the 8,156-metre (26,759-foot) Manaslu when the avalanche struck. They were asleep. It was 4:00 am on Sunday.
“I witnessed one of the team members die,” the 26-year-old German, who has broken his back, was quoted as telling The Himalayan Times as he recovered in hospital in Kathmandu.
Rescuers scaled down the search Monday for two French climbers and a Canadian still missing on Manaslu, the world’s eighth-highest peak and one of the most challenging.
Pravin Nepal, an orthopaedic surgeon at Norvic Hospital in Kathmandu, told AFP Reiter’s spinal cord was broken.
“He is undergoing an MRI test. He can speak and move his hands and legs.”
Another German being treated at the hospital was being treated for frostbite, the medic said.
Also among the survivors was Glen Plake, 48, a three-time freestyle skiing world champion from California. He described the site of the avalanche as “a war zone”.
“It was a major, major accident… There were 25 tents at camp three and all of them were destroyed,” he told the Epic TV video subscription service.
“Twelve tents at camp two were banged up and moved around.”
Plake told the company’s blog he was reading when he and a companion with whom he was sharing his tent heard a roar.
“Greg looked at me and said ‘that was a big gust of wind’, then a second later, ‘No, that was an avalanche’.
“Then it hit us. I was swept 300 metres over a serac and down the mountain and came to a stop still in my sleeping bag, still inside the tent, still with my headlamp on.”
Christian Trommsdorff, of France’s national union of mountain guides, said the avalanche happened at about 7,400 metres and carried away part of camp number three at 6,800 metres.
Expedition leader Garrett Madison said he and his team were sleeping at camp two, further down the mountain, when they were awoken by “snow, wind and ice penetrating our tents”.
“Fortunately everybody in our group was okay. However when we climbed up to camp three shortly after to investigate we discovered the debris from a massive avalanche and found many climbers in distress,” Madison wrote on the Alpine Ascents blog.
“During the rescue and recovery in the following hours we were able to coordinate and assist evacuating over a dozen climbers on 10 helicopter flights from just below camp three.”
Manaslu is nicknamed “Killer Mountain” by locals because a series of snowslides have claimed the lives of scores of mountaineers since it was first conquered in 1956.
The latest deaths mean at least 62 people have died, according to an AFP tally.
It saw its worst disaster when a South Korean expedition was buried by snow while attempting to climb the northeast face in 1972. The 15 dead included 10 Sherpas and the Korean expedition leader.
Three still missing after deadly Nepal avalanche: police Kathmandu (AFP) Sept 24, 2012 – Two French climbers and a Canadian were still missing Monday, police said, after an avalanche killed at least nine people ahead of an attempt on one of the world’s highest mountains.”We have now stopped helicopter rescue operations. Two French and a Canadian mountaineer are still missing. Sherpa guides are in the mountains searching for them,” said district police chief Basanta Bahadur Kunwar.Nepal’s tourism board had earlier put the missing figure at seven, but police said four of those were among 13 already rescued on Sunday.Kunwar said five mountaineers had been airlifted from among the survivors at Manaslu base camp Sunday and were being treated in Kathmandu.
“The other eight mountaineers who are at the base camp have not sustained any injuries. They have said they will either walk down or will make an attempt to reach the peak again and have told officials that they should not be rescued.”
Rescuers scaled down a search Monday for two French climbers and a Canadian missing in a Nepal avalanche which killed at least nine people attempting to scale one of the world’s highest peaks.
Police said they had halted a helicopter rescue mission as hopes faded for the trio, part of a group hit by a wall of snow in their tents near the peak of the 8,156-metre (26,759-foot) Manaslu in the early hours of Sunday.
“We have now stopped helicopter rescue operations. Two French and a Canadian mountaineer are still missing. Sherpa guides are in the mountains searching for them,” district police chief Basanta Bahadur Kunwar told AFP.
Nepal’s tourism board had earlier put the missing figure at seven, but police said four of those were among 13 already rescued on Sunday.
Among those reported missing was a doctor from the French-speaking Canadian province of Quebec, cardiologist Dominique Ouimet, the man’s sister said.
“The tents seem to have disappeared because the avalanche came by,” Isabelle Ouimet told Radio Canada, adding that her brother was at camp three when the avalanche struck.
Kunwar said five mountaineers had been airlifted from among the survivors at Manaslu base camp Sunday and were being treated in Kathmandu.
“The other eight mountaineers who are at the base camp have not sustained any injuries. They have said they will either walk down or will make an attempt to reach the peak again and have told officials that they should not be rescued.”
Eight of the dead have been identified, Nepal tourism board spokesman Sarad Pradhan told AFP, adding that four were French, one a Nepali mountain guide, one a Spaniard, one German and one Italian.
Harrowing accounts of the avalanche began to emerge from survivors being treated in Kathmandu.
“We were sleeping in our tent after having dinner, when all of a sudden we heard the noise of other climbers screaming. Within moments, we were hit by the avalanche,” Andreas Reiter, 26, from Germany, was quoted as telling the Himalayan Times from his hospital bed in the capital.
“I witnessed one of the team members die.”
SNGM vice-president Christian Trommsdorff described the French victims as three mountain guides from the Chamonix area in the Alps and their clients, who were part of two expeditions.
The avalanche happened at around 7,400 metres and carried away part of camp number three at 6,800 metres, Trommsdorff told AFP.
Manaslu, the eighth-highest mountain in the world, is considered one of the most dangerous, with scores of deaths in recent years and just a few hundred successful ascents.
Laxmi Dhakal, head of the home ministry’s disaster response division, confirmed the avalanche had hit camp three and said it had created “a flood of snow”.
Nepal is home to eight of the world’s 14 peaks over 8,000 metres, including the world’s highest, Mount Everest, and attracts thousands of mountaineers every year.
Most come in the spring, when Himalayan conditions are at their best, but there is also a short climbing season in late September and October after the monsoon rains end.
Manaslu is nicknamed “Killer Mountain” by locals because a series of snowslides have claimed the lives of scores of mountaineers since it was first conquered in 1956. The latest deaths mean at least 62 people have died, according to an AFP tally.
It saw its worst disaster when a South Korean expedition was buried by snow while attempting to climb the northeast face in 1972. The 15 dead included 10 Sherpas and the Korean expedition leader.
Those who attempt the summit are experienced climbers who will tackle other Himalayan peaks as well, said Dawa Steven Sherpa, two-time summiteer of Everest from Kathmandu.
“People who normally climb up Manaslu have bigger peaks in mind, or they are people who are attempting to climb all the 8,000m peaks,” he told AFP.
“Very few people climb Manaslu for the sake of just climbing Manaslu.”
Nepal’s worst-ever climbing disaster happened in 1995 when a huge avalanche struck the camp of a Japanese trekking group in the Mount Everest region, killing 42 people including 13 Japanese.
According to the World Health Organization, a British tourist to Qatar has been infected with an unknown virus that has damaged his kidneys and lungs. The United Nations health body, which issued a statement through its “global alert and response” system, said tests on the patient, a 49-year-old Qatari man, confirmed the presence of a new, or novel, coronavirus. The tourist was hospitalized in Qatar, but after his condition deteriorated, he was transferred to a hospital in the UK. After conducting various examinations, doctors have concluded that the tourist was infected with an unknown virus thought to have mutated from the coronavirus, known to be the cause of severe acute respiratory syndrome (SARS).
Biohazard name:
SARS like symptomes
Biohazard level:
4/4 Hazardous
Biohazard desc.:
Viruses and bacteria that cause severe to fatal disease in humans, and for which vaccines or other treatments are not available, such as Bolivian and Argentine hemorrhagic fevers, H5N1(bird flu), Dengue hemorrhagic fever, Marburg virus, Ebola virus, hantaviruses, Lassa fever, Crimean-Congo hemorrhagic fever, and other hemorrhagic or unidentified diseases. When dealing with biological hazards at this level the use of a Hazmat suit and a self-contained oxygen supply is mandatory. The entrance and exit of a Level Four biolab will contain multiple showers, a vacuum room, an ultraviolet light room, autonomous detection system, and other safety precautions designed to destroy all traces of the biohazard. Multiple airlocks are employed and are electronically secured to prevent both doors opening at the same time. All air and water service going to and coming from a Biosafety Level 4 (P4) lab will undergo similar decontamination procedures to eliminate the possibility of an accidental release.
By Michelle Roberts Health editor, BBC News online
In both cases to date, the infection was acquired in the Middle East
A new respiratory illness similar to the Sars virus that spread globally in 2003 and killed hundreds of people has been identified in a man who is being treated in Britain.
The 49-year-old man, who was transferred to a London hospital by air ambulance from Qatar, is the second person confirmed with the coronavirus.
The first case was a patient in Saudi Arabia who has since died.
Officials are still determining what threat the new virus may pose.
The World Health Organization has not recommended any travel restrictions.
Sars was very quick off the mark infecting hospital staff etc and this new virus does not to me appear to be in the same ‘big bang’ group”
Prof John Oxford A virology expert at Queen Mary, University of London
Prof John Watson, head of the respiratory diseases department at the UK’s Health Protection Agency, said: “In the light of the severity of the illness that has been identified in the two confirmed cases, immediate steps have been taken to ensure that people who have been in contact with the UK case have not been infected, and there is no evidence to suggest that they have.
“Further information about these cases is being developed for healthcare workers in the UK, as well as advice to help maintain increased vigilance for this virus.”
He said there was no specific evidence of the virus spreading from person to person and he had no advice for the public or returning travellers.
Peter Openshaw, director of the Centre for Respiratory Infection at Imperial College London, told Reuters that at this stage the novel virus looked unlikely to prove a concern, and may well only have been identified due to sophisticated testing techniques.
And Prof John Oxford, a virology expert at Queen Mary, University of London, said he felt “somewhat relaxed” about the news.
“Sars was very quick off the mark infecting hospital staff etc and this new virus does not to me appear to be in the same ‘big bang’ group.”
Coronaviruses are a large family of viruses which includes ones that cause the common cold and Sars (severe acute respiratory syndrome).
This new virus is different from any coronaviruses that have previously been identified in humans.
There have been a small number of other cases of serious respiratory illness in the Middle East in the past three months, one of whom was treated in the UK but has since died.
This person’s illness is also being investigated, although there is no evidence as yet to suggest that it is caused by the same virus or linked to the current case. No other confirmed cases have been identified to date in the UK.
Sars is a serious respiratory infection that caused a global outbreak in 2002, spreading from Hong Kong to more than 30 different countries around the world and killing around 800 people. Although it has not been eradicated its spread was fully contained in 2003. Like other coronaviruses, it is spread through droplets of body fluids – produced by sneezing and coughing.
Over 200 cases of Cholera have been recorded within two weeks in the Greater Accra region, raising concerns about the sanitation situation in the regionâs busy centres. Health officials say they are marveled by the increase in the figures and say they intend intensifying their sensitization programmes. Last week, there reports of an outbreak of the disease in parts of the Upper East Region following the floods in the area. The Disease Control Officer at the regional Ghana Health Service unit, Ato Ashong told XYZ News something drastic measures will have to be taken to reverse the trend. According to Mr Ashong, the cases have shot up from double figures to more than two hundred cases in the last few days. He said the unit is not certain about what might have caused the sudden upsurge in the disease but assured that it will be liaising with health centres across the region to handle the cases.
23.09.2012
Epidemic Hazard
USA
State of New York, New Paltz [Mountain Laurel Waldorf School]
An elementary school aged student at the Mountain Laurel Waldorf School in New Paltz has come down with a case of the measles. âItâs significant because about 30 percent of people who get measles can suffer serious complications and there is a fatality rate associated with measles,â said Dutchess County Director of Communicable Diseases, Linda Squires. Officials said a number of students at the school were not vaccinated and are now at risk of becoming ill. Measles is a highly contagious virus that could easily be spread by simply breathing in the same air as someone who has the illness. âWhatâs interesting about measles is that someone is in a room and has left, for two hours after that time, that air is still able to transmit measles to other persons in that area,â Squires explained. Ulster and Dutchess County health officials are advising anyone who may have visited the school since September 10 to ensure they are up to date with their vaccinations. âItâs recommended that people get that after the age of 12 months and then again between the ages of 4-6, and it should provide lifelong immunity,â Squires added. Children, pregnant women, and people with pre-existing medical conditions are at a higher risk of having serious complications after contracting the virus. Symptoms include fever, red watery eyes, runny nose, cough and a rash all over the body. Some children also can get an ear infection and fewer numbers can develop pneumonia as a result.
MessageToEagle.com – Climate scientists warn that the rapid and extensive Arctic sea ice melt due to global warming, may cause extreme weather this winter in North America and Europe. A few months ago, researchers from the University of Reading announced that Europe’s future climate will bring violent Winter storms.
Now, climate scientist Jennifer Francis, a researcher at the Institute of Marine and Coastal Sciences at Rutgers University said that “shrinking Arctic ice can be tied to such recent weather events as prolonged cold spells in Europe, heavy snows in the Northeastern U.S. and Alaska, and heat waves in Russia.”
Previously scientists predicted that it would take 30 or 40 more years before the Arctic was ice-free in the summer, Los Angeles Times reports.
However, since 2005 the rate of summer melt increased enormously and today scientists say Arctic ice covers about 1 million square miles
“I think that what we can expect in the next few years is further collapse leading to an ice-free Arctic in summer. It really is a dramatic change,” said Peter Wadhams, an ocean physics professor at the University of Cambridge
“The loss of Arctic ice has several effects. Ice reflects heat and solar energy back into space.With less ice cover, that heat energy is instead absorbed by the ocean, which warms and melts more ice.Currently, the Arctic region is the fastest-warming region on the planet, and the change in temperature will probably influence weather patterns here and in Europe, according to Francis.
The heating and cooling of Arctic seawater has been affecting the jet stream — the river of air that flows from west to east high above the Earth’s surface — and has slowed it down, Francis said.
The jet stream controls the formation and movement of storm systems, so when its movement slows, weather conditions persist for longer periods of time over the same area. They get “stuck.”
“If you’re in a nice dry pattern with sunny skies, it’s great if it lasts for a few days. But If it lasts for a few weeks, well then you’re starting to talk about a drought,” Francis said. “If you have a rainy pattern and it hangs around for a long time, then that becomes a situation that could lead to flooding.”
Arctic warming will influence weather to the south during the late fall and winter. While Francis said it would probably result in severe weather this winter, it was impossible to predict when and where those events would occur.
Record ice melts this year and in 2007 have alarmed many scientists, mostly because they thought it would take many more years to reach this state.
James Overland, an oceanographer with the National Oceanic and Atmospheric Administration, said forecasts failed to account for the physics of lost solar energy reflection and warming ocean water.
“These are really surprises to most scientists,” Overland said. “In looking at climate models that are used to look forward, they’ve tended to say the Arctic may be ice-free by 2040 or 2050. It looks like things are happening a lot faster, and it’s because not all of the physics that we’re seeing today were well-handled in these climate models.”
Overland, who is also an associate professor at the University of Washington’s Department of Atmospheric Sciences, said these effects are known as “Arctic amplification” and would carry heavy consequences for wildlife like polar bears and walruses by reducing their habitat.
The sea ice in the Arctic Ocean dropped below the previous all-time record set in 2007. This year also marks the first time that there has been less than 4 million square kilometers (1.54 million square miles) of sea ice since satellite observations began in 1979. This animation shows the 2012 time-series of ice extent using sea ice concentration data from the DMSP SSMI/S satellite sensor. The black area represents the daily average (median) sea ice extent over the 1979-2000 time period. Layered over top of that are the daily satellite measurements from January 1 — September 14, 2012. A rapid melt begins in July, whereby the 2012 ice extents fall far below the historical average
The frozen cap of the Arctic Ocean appears to have reached its annual summertime minimum extent and broken a new record low on Sept. 16, the National Snow and Ice Data Center (NSIDC) has reported. Analysis of satellite data by NASA and the NASA-supported NSIDC at the University of Colorado in Boulder showed that the sea ice extent shrunk to 1.32 million square miles (3.41 million square kilometers).
The new record minimum measures almost 300,000 square miles less than the previous lowest extent in the satellite record, set in mid-September 2007, of 1.61 million square miles (4.17 million square kilometers). For comparison, the state of Texas measures around 268,600 square miles.
NSIDC cautioned that, although Sept. 16 seems to be the annual minimum, there’s still time for winds to change and compact the ice floes, potentially reducing the sea ice extent further. NASA and NSIDC will release a complete analysis of the 2012 melt season next month, once all data for September are available.
Satellite data reveal how the new record low Arctic sea ice extent, from Sept. 16, 2012, compares to the average minimum extent over the past 30 years (in yellow). Sea ice extent maps are derived from data captured by the Scanning Multichannel Microwave Radiometer aboard NASA’s Nimbus-7 satellite and the Special Sensor Microwave Imager on multiple satellites from the Defense Meteorological Satellite Program. Credit: NASA/Goddard Scientific Visualization Studio
Arctic sea ice cover naturally grows during the dark Arctic winters and retreats when the sun re-appears in the spring. But the sea ice minimum summertime extent, which is normally reached in September, has been decreasing over the last three decades as Arctic ocean and air temperatures have increased. This year’s minimum extent is approximately half the size of the average extent from 1979 to 2000. This year’s minimum extent also marks the first time Arctic sea ice has dipped below 4 million square kilometers.
“Climate models have predicted a retreat of the Arctic sea ice; but the actual retreat has proven to be much more rapid than the predictions,” said Claire Parkinson, a climate scientist at NASA Goddard Space Flight Center, Greenbelt, Md. “There continues to be considerable inter-annual variability in the sea ice cover, but the long-term retreat is quite apparent.”
The thickness of the ice cover is also in decline.
“The core of the ice cap is the perennial ice, which normally survived the summer because it was so thick”, said Joey Comiso, senior scientist with NASA Goddard. “But because it’s been thinning year after year, it has now become vulnerable to melt”.
The disappearing older ice gets replaced in winter with thinner seasonal ice that usually melts completely in the summer.
MessageToEagle.com – Will Nunavut that extends to the North Pole and includes most of Canada’s Arctic islands be soon green again?
It’s one of the most remote and sparsely settled regions in the world. It has a population of only 31,906 mostly Inuit, spread over an area the size of Western Europe.
Global climate change means that recently discovered ancient forests in Canada’s extreme north could one day return, according to Alexandre Guertin-Pasquier of the University of Montreal’s Department of Geography, who is presenting his findings at the Canadian Paleontology Conference in Toronto.
Until 1999, Nunavut was part of the Northwest Territories“According to the data model, climate conditions on Bylot Island will be able to support the kinds of trees we find in the fossilized forest that currently exist there, such as willow, pine and spruce.
Iqaluit is the territorial capital and the largest community of the Canadian territory of NunavutI’ve also found evidence of a possible growth of oak and hickory near the study site during this period.,” Guertin-Pasquier said.
“Although it would of course take time for a whole forest to regrow, the findings show that our grandchildren should be able to plant a tree and watch it grow.”
The fossilized forest found on Bylot Island in Nunavut is between 2.6 and 3 million years old according to estimations based on the presence of extinct species and on paleomagnetic analyses. Paleomagentic analysis involves looking at how the Earth’s magnetic field has affected the magnetic sediment in rocks – like a compass, they turn to follow the magnetic poles.
Click on image to enlarge
Scientists can use this information to date rocks as the history of the movement of the magnetic poles is relatively well known.
Wood samples in the ancient forest have been preserved throughout the eons in peat and by permafrost.
“We studied the sediments in the forest and discovered pollen that are usually found in climates where the annual average temperature is around 0 degrees Celsius or 32 Fahrenheit,” Guertin-Pasquier said.
Click on image to enlarge
By comparison, current average conditions on Bylot Island are around -15°C ( 5°F). The samples were taken from few drill holes 10 cm in diameter of one to two metres deep. The harshness of the Arctic winter and the remoteness of the forest mean that scientists have very little opportunity to delve into its secrets.
Click on image to enlarge
Even during the summer, the Guertin-Pasquier and his colleagues had to endure extreme conditions such as 80 km/h winds.
“There is so much mystery that surrounds this forest – for example, how these trees managed to survive the relentless dark of the Arctic winter,” he said, adding that the next steps for this line of research could include looking more closely at other plant remains in order to get a better understanding of what the local flora was. MessageToEagle.com.
MessageToEagle.com – Coronal cavities are voids in coronal emission often observed above high latitude filament channels.
Sometimes, these cavities have areas of bright X-ray emission in their centers.
Now, NASA scientists focus on this mysterious phenomenon because it seems to be strongly related to dangerous coronal mass ejections (CMEs).
And CMEs, scientists have to worry about.
Click on image to enlargeThe faint oval hovering above the upper left limb of the sun in this picture is known as a coronal cavity. NASA’s Solar and Terrestrial Relations Observatory (STEREO) captured this image on Aug. 9, 2007. A team of scientists extensively studied this particular cavity in order to understand more about the structure and magnetic fields in the sun’s atmosphere. Credit: NASA/STEREO
The Sun’s abnormal behavior is a cause for concern even we all know that activity near the Sun’s surface rises and falls through an 11-year cycle that is due to peak in 2013 or 2014.
What causes giant explosions in the sun’s atmosphere? How do they form?
The cavity as it appeared on the west limb on 2008 July 21. The location of the cavity is indicated by a box. Source
Scientists want to better understand the complexity of solar activity and its dangerous events. It’s crucial to find a way to predict them and minimize the damage they might cause.
“We don’t really know what gets these CMEs going,” says Terry Kucera, a solar scientist at NASA’s Goddard Space Flight Center in Greenbelt, Md. “So we want to understand their structure before they even erupt, because then we might have a better clue about why it’s erupting and perhaps even get some advance warning on when they will erupt.”
A team of researchers used NASA data to study a precursor of CMEs called coronal cavities – a larger formation, appearing from the side almost as the filament inside a large light bulb.
The bright structure around and above that light bulb is called a streamer, and the inside “empty” area is called a coronal prominence cavity.
According to scientists, the cavity is in the shape of a croissant, with a giant inner tube of looping magnetic fields.
The cavity appears to be 30% less dense than the streamer surrounding it, and the temperatures vary greatly throughout the cavity, but on average range from 1.4 million to 1.7 million Celsius (2.5 to 3 million Fahrenheit), increasing with height.
Of course, to describe a cavity, a space that appears empty from our viewpoint, from 93 million miles away – is not any easy task for scientists.
Click on image to enlargeThe evolution of the part of the cavity over several days – visible from Earth, July 2008. Source
The Aug. 9, 2012 cavity lay at a fortuitous angle that maximized observations of the cavity itself, as opposed to the prominence at its base or the surrounding plasma.
“Our point with all of these research projects into what might seem like side streets, is ultimately to figure out the physics of magnetic fields in the corona,” says Sarah Gibson, a solar scientist at the High Altitude Observatory at the National Center for Atmospheric Research (NCAR) in Boulder, Colo.
Gibson is also an author on all three cavity papers.
“Sometimes these cavities can be stable for days and weeks, but then suddenly erupt into a CME. We want to understand how that happens.”
We’re accessing so much data, so it’s an exciting time – with all these observations, our understanding is coming together to form a consistent story.”
************************************************************************************************************
[In accordance with Title 17 U.S.C. Section 107, this material is distributed without profit, for research and/or educational purposes. This constitutes ‘FAIR USE’ of any such copyrighted material.]
Roughly 1,100 years ago, the Changbaishan volcano that lies along the border between northeastern China and North Korea erupted, sending pyroclastic flows dozens of kilometers and blasting a 5-kilometer (3-mile) wide chunk off of the tip of the stratovolcano.
The eruption, known as the Millennium eruption because of its proximity to the turn of the first millennium, was one of the largest volcanic events in the Common Era. In the subsequent period, there have been three smaller eruptions, the most recent of which took place in 1903. Starting in 1999, spurred by signs of resumed activity, scientists established the Changbaishan Volcano Observatory, a network to track changing gas compositions, seismic activity, and ground deformation. Reporting on the data collected over the past 12 years, Xu et al. find that these volcanic indices each leapt during a period of heightened activity from 2002 to 2006. The authors find that during this brief active period, earthquake occurrences increased dramatically. From 1999 to 2002, and from 2006 to 2011, they registered 7 earthquakes per month using 11 seismometers. From 2002 to 2006, this rate increased to 72 earthquakes per month, peaking in November 2003 with 243 events. Further, tracking the source of the earthquakes, the authors tie the bulk of the events to a region located 5 kilometers (3 miles) beneath the volcanic caldera, a source that slowly crept upward throughout the study period, suggestive of an ongoing magmatic intrusion. Gas composition measurements collected from hot springs near the volcano showed spikes in carbon dioxide, hydrogen, helium, and nitrogen gases, which the authors suggest could be related to magmatic outgassing. Ground deformation studies, too, show a brief period of rapid expansion. The authors suggest that though Changbaishan is likely not gearing up for an imminent eruption, one could be expected in the next couple of decades. More information: Recent unrest of Changbaishan volcano, northeast China: A precursor of a future eruption? Geophysical Research Letters, doi:10.1029/2012GL052600 , 2012
A volcano in northern Indonesia has spewed hot smoke and ash thousands of metres into the air in two new eruptions. Mount Lokon on Sulawesi island had been dormant before rumbling back to life last year. Government volcanologist Hendrasto says it unleashed two strong eruptions on Friday. Residents have been put on alert, but no evacuations are planned since the nearest villages are beyond the danger area about 2.5 kilometres from the crater. Mount Lokon’s last major eruption in 1991 killed a Swiss hiker and forced thousands to flee. The volcano is one of five on high alert in Indonesia. The archipelago straddles the “Pacific Ring of Fire” and has more active volcanoes than any other nation.
Heavy rains and wind gusts knocked down trees and flooded roads in Long Island and Westchester County, leaving thousands without power. The band of storms on Tuesday prompted the National Weather Service to issue a tornado warning for southwestern Suffolk County. The warning was in effect until 10 p.m. A tornado watch expired at 11 p.m. for Suffolk and Nassau counties.
Army and the National Disaster Response Force (NDRF) rescue teams were deployed in upper Assam’s Tinsukia and Dhemaji districts on Friday to rescue thousands of people marooned by flood waters as the overall flood situation turned critical in the State following incessant rain for past more than a week. A swollen Brahmaputra has submerged vast areas of Majuli following a breach in an embankment at Sonowal Kachari village of the island on Thursday. The administration cautioned the residents of the river-island to stay alert. Principal Secretary, Revenue and Disaster Management, V.K. Pipersenia, told The Hindu that six columns of the Army have been deployed for rescuing marooned people at Sadiya in Tinsukia district and in Jonai sub-division. Four NDRF teams were deployed for rescue operations. Army and NDRF boats tried to negotiate the strong current of flood waters in Sadiya. As strong current prevented them from reaching out to the marooned people in Sadiya from Tinsukia side, the rescue teams approached the flood-hit areas from Arunachal Pradesh side and rescued some people. Mr. Pipersenia said the services of Indian Air Force (IAF) were requisitioned but the IAF choppers could not carry out any operation during the day because of bad weather. Over five lakh people in 13 districts have been affected in the current and fourth wave of floods in the State. In addition to the breach in the embankment in Majuli, the Brahmaputra has breached an embankment at Dolopa in Sivasagar district and a ring bund at Chawalkhowa near Bogibeel in Dibrugarh district, while river Nona breached an embankment in Kamrup district. Flood situation was also critical in lower Assam’s Kamrup, Baksa and Barpeta districts.
Flooding continues to cause problems throughout Southcentral Alaska. Jeremy Zidek, spokesman for the state Division of Homeland Security and Emergency Management, says in a release that there have been reports of flooding, landslides and road closures throughout the area. But there has been no report of major injuries. Residents in East Talkeetna are being told to evacuate because of flooding. The Red Cross has established three shelters in the Matanuska-Susitna Borough and helped with another in Seward. Weather problems are not confined to Southcentral Alaska. Zidek says a landslide has blocked access from the village of Chenega to its airport, and state transportation officials are working to restore access. And an assessment team is in Tanacross to evaluate damage from Sunday’s wind storm.
Residents of Talkeetna are being asked to evacuate the town after its dike system against heavy flooding failed Friday, according to local firefighters. The evacuation is now voluntary, although an initial order was mandatory. Talkeetna Fire Department Battalion Chief Johnny Murdoch, the incident commander for flooding in the area, says the Susitna River started backing up to the Talkeetna River, causing the dike to fail. According to local officials the decision to evacuate Talkeetna was made by Alaska State Troopers, with authorities expecting water to continue rising Friday afternoon. The Associated Press reports that overnight rains in Talkeetna ranged from half an inch to 1 1/2 inches over a 6- to 8-hour period. The Talkeetna River was within a foot of its record stage of 17.4 feet, with officials telling the AP about 35 percent of Talkeetna has some form of water coverage. Students from Talkeetna’s elementary school were being bused to the local high school Friday. Traffic was blocked from entering Talkeetna until the evacuation was no longer mandatory, a change made shortly before 2 p.m. In a flood warning effective through 10 p.m. Friday, the National Weather Service says a levee protecting the town was breached as of 1 p.m. The Talkeetna River is 4 feet above flood stage, and expected to crest Friday evening. âAll persons in the vicinity of Talkeetna should take precautions now to protect life and property,â meteorologists wrote. The NWS advises people to avoid crossing flowing streams — even small ones â on foot, or driving across flooded roadways in cars, under the slogan âTurn around, donât drown.â
Students at San Francisco State University are being warned to look for symptoms of the chicken pox after a third person came down with the disease this week. School officials say it involves a student who lives on campus and uses the dining facilities. To prevent an outbreak, SFSU held a mass vaccination Friday. Chicken pox is highly contagious. Symptoms can pop up two to three weeks after contact and include fever and a rash that develops into blisters.
Biohazard name:
Chickenpox
Biohazard level:
2/4 Medium
Biohazard desc.:
Bacteria and viruses that cause only mild disease to humans, or are difficult to contract via aerosol in a lab setting, such as hepatitis A, B, and C, influenza A, Lyme disease, salmonella, mumps, measles, scrapie, dengue fever, and HIV. “Routine diagnostic work with clinical specimens can be done safely at Biosafety Level 2, using Biosafety Level 2 practices and procedures. Research work (including co-cultivation, virus replication studies, or manipulations involving concentrated virus) can be done in a BSL-2 (P2) facility, using BSL-3 practices and procedures. Virus production activities, including virus concentrations, require a BSL-3 (P3) facility and use of BSL-3 practices and procedures”, see Recommended Biosafety Levels for Infectious Agents.
Symptoms:
Status:
confirmed
Today
Epidemic Hazard
USA
State of New York, New Paltz [Mountain Laurel Waldorf School]
A case of measles has been confirmed in a student who attends the Mountain Laurel Waldorf School in New Paltz, according to the Dutchess County Department of Health. The measles case was reported by Dutchess County Health Commissioner Dr. Michael Caldwell in a press release emailed to local media outlets late Friday. It was not immediately clear why the release came from a Dutchess County official rather than one in Ulster County, where the private school is located, and the name and hometown of the infected person were not provided. Caldwell said his office has “been in close communication” with the Ulster County Department of Health and the state Department of Health. Caldwell said anyone who has visited the school since Sept. 10 or has had contact with anyone from the school since that date should make sure their measles vaccinations are up to date. Those who lack proper vaccinations should consult with a doctor. Caldwell said his department has learned that a number of students at the New Paltz school have not been vaccinated for measles, meaning they could become ill and put others at risk. Caldwell said all medical practices and laboratories in the area should be on high alert that there may be a number of children and family members who have been exposed and could spread the disease further. Incidents of measles, which is highly contagious, have increased in the United States recently due to a growing number of unvaccinated individuals who travel to countries where measles is prevalent, Caldwell said.
Biohazard name:
Measles
Biohazard level:
2/4 Medium
Biohazard desc.:
Bacteria and viruses that cause only mild disease to humans, or are difficult to contract via aerosol in a lab setting, such as hepatitis A, B, and C, influenza A, Lyme disease, salmonella, mumps, measles, scrapie, dengue fever, and HIV. “Routine diagnostic work with clinical specimens can be done safely at Biosafety Level 2, using Biosafety Level 2 practices and procedures. Research work (including co-cultivation, virus replication studies, or manipulations involving concentrated virus) can be done in a BSL-2 (P2) facility, using BSL-3 practices and procedures. Virus production activities, including virus concentrations, require a BSL-3 (P3) facility and use of BSL-3 practices and procedures”, see Recommended Biosafety Levels for Infectious Agents.
Symptoms:
Status:
confirmed
Today
Epidemic Hazard
USA
State of Montana, [Florence Carlton School Distric]
Administrators at the Florence Carlton School District report that between 20 and 30 students are sick with an undiagnosed illness. Most of the reports come from younger students between kindergarten and 6th grades. They’re reporting symptoms like nausea, vomiting and diarrhea. It’s not unlike what the district dealt with in March. Back then, the schools closed for several days to deal with a strain of the stomach flu. Right now, Superintendent John McGee says the district is watching and waiting to see what develops. Ravalli County Health Officials are investigating the causes for the illness. Judy Griffin Ravalli County Health Director says if your child is showing any symptoms of any sickness please take them to your primary physician.
Biohazard name:
Unidentified illness
Biohazard level:
0/4 —
Biohazard desc.:
This does not included biological hazard category.
Around 6,000 children in Cumbria are at risk of getting measles because they have not had the MMR vaccination, health chiefs have said. NHS Cumbria said 95% of babies in the county had been immunised but that thousands aged between five and 16 had not had the jab. Teenagers moving to Cumbria are also being urged to get protected. In recent months 20 cases of measles – which can leave victims deaf – have been reported in the county. The MMR vaccine is given in two doses, the first after the age of one, the second before the child starts school. Dr Rebecca Wagstaff, the county’s deputy director of public health, said: “Measles is highly infectious and anyone who has not previously been vaccinated is at risk when it gets into a community, as it has done here.”
Biohazard name:
Measles
Biohazard level:
2/4 Medium
Biohazard desc.:
Bacteria and viruses that cause only mild disease to humans, or are difficult to contract via aerosol in a lab setting, such as hepatitis A, B, and C, influenza A, Lyme disease, salmonella, mumps, measles, scrapie, dengue fever, and HIV. “Routine diagnostic work with clinical specimens can be done safely at Biosafety Level 2, using Biosafety Level 2 practices and procedures. Research work (including co-cultivation, virus replication studies, or manipulations involving concentrated virus) can be done in a BSL-2 (P2) facility, using BSL-3 practices and procedures. Virus production activities, including virus concentrations, require a BSL-3 (P3) facility and use of BSL-3 practices and procedures”, see Recommended Biosafety Levels for Infectious Agents.
Symptoms:
Status:
confirmed
20.09.2012
Epidemic Hazard
Somalia
State of Lower Juba, Hoosingo [District of Badade]
A suspected cholera outbreak has killed at least 19 people since the beginning of September, with 12 still sick in the southern Somali village of Hoosingo in Lower Juba, the United Nations IRIN news service reported Tuesday (September 18th). “One of the biggest problems we have is that we do not know what this disease is,” said Hoosingo village commissioner Aden Ibrahim Dhaqane. Schools, religious centres and restaurants have been closed to prevent the outbreak from spreading, he said. “We call [on] the aid agencies to help us in the following areas: provision of a steady supply of medicine, [the] identification of the disease and the setting up of health centres,” he said, adding that the village does not have a health facility. An emergency weekly update on Somalia from the World Health Organisation reported 107 cases of the disease across the country September 5th-13th. “With the ongoing conflict and subsequent population displacement and disruption of the existing health service access points in the region, the risk of sporadic cholera outbreaks in the southern zone cannot be excluded,” the WHO report said.
Press Release: New Zealand Climate Science Coalition
ANTARCTIC ICE AREA SETS RECORD HIGH
“Day 258 of 2012 is the highest for this date since satellite scanning of Antarctic ice areas commenced 33 years ago” the New Zealand Climate Science Coalition announced today. “It is also the fifth highest daily value on record.”
Coalition chairman, Hon Barry Brill, says the most remarkable aspect is the extent to which the 2012 area exceeds normal Antarctica averages. “The sea ice cover yesterday was 311,000 square kilometres above the 1979-2012 average. The surplus ice is more than twice the area of New Zealand”.
“The Antarctic dimensions come partly at the expense of Arctic sea ice” said Mr Brill. “Over the 33-year period aggregate global sea ice volumes have remained steady, but there are fluctuations between the two polar areas from year to year. The fluctuations are the result of ocean currents and wind patterns, rather than temperatures”.
“Antarctic ice is much more important than that of the Arctic. The area of its sea ice is a million square kilometres larger than the highest value ever recorded in the Arctic. Then, of course, the Antarctic is an entire continent, with more than 90% of the earth’s glacial ice” said Mr Brill.
“It is appropriate that this record should occur in a week that The Listener carries a cover story featuring the winter low point of Arctic ice, along with multiple pictures of calving glaciers and forlorn polar bears,” said Mr Brill. “The magazine has little to say about the Antarctic apart from complaining that it is “poorly understood”. The author also avoids mentioning the glaring facts that no significant global warming has been recorded in the past 16 years, and that sea level rise is apparently decelerating.
“It is unfortunate that under-informed writers, albeit unwittingly, mislead their readers who should be helped to understand the difference between sea ice extent and ice cap ice, both thickness and extent as regards the latter. The ice cap in the Arctic is small compared to the Antarctic. The cap of the Antarctic is increasing in thickness in most places, except around the Antarctic Peninsula.
Sea ice extent is largely a consequence of sea surface temperature, ocean currents and wind,” said Mr Brill, who advised those interested in graphic confirmation of Antarctic sea ice readings to refer to: http://arctic.atmos.uiuc.edu/cryosphere/IMAGES/seaice.anomaly.antarctic.png
and: http://arctic.atmos.uiuc.edu/cryosphere/IMAGES/seaice.anomaly.antarctic.png
The sea ice in the Arctic Ocean dropped below the previous all-time record set in 2007. This year also marks the first time that there has been less than 4 million square kilometers (1.54 million square miles) of sea ice since satellite observations began in 1979. This animation shows the 2012 time-series of ice extent using sea ice concentration data from the DMSP SSMI/S satellite sensor. The black area represents the daily average (median) sea ice extent over the 1979-2000 time period. Layered over top of that are the daily satellite measurements from January 1 — September 14, 2012. A rapid melt begins in July, whereby the 2012 ice extents fall far below the historical average. The National Snow and Ice Data Center (www.nsidc.org) will confirm the final minimum ice extent data and area once the melt stabilizes, usually in mid-September.
A suspected meteorite shower over Scotland has prompted a flurry of 999 calls from worried members of the public. Concerned callers from Airdrie to Arbroath likened the lights they saw in the sky to flares, fireworks and even a plane crash. Coastguard and police forces up and down the country were inundated with reports from around 11pm on Friday night. A spokesman for Forth Coastguard said: “From talking to other stations and to the RAF it’s almost certainly meteorite activity. “Calls came in from all over the place, thick and fast. We’ve had people report possible plane crashes, and others the weirdest fireworks they’ve ever seen. “Folk just haven’t known how to describe what they’ve seen. It’s quite extraordinary.” The spokesman said reports had come from Crail, Johnshaven and Arbroath. Clyde Coastguard said it had received a “flurry” of calls reporting flares seen in Drummore, Airdrie and Brodick on Arran. A spokeswoman said: “When we get it all over and at the same time then we attribute them to meteorites. There was meteorite activity forecast from September 15 to 21.” Shetland Coastguard said a report of a flare at 11.10pm at Duncansby Head near John O’Groats was thought to be part of the meteorite shower.
A mysterious coral die-off on Kauai’s north shore is prompting a team of scientists to take a closer look at what may be killing large areas of coral reef. Marine biologist Terry Lilley has been monitoring and documenting Kauai’s marine environment for the last decade or more. This summer he was struck at how fast he was seeing something kill off what he estimates are millions of coral colonies. Lilley contacted scientists with the U.S. Geological Survey who’ve determined the diseased coral is different from what killed coral heads in Kaneohe Bay last year. The Kauai outbreak is believed to be due to a type of cyano bacteria and fungus which has compromised the health of the reef, according to researcher Thierry Work. Work said he took samples from the reef earlier this month and will be back to collect more coral and fish to conduct toxicology tests. Lilley has sounded the alarm which he hopes will trigger action to get the disease in check, and prevent its spread. “We have a billion dollar industry tourist industry in Hawaii with snorkels who want to see the reefs. If we let them die on the north shore of Kauai, that’s going to be a huge impact financially on the resources, and the money coming in,” said Lilley. The Kauai resident is also concerned about what he saw on a recent dive where he documented evidence of diseased turtles and fish.
Biohazard name:
Mass. Die-off (corals)
Biohazard level:
0/4 —
Biohazard desc.:
This does not included biological hazard category.
The Department of Livestock Sindh has said that evidence has been gathered that points to the dead Australian sheep’s being affected by the deadly Anthrax infection. The day-to-day developments in connection with the Australian sheep’s import to Pakistan continue to give a new twist to the story. Only yesterday, the discovery of thousands of these sheep from a private compound in Malir District had raised new questions. Out of these, six were found dead with bleeding mouths. This is not it. More dead sheep were also discovered buried under ground and these had mouths infested with parasites. Now a fresh disclosure hints at the dead sheep’s being infected by the deadly Anthrax virus. Originally, it was believed that the sheep suffered from scabby mouth disease. Due to the possible presence of Anthrax, the Department of Livestock has refused to get the post-mortem done on the dead sheep. The reason is clear. The deadly Anthrax virus can even kill the staff carrying out the post-mortem of the sheep. Director Department of Livestock, Nazir Kalhoro has said that after the evidence hinting at presence of Anthrax, arrangements are now geing made to burry these sheep with the help of machines. Only those dead sheep will be put through post-mortem which had not contracted Anthrax, he added. Meanwhile, as many as 1800 samples from the sheep have been sent for tests to the Livestock laboratories in Tando Jam, Karachi and Islamabad. According to sources, the company that had imported the sheep has been served a letter in which it has been directed to prove the Anthrax claims of the investigation team wrong or get ready for a legal action.
Biohazard name:
Anthrax (sheep)
Biohazard level:
4/4 Hazardous
Biohazard desc.:
Viruses and bacteria that cause severe to fatal disease in humans, and for which vaccines or other treatments are not available, such as Bolivian and Argentine hemorrhagic fevers, H5N1(bird flu), Dengue hemorrhagic fever, Marburg virus, Ebola virus, hantaviruses, Lassa fever, Crimean-Congo hemorrhagic fever, and other hemorrhagic or unidentified diseases. When dealing with biological hazards at this level the use of a Hazmat suit and a self-contained oxygen supply is mandatory. The entrance and exit of a Level Four biolab will contain multiple showers, a vacuum room, an ultraviolet light room, autonomous detection system, and other safety precautions designed to destroy all traces of the biohazard. Multiple airlocks are employed and are electronically secured to prevent both doors opening at the same time. All air and water service going to and coming from a Biosafety Level 4 (P4) lab will undergo similar decontamination procedures to eliminate the possibility of an accidental release.
A large plastic bin is the first confirmed piece of marine debris from last year’s Japan tsunamis to arrive in Hawaii, the National Oceanic and Atmospheric Administration said Friday. Japanese consular officials confirmed that the blue bin found earlier this week floating in the ocean is from Fukushima, said Ben Sherman, a NOAA spokesman in Washington, D.C. It’s the 12th confirmed piece to hit U.S. or Canada waters, he said. The bin was spotted off Waimanalo, on the southeast coast of Oahu, by Makai Ocean Engineering staff and was retrieved by the Hawaii Undersea Research Laboratory. Used for transporting seafood, the 4-by-4-foot cube bears the name Y.K. Suisan Co. Ltd., the state Department of Land and Natural Resources said. Nikolai Maximenko, a University of Hawaii researcher and ocean currents expert who is studying the trajectory of the tsunami debris, said the bin’s arrival is consistent with his predictions for when the first pieces would get to Hawaii. “It came at the right time, according to our model,” he said. “But in some sense, it could just be a coincidence.” One million to 2 million tons of debris remain in the ocean, but only 1 to 5 percent of that could reach American and Canadian shorelines, Maximenko has said. Crabs and barnacles were found on the bin, the state said, along with five local seabirds. Two flew away and three were found dead inside the bin. There were no foreign plant or animal species in or on the bin, which state officials put in quarantine. Meanwhile, Hawaii fishermen spotted a large dock drifting toward Oahu that may also be tsunami debris. A Maui fisherman climbed on the dock and saw Japanese writing. The 30-feet by 50-feet dock was spotted Wednesday off Molokai, heading toward Oahu. The Coast Guard was notifying mariners of the debris.
Water levels in the Lake Okeechobee top 15 feet and are still rising from rains dumped by Tropical Storm Isaac.
MIAMI — Federal engineers are draining storm-swollen Lake Okeechobee.
Water levels in the South Florida lake top 15 feet and are still rising from rains dumped by Tropical Storm Isaac. Draining the lake will ease pressure on its aging dike.
It also means sending polluted waters down the Caloosahatchee and St. Lucie rivers. Draining the lake in the past has triggered fish-killing algae blooms in both rivers.
Lt. Col. Thomas Greco of the U.S. Army Corps of Engineers tells the Miami Herald that, starting Wednesday, engineers will release small amounts of water to minimize environmental impacts.
According to the Corps plan, the lake’s water levels are supposed to stay between 12.5 feet and 15.5 feet.
Lake Okeechobee functions as a flood control basin, a regional water reservoir and a fishing destination.
An international team of scientists is rewriting a page from the quantum physics rulebook using a University of Florida laboratory once dubbed the coldest spot in the universe.
Scientists are rewriting a page from the quantum physics rulebook using a laboratory once dubbed the coldest spot in the universe. (Credit: iStockphoto/Nick Schlax)
Much of what we know about quantum mechanics is theoretical and tested via computer modeling because quantum systems, like electrons whizzing around the nucleus of an atom, are difficult to pin down for observation. One can, however, slow particles down and catch them in the quantum act by subjecting them to extremely cold temperatures. New research, published in the Sept. 20 edition of the journal Nature, describes how this freeze-frame approach was recently used to overturn an accepted rule of thumb in quantum theory.
“We are in the age of quantum mechanics,” said Neil Sullivan, a UF physics professor and director of the National High Magnetic Field Laboratory High B/T Facility on the UF campus — home of the Microkelvin lab where experiments can be conducted in near-absolute zero temperatures. “If you’ve had an MRI, you have made use of a quantum technology.”
The magnet that powers an MRI scanner is a superconducting coil transformed into a quantum state by very cold liquid helium. Inside the coil, electric current flows friction free.
Quantum magnets and other strange, almost otherworldly occurrences in quantum mechanics could inspire the next big breakthroughs in computing, alternative energy and transportation technologies such as magnetic levitating trains, Sullivan said. But innovation cannot proceed without a proper set of guidelines to help engineers navigate the quantum road.
That’s where the Microkelvin lab comes in. It is one of the few facilities in the world equipped to deliver the extremely cold temperatures needed to slow what Sullivan calls the “higgledy-piggledy” world of quantum systems at normal temperatures to a manageable pace where it can be observed and manipulated.
“Room temperature is approximately 300 kelvin,” Sullivan said. “Liquid hydrogen pumped into a rocket at the Kennedy Space Center is at 20 kelvin.”
Physicists need to cool things down to 1 millikelvin, one thousandth of a kelvin above absolute zero, or -459.67 degrees Fahrenheit, to bring matter into a different realm where quantum properties can be explored.
One fundamental state of quantum mechanics that scientists are keen to understand more fully is a fragile, ephemeral phase of matter called a Bose-Einstein Condensate. In this state, individual particles that make up a material begin to act as a single coherent unit. It’s a tricky condition to induce in a laboratory setting, but one that researchers need to explore if technology is ever to fully exploit the properties of the quantum world.
Two theorists, Tommaso Roscilde at the University of Lyon, France, and Rong Yu from Rice University in Houston, developed the underlying ideas for the study and asked a colleague, Armando Paduan-Filho from the University of Sao Paulo in Brazil, to engineer the crystalline sample used in the experiment.
“Our measurements definitively tested an important prediction about a particular behavior in a Bose-Einstein Condensate,” said Vivien Zapf, a staff scientist at the National High Magnetic Field Laboratory at Los Alamos and a driving force behind the international collaboration.
The experiment monitored the atomic spin of subatomic particles called bosons in the crystal to see when the transition to Bose-Einstein Condensate was achieved, and then further cooled the sample to document the exact point where the condensate properties decayed. They observed the anticipated phenomenon when they took the sample down to 1 millikelvin.
The crystal used in the experiment had been doped with impurities in an effort to create more of a real world scenario, Zapf said. “It’s nice to know what happens in pure samples, but the real world, is messy and we need to know what the quantum rules are in those situations.”
Having performed a series of simulations in advance, they knew that the experiment would require them to generate temperatures down to 1 millikelvin.
“You have to go to the Microkelvin Laboratory at UF for that,” she said. The lab is housed within the National High Magnetic Field Laboratory High B/T Facility at UF, funded by the National Science Foundation. Other laboratories can get to the extreme temperature required, but none of them can sustain it long enough to collect all of the data needed for the experiment.
“It took six months to get the readings,” said Liang Yin, an assistant scientist in the UF physics department who operated the equipment in the Microkelvin lab. “Because the magnetic field we used to control the wave intensity in the sample also heats it up. You have to adjust it very slowly.”
Their findings literally rewrote the rule for predicting the conditions under which the transition would occur between the two quantum states.
“All the world should be watching what happens as we uncover properties of systems at these extremely low temperatures,” Sullivan said. “A superconducting wire is superconducting because of this Bose-Einstein Condensation concept. If we are ever to capitalize on it for quantum computing or magnetic levitation for trains, we have to thoroughly understand it.”
[In accordance with Title 17 U.S.C. Section 107, this material is distributed without profit, for research and/or educational purposes. This constitutes ‘FAIR USE’ of any such copyrighted material.]
The Hunger Site – Your click helps to feed the hungry
Wheatgrass Kits.com
FAIR USE NOTICE
The material on this site is provided for educational and informational purposes. It may contain copyrighted material the use of which has not always been specifically authorized by the copyright owner. It is being made available in an effort to advance the understanding of scientific, environmental, economic, social justice and human rights issues etc. It is believed that this constitutes a 'fair use' of any such copyrighted material as provided for in section 107 of the US Copyright Law. In accordance with Title 17 U.S.C. Section 107, the material on this site is distributed without profit to those who have an interest in using the included information for research and educational purposes. If you wish to use copyrighted material from this site for purposes of your own that go beyond 'fair use', you must obtain permission from the copyright owner. The information on this site does not constitute legal or technical advice.
Any materials (ie. graphics, articles , commentary) that are original to this blog are copyrighted and signed by it's creator. Said original material may be shared with attribution. Please respect the work that goes into these items and give the creator his/her credit. Just as we share articles , graphics and photos always giving credit to their creators when available. Credit and a link back to the original source is required.
If you have an issue with anything posted here or would prefer we not use it . Please contact me. Any items that are requested to be removed by the copyright owner will be removed immediately. No threats needed or lawsuit required. If there is a problem and you do not wish your work to be showcased then we will happily find an alternative from the many sources readily available from creators who would find it amenable to having their work presented to the subscribers of this feed.
Thank you for your time and attention, blessings to all :)


 Boats sit in the Beilun River, which separates China and Vietnam, on Tuesday, October 30. Tropical Storm Son-Tinh was moving northeast along the northern Vietnamese coast on Monday after tearing the roofs off hundreds of houses and breaching flood defenses overnight, the state-run Vietnam News Agency reported.

 An uprooted tree crushes a car in China on Sunday.


 Mount Merapi erupting in 2010. (JG Photo/Boy T Harjanto).


 weather.com


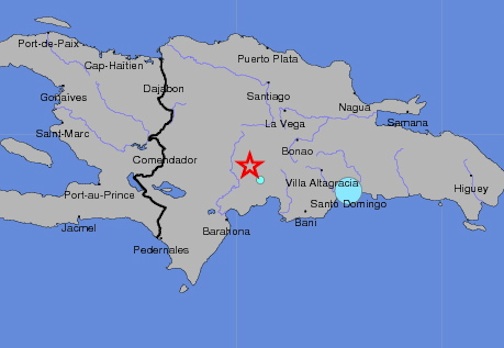

 AP Photo/Damian Dovarganes, File


 VIEW GALLERY

 A large solar flare has burst forth from the sun, showcasing the awesome scale in the universe.


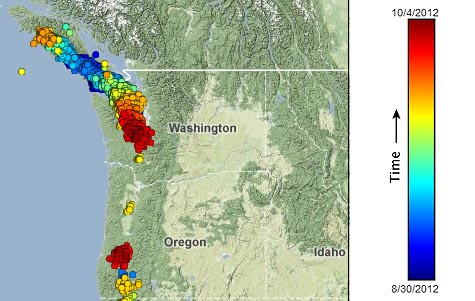


 MessageToEagle.com – The intensity of two such high-pressure systems, present over the northern Pacific and Atlantic oceans during the summer, has changed in recent years.
 The black lines of all the historical tropical storm and hurricane paths curving around that subtropical ridge. If that ridge extends far to the west, tropical storms or hurricanes south of it can in turn be forced far to the west. Credits:
  Changes in the dominant heating component between the twenty-first- and twentieth-century run. p>Blue, red and green colours denote long-wave radiative cooling, sensible heating and condensational heating, respectively, obtained from the CMIP3 multi-model ensemble mean. Credits: Duke University
 MessageToEagle.com – Scientists from Fukuoka Institute of Technology, Japan developed a small artificial satellite named FITSAT-1. It also has the nickname “NIWAKA”.


 MessageToEagle.com – A new stellar-mass black hole has been discovered in our Milky Way galaxy by NASA’s Swift satellite.


 September 25th, 2012 Rsoe Edis")

 September 24th, 2012 Rsoe Edis")

 Jelawat was not yet a “super-typhoon” at the time (about 0600 UTC Monday) of this impressive visible satellite shot, showing the tight, small eye of a well-wrapped tropical cyclone. Southern Philippines is at the lower left. (Joint Typhoon Warning Center)

 In both cases to date, the infection was acquired in the Middle East
 MessageToEagle.com – Climate scientists warn that the rapid and extensive Arctic sea ice melt due to global warming, may cause extreme weather this winter in North America and Europe. A few months ago, researchers from the University of Reading announced that
  Satellite data reveal how the new record low Arctic sea ice extent, from Sept. 16, 2012, compares to the average minimum extent over the past 30 years (in yellow). Sea ice extent maps are derived from data captured by the Scanning Multichannel Microwave Radiometer aboard NASA’s Nimbus-7 satellite and the Special Sensor Microwave Imager on multiple satellites from the Defense Meteorological Satellite Program. Credit: NASA/Goddard Scientific Visualization Studio
  MessageToEagle.com – Will Nunavut that extends to the North Pole and includes most of Canada’s Arctic islands be soon green again?
 Until 1999, Nunavut was part of the Northwest Territories“According to the data model, climate conditions on Bylot Island will be able to support the kinds of trees we find in the fossilized forest that currently exist there, such as willow, pine and spruce.
 Iqaluit is the territorial capital and the largest community of the Canadian territory of NunavutI’ve also found evidence of a possible growth of oak and hickory near the study site during this period.,” Guertin-Pasquier said.


 MessageToEagle.com – Coronal cavities are voids in coronal emission often observed above high latitude filament channels.


 September 21st, 2012 Rsoe Edis")

 Getty Images


