View of the San Cristobal volcano from Chinandega, 150 km from Managua, on December 26, 2012. The San Cristobal volcano began spewing smoke and ashes Tuesday afternoon. HECTOR RETAMAL/AFP/Getty Images
Nicaragua’s government officials on Wednesday issued a yellow (preventive) alert and began the precautionary evacuation of some 300 families in the province of Chinandega (northwest) after new ash emissions started at San Cristobal volcano, following an impressive increase in seismic activity. “San Cristobal volcano, located 135 km northwest of Managua, resumed activity with small fumes gases and ash” said Guillermo Gonzalez, director of the Prevention, Mitigation and Attention to Disasters Network (SINAPRED). Gonzalez said ash columns reach up to 500 meters high, slightly affecting volcano surrounding towns of Tonala, Morazan, Puerto Corinto and Chichigalpa, but without causing any damage. First lady and government spokesperson Rosario Murillo, confirmed they have ordered the evacuation of 300 families living in the area. San Cristobal is the tallest of Nicaragua’s seven active volcanoes. On September 8, it began active with gas and ash explosions that reached five miles high.
The series of small ash explosions starting on 25 Dec at around 20h00 local time continued throughout the night and increased in intensity during the morning of 26 Dec. Activity decreased around noon yesterday, but resumed again in the afternoon with 4 more explosions between 13:25 – 16:11 h local time at intervals of 20-60 minutes, accompanied by strong pulses of tremor. More ash emissions and explosions have followed and are at times near continuous. The height of the ash columns is reported to be about 500-800 m above the crater. VAAC Washington was able to observe the ash plumes on satellite and issued warnings about ash plumes at 14,000 (4.2 km) altitude. Light (few mm) ash fall has occurred in up to 6 km distance from the volcano including in several inhabited areas located mainly NW, W, SW and S of the volcano, namely in El Viejo, Grecia No. 1 and 4, Las Rojas, Banderas, and Abraham Rugama. INETER recommends to the population to protect the water supply sources and children in particular from inhaling ash, and has demanded air traffic control to deviate flight paths in the area. The Nicaraguan president has declared orange alert for the departement of Chinandega and authorized the preventive measure to evacuate families living within 3 km radius from the volcano. More than 200 families were reported to have auto-evacuated out of fear the eruption might intensify.
A boulder lies on a road in Yiliang, in southwestern China’s Yunnan Province, following two shallow quakes that struck the area. (STR/AFP/Getty Images)
A series of earthquakes on Friday in southwestern China struck a heavily populated area that lacks sound infrastructure, killing at least 64 people and leaving hundreds more injured, with the death toll likely to increase, state-run media reported.
The U.S. Geological Survey confirmed that two 5.6-magnitude earthquakes hit within an hour of one another in the southwestern province of Yunnan, with both epicenters lying near the mountainous city of Zhaoyang. The agency said there were dozens of aftershocks.
Although only moderately powerful, the two quakes struck at a relatively shallow depth, which increases the likelihood of damage.
The quake was felt and did the most damage in Yunnan and Guizhou provinces, state media said. Video footage from state-run CCTV showed piles of rubble, including bricks and pieces of concrete, strewn about streets.
Nearly all of the deaths were reported in Yunnan’s Yiliang County, a heavily populated area with what is said to have poor infrastructure and building construction. The region, considered one of the poorest in China, is mainly occupied by the Yi ethnic group.
“Many of the buildings there are built from bricks and beams, and they don’t have much load-bearing capacity,” Yunnan seismological chief Huang Fugang said, according to Radio Free Asia. “These structures basically aren’t earthquake-proof.”
State media reported that roads, telecommunications lines, medical facilities, schools, power plants, and other infrastructure were damaged in the quakes.
Four years ago, a quake that struck rural Sichuan Province, located north of Yunnan, left nearly 90,000 people dead. Many people blamed the devastation on badly built schools, bridges, and other buildings.
More than 100,000 people were evacuated in affected areas throughout Yunnan, state mouthpiece Xinhua said, adding that more than 6,000 houses were destroyed and 430,000 homes were said to be damaged. Around 200,000 people will likely have to be moved in Yiliang and the lives of 700,000 people were affected, the news agency reported.
Two buses make their way across a road full of fallen rocks after a series of earthquakes hit the area near Zhaotong municipality at the border of southwest China’s Yunnan and Guizhou province on September 7, 2012. (STR/AFP/GettyImages)
Mr. Zhu of Maoping village in Yilang County told The Epoch Times that around “a third of the houses have collapses and 90 percent are damaged so badly that people can’t live there.”
The death toll is likely to increase in the coming days due to landslides and mudslides triggered by the quakes.
“The hardest part of the rescue now is [the] traffic [situation],” Li Fuchun, the head of the Luozehe township, located near the epicenter of the quake, told Xinhua. “Roads are blocked and rescuers have to climb the mountains to reach hard-hit villages.”
A settlement located near a zinc mine in Luozehe was also seriously damaged with around two dozen families forced to evacuate due to falling boulders. “It is scary. My brother was killed by falling rocks. The aftershocks struck again and again. We are so afraid,” miner Peng Zhuwen was quoted as saying.
News of the quake reverberated throughout Chinese social media websites, including the Sina Weibo Twitter-like site, where numerous people posted their condolences, prayers, and pictures of candles for the victims in the disaster.
On Sunday, two earthquakes hit Kuril Islands in the Russian Far East. The first quake of 5.6 point magnitude on the Richter scale was recorded near the island of Paramushir, says seismological station in the city of Severo-Kurilsk. Glass-ware ringed in cupboards for ten seconds, and ceiling lamps rocked.
The second earthquake with a magnitude of 5.3 points in Richter scale took place in the deep-water Kurilo-Kamchatka trench. The epicenter was located 270 kilometers east of the city of Kurilsk on the island of Iturup.
VietNamNet Bridge – In the morning of September 6, thousands of residents of Bac Tra My district, Quang Nam province, panicked because of four consecutive quakes up to 3.4 on the Richter scale. In the last four days, this region suffered from 12 quakes.
While attending a ceremony to see recruits off, many officials of Bac Tra My district heard big explosions in the earth and fell tremors.
“After the explosion, the ground shook and my car was also shaken,” said Ms. Dung, a district official.
Mr. Tran Van Anh in Phuoc Hiep commune, Phuoc Son district, where is very close to Song Tranh 2 hydro-power plant, said: “At 7.20am, when I was drinking tea with my neighbors, an underground blast exploded. After that the ground shook strongly. We had to run out of the house immediately.”
In Hiep Duc and Nam Tra My districts, hundreds of people fled from their houses because of underground blasts and tremors in the early morning.
The Geo-physic Institute verified that four quakes occurred near the Song Tranh 2 plant in the morning of September 6. The strongest tremor is 3.4 Richter and its epicenter was in Phuoc Hiep commune, which is very close to Song Tranh 2.
According to the institute’s statistics, up to 58 tremors were recorded around Song Tranh 2 plant over the last year. From September 3-6, up to 12 quakes occurred. The strongest tremor was 4.2 Richter. Tremors may come from the Tra Bong or Hung Nhuong-Ta Vi faults, around 3km from Song Tranh 2 dam.
According to a research work by the Geophysics Institute, Song Tranh 2 hydro-power plant is built on the weak layer of the earth’s crust. If strong earthquakes occur, they will cause danger for both the plant and people in the downstream area.
According to the Institute of Science and Technology of Vietnam’s initial conclusion, underground explosions in the region were caused by reservoir induced earthquakes of 3-4 Richter scale from the fault on the left bank of Tranh River.
The capacity of Song Tranh hydro-power plant’s reservoir is over 730 million of cubic meters, which is located over 100m higher than the downstream area. Experts worry that if the dam is broken, it will cause disaster to the downstream region. It is predicted that the reservoir can cause maximal earthquake of up to 5.5 Richter scale.
Prof. Cao Dinh Trieu from the Geophysics Institute says it needs to set up five fixed quake observing stations around the Song Tranh hydro-power plant.
Volcanic craters at Santorini. Image Wikipedia. A new survey suggests that the chamber of molten rock beneath Santorini’s volcano expanded 10-20 million cubic metres – up to 15 times the size of London’s Olympic Stadium – between January 2011 and April 2012. Ads by Google $1249+ Austin Laser Lipo – Get a Free Liposuction Consult. Liposuction Financing is Available. – SonoBelloAustin.com/Liposuction The growth of this ‘balloon’ of magma has seen the surface of the island rise 8-14 centimetres during this period, a team led by Oxford University scientists has found. The results come from an expedition, funded by the UK’s Natural Environment Research Council, which used satellite radar images and Global Positioning System receivers (GPS) that can detect movements of the Earth’s surface of just a few millimetres. The findings are helping scientists to understand more about the inner workings of the volcano which had its last major explosive eruption 3,600 years ago, burying the islands of Santorini under metres of pumice. However, it still does not provide an answer to the biggest question of all: ‘when will the volcano next erupt?’ A report of the research appears in this week’s Nature Geoscience. In January 2011, a series of small earthquakes began beneath the islands of Santorini. Most were so small they could only be detected with sensitive seismometers but it was the first sign of activity beneath the volcano to be detected for 25 years. Following the earthquakes Michelle Parks, an Oxford University DPhil student, spotted signs of movement of the Earth’s surface on Santorini in satellite radar images. Oxford University undergraduate students then helped researchers complete a new survey of the island. Michelle Parks of Oxford University’s Department of Earth Sciences, an author of the paper, said: ‘During my field visits to Santorini in 2011, it became apparent that many of the locals were aware of a change in the behaviour of their volcano. The tour guides, who visit the volcano several times a day, would update me on changes in the amount of strong smelling gas being released from the summit, or changes in the colour of the water in some of the bays around the islands. On one particular day in April 2011, two guides told me they had felt an earthquake while they were on the volcano and that the motion of the ground had actually made them jump. Locals working in restaurants on the main island of Thera became aware of the increase in earthquake activity due to the vibration and clinking of glasses in their bars.’ Ads by Google Ground Penetrating Radar – Nationwide Ground Penetrating Radar Service – http://www.nationalgpr.com Dr Juliet Biggs of Bristol University, also an author of the paper, said: ‘People were obviously aware that something was happening to the volcano, but it wasn’t until we saw the changes in the GPS, and the uplift on the radar images that we really knew that molten rock was being injected at such a shallow level beneath the volcano. Many volcanologists study the rocks produced by old eruptions to understand what happened in the past, so it’s exciting to use cutting-edge satellite technology to link that to what’s going on in the volcanic plumbing system right now.’ Professor David Pyle of Oxford University’s Department of Earth Sciences, an author of the paper, said: ‘For me, the challenge of this project is to understand how the information on how the volcano is behaving right now can be squared with what we thought we knew about the volcano, based on the studies of both recent and ancient eruptions. There are very few volcanoes where we have such detailed information about their past history.’ The team calculate that the amount of molten rock that has arrived beneath Santorini in the past year is the equivalent of about 10-20 years growth of the volcano. But this does not mean that an eruption is about to happen: in fact the rate of earthquake activity has dropped off in the past few months. More information: A report of this research, entitled ‘Evolution of Santorini Volcano dominated by episodic and rapid fluxes of melt from depth’, is published in the journal Nature Geosience on Sunday 09 September. DOI: 10.1038/ngeo1562 Journal reference: Nature Geoscience search and more info website Provided by Oxford University search and more info website
By Eddie Wrenn
Popular opinion holds that an asteroid struck the Earth 65million years ago, hustling out the Age of Dinosaurs and allowing the mammals – us – to rise.
But new research now paints another picture – with the University of Washington indicating that a separate extinction came shortly first, triggered by volcanic eruptions that warmed the planet and killed life on the ocean floor.
They suggest that by the time of the asteroid impact, life on the seafloor – mostly species of clams and snails – was already perishing, because of the effects of huge volcanic eruptions on the Deccan Plateau, in what is now India.
Round 1: An underwater volcano erupts near Tonga in 2009 – perhaps a reminder of an extinction more than 65million years ago
Round 2: An artist’s impression of how the six-mile wide asteroid might have looked as it ploughed into our world, decimating life on the surface
The well-known dinosaur extinction event is believed to have been triggered by an asteroid at least six miles in diameter slamming into Mexico’s Yucatán Peninsula.
Thomas Tobin, a UW doctoral student in Earth and space sciences, said: ‘The eruptions started 300,000 to 200,000 years before the impact, and they may have lasted 100,000 years.’
During the earlier extinction it was primarily life on the ocean floor that died, in contrast to the later extinction triggered by the asteroid impact, which appeared to kill many more free-swimming species.
The eruptions would have filled the atmosphere with fine particles, or aerosols, that initially cooled the planet.
But, more importantly, the eruptions also would have spewed carbon dioxide and other greenhouse gases to produce long-term warming that led to the first of the two mass extinctions.
Thomas Tobin clears sand from around the fossil of a giant ammonite he found in 2009 on James Ross Island in Antarctica
Thomas Tobin clears sand from around the fossil of a giant ammonite he found in 2009 on James Ross Island in Antarctica
Tobin said: ‘The aerosols are active on a year to 10-year time scale, while the carbon dioxide has effects on a scale of hundreds to tens of thousands of years.
‘The species in the first event are extinct but the groups are all recognisable things you could find around on a beach today,’ he said.
Tobin is the lead author of a paper in the journal Palaeogeography, Palaeoclimatology, Palaeoecology that documents results of research conducted in a fossil-rich area on Seymour Island, off the Antarctic Peninsula.
That particular area has very thick sediment deposits and, for a given interval of time, might contain 10 times more sediment as the well-known Hell Creek Formation in Montana. That means scientists have much greater detail as they try to determine what was happening at the time, Tobin said.
The researchers took small surface core samples from rocks and fossils in the Antarctic sediment and used a method called magnetostratigraphy, employing known changes over time in Earth’s magnetic field to determine when the fossils were deposited. The thicker sediment allowed dating to be done more precisely.
‘I think the evidence we have from this location is indicative of two separate events, and also indicates that warming took place,’ Tobin said.
There is no direct evidence yet that the first extinction event had any effect on the second, but Tobin believes it is possible that surviving species from the first event were compromised enough that they were unable to survive the long-term environmental effects of the asteroid impact.
‘It seems improbable to me that they are completely independent events,’ he added.
The San Cristobal volcano in Nicaragua rumbled to life Saturday with three explosions, forcing the evacuation of 3,000 residents, authorities said. Television footage showed a column of smoke and ash rising from the cone of the volcano, Nicaragua’s tallest at 1,745 meters (5,725 feet), in the northeast. The civil defense agency said it readied 50 trucks and 350 troops to support the population in case of greater emergency, while the Nicaraguan Institute of Territorial Studies, or INETER, added they expect “more gas emissions and sporadic explosions.” There are some hamlets perched on the slopes of the volcano, and winds could push the fumes from the eruption there, said the director of the national disaster prevention and mitigation agency, William Gonzalez. He said authorities ordered some 3,000 people living in villages in that zone to evacuate. Ashes fell on the towns of El Viejo, El Chonco, Villa 15 de Julio and Rancheria, according to a statement by INETER, which monitors volcanic activity. San Cristobal, located 135 kilometers (83 miles) northwest of Managua, is one of the country’s most active volcanoes. Since Thursday, when an earthquake of 7.6-magnitude rocked neighboring Costa Rica and was also felt in Nicaragua, INETER began surveillance at several active volcanoes, fearing the powerful quake would have an “impact on the activation” on the volcanoes. Rosario Murillo, the first lady and government spokeswoman, said some US experts have noted that the ash plume reaches 5,000 meters, which could be an indicator of potential for greater activity.
Nicaragua has begun evacuating around 3,000 people after the countryâs largest volcano, San Cristobal, which is located along its Pacific coast, started to erupt with vehemence. Authorities have so far pointed to no immediate reports of injuries or damage, but the government has issued a yellow alert in a sign that emergency plans had been activated following the eruption on Saturday of the volcano, located about 154 kilometers (95 miles) north of the capital Managua, Reuters reported. The volcano has let out an ash plume of up to five kilometers (three miles), which has formed a cloud extending 48 kilometers (30 miles). Firefighter Sergeant Fernando Quintero said, “At this stage, we try to evacuate the people, who are in the neighboring areas, but most resist being evacuated.” The Nicaraguan Institute of Territorial Studies noted in a preliminary report that “more gas emissions and sporadic explosionsâ could be expected from San Cristobal, and said in its monthly bulletin that the volcano has emitted “abundant gases in a constant manner.”
Kazakhstan’s wheat farmers have suffered from drought affecting grain production with a drop to more than half. An exceptionally dry summer has yielded a miserable harvest amounting to the loss of 600,000 hectares, according to figures. Al Jazeera’s Robin Forestier-Walker reports from the Kostanay region on Kazakhstan’s northern border with Russia.
More than 3,500 people have been evacuated, at least one building has been destroyed and local states of emergency have been declared in several southern Alberta communities Monday as two huge grass fires are being fueled by powerful winds. The first fire, which officials believe started on the Blood Reserve, near Lethbridge, about 220 kilometres southeast of Calgary, jumped the Oldman River. A second wildfire has now forced the evacuation of Milk River, which is southeast of Lethbridge. A sudden drastic change in winds has pushed about 800 residents to seek refuges in Raymond, to the north, after first being told by officials to flee south, to Coutts, at the U.S. border. That first blaze sparked the evacuation of the nearby town of Coalhurst, where about 500 homes are in the path of the swift-moving fire. Residents had been told to seek refuge to the north along Highway 25 at the Picture Butte Community Centre, but the roadway quickly became clogged with traffic making the escape route slow-going and then, it was closed when “people gawking” at the smoke caused a head-on collision, according to Lethbridge County Reeve Lorne Hickey.
Between 300 and 400 residents of Mountain Meadows and Sunsets Acres as well as Township 8-22 in his county have also been told to get out. Lethbridge Deputy Fire Chief Wayne Johnson said the city and county is throwing every emergency worker at the fire and has called in off-duty firefighters to help. Fire breaks are being dug to try to contain the blaze. While the city of Lethbridge is under a state of emergency, residents in the neighbourhoods of Indian Battle Heights, Heritage Heights and West Highlands are being told to prepare for possible evacuation. A mandatory evacuation ordered was order for the Westside Trailer Court. Affected residents are being told to go to the Fritz Sick Centre or the ENMAX Centre. City officials also told residents to stay off their cell phones to “keep lines clear for emergency services.” In some cases, residents had only minutes to get out. Others are now preparing to leave.
A rapidly spreading wildfire has burned at least six structures and forced some 400 people to be evacuated from Casper Mountain. Wyoming State Forester Bill Crapser says still more buildings may have been lost to the Sheep Herder Hill Fire about 10 miles southeast of the Casper city limits. The fire began Sunday afternoon and winds quickly fanned the blaze to more than seven square miles. About 150 homes and cabins remain evacuated Monday. Crapser estimates about three-quarters are year-round homes and the rest are seasonal cabins. Nine families that fled are staying at the Parkway Plaza Hotel in Casper. The Red Cross says it may open a shelter for evacuees. Dry, windy weather has prompted the National Weather Service to put all of Wyoming under a wildfire alert.
10.09.2012
Forest / Wild Fire
Russia [Asia]
Tomsk Oblast, [Districts of Verkhneketsky, Parabelsky, Barguzinsky ]
Five forest fires had been raging in Siberia as of Monday morning, the Siberian Federal District Forestry Department said. The fires are 62 hectares in size; the largest of them (44 hectares) in the Verkhneketsky district of the Tomsk region has been confined. There are also fires in the Barguzinsky district of Buryatia, the Parabelsky district of the Tomsk region and the Krasnoyarsk territory. Fires were burning on nine hectares in Siberia on Friday. The fire zone grew 6.9 times by Monday morning. Forest guards had put out 12 forest fires on 22 hectares by Monday. One hundred and twenty-seven people, 39 fire trucks and two aircraft extinguished the fires. “There is no threat to residential areas or economic sites,” the department said.
11.09.2012
Forest / Wild Fire
Canada
Province of British Columbia, [Peachland region (Trepanier Forest Fire)]
More than 900 residents of Peachland, B.C., were forced to flee their homes and hundreds of others were on alert when a forest fire spread through the Okanagan town Sunday. A state of emergency was declared and an evacuation order and alert were put in place by Sunday evening after the Trepanier Forest Fire broke out about 3 p.m. Kari O’Rourke, public information officer with the Emergency Operations Centre, said 593 homes, equating to 950 people in Peachland and the Trepanier Bench area were put on evacuation order, and 375 houses, or 600 residents, south of the Trepanier area were put on alert, including the Ponderosa Golf Club. Under the evacuation alert, residents were told to prepare to leave their homes with little notice should the fire threat increase. Hwy. 97 was closed at Princeton Rd. in Peachland and at Glenrosa Rd. in West Kelowna. Residents affected by the fire were asked to report to the Emergency Support Services Reception Centre set up at the Westbank Lions Community Hall, 2466 Main St. in West Kelowna, B.C. A second reception centre was opened at the Summerland Arena and Curling Club, 8820 Jubilee Road East. Crews from B.C. Wildfire Management, Kelowna and West Kelowna, Peachland were still fighting the flames as of Sunday night but were unsure of what caused the massive blaze. O’Rourke said it was not known how large the fire was as of press time.
A wildfire had burned at least 800 acres southeast of Dayton on Sunday as crews worked to keep the flames from threatening homes or structures. Containment is expected Tuesday, Sierra Front reports. The fire was in the Brunswick Canyon area east of Carson City on the boundary with Lyon County Crews were attacking the fire from the air and on the ground, dispatcher Charlie Peters of the Sierra Front fire responders said. Firefighters were called just after noon Sunday to Mount Como, after sagebrush, pinion and juniper were ablaze, Peters said. Officials were concerned that gusty winds could cause the flames to spread. Communication towers and power lines are in the area. NV Energy also was on the scene. The fire on federal land was being attacked by the U.S. Forest Service and Nevada Division of Forestry. Two helicopters, five air tankers, two water tenders, four hand crews and five fire engines are assigned to the fire.
Internet users say authorities’ incompetence to blame, at least in part
By Jack Phillips
Epoch Times Staff Created
Flooding leaves many vehicles submerged in water in a residential community in Beijing on July 21. (The Epoch Times Photo Archive)
Some of the worst flooding to hit Beijing in decades left at least 37 people dead and forced more than 30,000 residents to flee, state-run media reported, citing local authorities on Sunday. The number of deaths officially sits at 37, but numbers in China are often political and are likely to not reflect the full toll.
The floods, which state media said were the worst in six decades, came on Saturday afternoon and lasted into the night, leaving 80,000 people stranded as over 500 flights were canceled.
Around 6.7 inches of rain on average fell on Beijing by 6 a.m., but some areas fared worse than others. In suburban Hebei township, 18.1 inches fell. In six townships, Internet access and mobile communication was cut, while train services between Beijing and Guangzhou were shut down because railway sections were inundated.
A lightning strike killed a person, and the head of the police bureau in Fangshan district was shocked by a downed electric wire.
Four people were killed in Shuozhou city in northern Shanxi Province when floods carried their truck into the middle of a river while attempting to cross it. Six people were left dead in southwestern Sichuan Province in rain-caused landslides. Seven counties said they received more than 3.9 inches of rain.
Photos uploaded to the popular Sina Weibo microblogging website showed numerous instances of flooding in Beijing. One showed several dozen men pulling a rope in a tug-of-war fashion, in an attempt to drag out five cars and trying to help one man who was drowning.
One user on Weibo said that some of the figures released by state media, which said that 10 people were killed, may not be correct. The user said that “certainly far more than 10 people” were killed in the floods.
Other posts on the microblogging site blamed local officials for not doing enough to mitigate the disaster and said the city’s draining systems and roads have a problem.
“Lang,” a Weibo user, said that the roads were poorly designed because they could only hold “50 millimeters (1.9 inches) of rainfall,” while Beijing authorities only blame the disaster on “acts of God” rather than admitting that the roads and the city’s infrastructure have problems.
“Bad engineering, corruption, and incompetence forced people to suffer” during the floods, said user “Not to V.”
Another user sarcastically said, “We hoped [authorities] could have established a drainage system that is as effective as deleting the words they dislike,” referring to China’s censorship policy on the Internet.
One user, “Han Zhiguo” said the floods showed that there were “two totally different sides of Beijing,” saying that kind-hearted people spontaneously rescued thousands of people and even provided shelter locations, but the local government provided no shelter locations including hotels or officials buildings.
Even worse, the user said, “toll stations still paid close attention and collected the charges and traffic cops posted tickets on flooded vehicles,” accusing the city’s management of being “inhumane.”
Nova Scotia was pummelled with rain Monday, with upwards of 75 millimetres falling in the central part of the province washing out roads, stranding residents and causing dozens of families to leave their homes. While the rain was letting up Monday evening in the Truro area, it’s just beginning in Cape Breton, according to Peter Coade, CBC’s meteorologist. Upwards of 125 millimetres is expected in Cape Breton overnight. While water levels were receding in central Nova Scotia later Monday evening, officials are watching high tide closely, which began around 9 p.m. AT. In the Indian Brook First Nation, near Shubenacadie, 135 people are stranded as Monday’s heavy rain washed out the two access roads to their community. Forecasters with the Canadian Hurricane Centre said Monday’s rainstorm was not due to tropical storm Leslie — the current storm is blocking Leslie’s progression. Leslie is expected to head for Newfoundland Tuesday morning. Chris Fogarty said the weather would likely get worse overnight as the two systems converge, with Cape Breton getting the highest winds and heaviest rain. Donna Munro, who lives in North River near Truro, was paddled to safety by a neighbour in a canoe as the area around her home flooded with about 1.5 metres of water. Munro said she and her son stepped onto the doorstep and the doorstep started separating from the front of the house. Her son got to safety and she was rescued a short time later by a neighbour with a canoe. “The force of the water, when the tide came in, is what I think really elevated everything on top of all the rain we had too. It just all added to it like a snowball effect,” she said. “It was the force and the viciousness of it, I think, that just sped it along that much quicker.”
Roads and bridges will be inspected by engineers from the Department of Transportation and Infrastructure Renewal as quickly as possible, he said. Motorists should continue to use caution and watch for closed roads and water on roads, according to the provincial release. The Canadian Red Cross has set up two reception centres for area residents who have been displaced by the storm: at the Bible Hill Village Fire Hall at 69 Pictou Rd. and the Immanuel Baptist Church at 295 Young St. However, the reception centres are not serving as shelters at the moment, according to Mona O’Brien, district community supervisor for the Canadian Red Cross in Truro. The flooding in central Nova Scotia Monday posed some concern in the Salmon River area, according to the Emergency Management Office. Water levels are on the decline in some areas, but the area isn’t in the clear yet. “The water has subsided quite a bit in the North River and the Salmon River,” according to Bob Taylor, mayor of the municipality of Colchester. “Having said that, there’s still a lot of water from the uplands, also we don’t know how much the tide is going to affect us.” People are being asked to stay away from flooding areas because of the high tide.
A new round of torrential rains that started Sunday night inundated parts of Southwest China’s Sichuan province, leaving six people dead and four missing, local authorities said Monday. The victims were reported in the cities of Guangyuan and Suining, the Sichuan provincial flood control office said in a statement. Rainstorms continued into Monday night and a township in Shehong county of Suining reported the largest precipitation of 257.3 mm in just six hours Monday, it said. The rains also left parts of the county seats of Daying and Shehong in Suining submerged under waters of up to two meters deep. The rains are forecast to last till 8 am Wednesday, according to the provincial meteorological center.
10.09.2012
Flash Flood
Pakistan
MultiStates, [States of Punjab and North West Frontier]
At least 78 people died and dozens were injured as torrential rains and flash floods wreaked havoc in Pakistan over the past three days, a government spokesman said Monday. Heavy monsoon rains which began falling last week destroyed more than 1,600 houses while damaging a further 5,000, Irshad Bhatti, a spokesman for the country’s National Disaster Management Authority (NDMA) reported. “A total of 78 people have died and 68 injured in rains and flash floods in the country so far,” he said, adding that the casualties were caused mostly by houses collapsing and people being caught in floods. The worst-hit region was Khyber Pakhtunkhwa province where 32 people have died and 26 were injured in several districts, he said, adding that 83 houses were totally destroyed and another 4,200 were partially damaged, he said. In the northwestern district of Swabi eight Afghan refugees were killed when the roof of their mud house collapsed overnight, police official Mohammad Ali said. The dead, who were members of the same family, included two women and six children aged between one and 12 years he said. In Pakistan-administered Kashmir, flash flood killed at least 31 people, Bhatti said. Rains killed at least 26 people in that region last month. A state of emergency, meanwhile has been declared in the Dera Ghazi Khan and Rajanpur districts of the Punjab province, where army troops have been called to join rescue work, local administration officials aid. Weather officials predict heavy rain in the next two days in southern Sindh and Baluchistan provinces. Rescue teams are closely monitoring the situation, Bhatti said. Floods in Pakistan in the summer of 2011 affected 5.8 million people, with flood waters killing livestock, destroying crops, homes and infrastructure as the nation struggled to recover from record inundations the previous year.
Thunderstorms struck parts of the north and west Valley Sunday evening, and forecasters at the National Weather Service said there was a chance of more rain overnight. Charlotte Dewey, a meteorologist at the Weather Service’s Phoenix office, said two storm systems — one starting near Circle City, northwest of Phoenix, and the other near North Mountain Park — moved on a northwest trajectory. Those storms began diminishing at about 8 p.m., but forecasters called for a 30 percent chance of measurable rain in the metro area overnight. The temperature on Sunday hit a high of 93 degrees at about 3:50 p.m. The chance of thunderstorms on Monday was 50 percent, according to the Weather Service’s website. Those odds grow to 60 percent going into Monday night and on Tuesday. Weather experts predicted Monday’s high to hit 94 degrees, and Tuesday’s predicted high is 92 degrees. Rain chances decrease later in the week and Thursday is expected to be sunny with a high of 95 degrees, according to the Weather Service’s website. The Weather Service reported flash floods in the northwest and southwest ends of the state Sunday. Mike Bruce, a meteorologist, said blowing dust and wind, downed power lines and street flooding was reported in the Yuma area.
The strongest wind gust was reported to be 65 miles an hour at the Yuma International Airport, Bruce said. Jose Guerrero, a Yuma resident living near Interstate 8 and 16th Street, said he did not see much rain but the gusting wind knocked down some neighbors’ patio furniture. Clay Morgan, a meteorologist at the National Weather Service in Las Vegas, said his office got reports of several flooded and impassible roads in Golden Valley, a town just west of Kingman. The water was reported to be as high as 2 feet in some areas. The agency had issued a flash flood watch at about 3:45 p.m. Sunday. Santana Madrid, an employe at a Subway restaurant at Marana Road and State Route 68 in Golden Valley, said his tires were nearly submerged driving into work Sunday evening. Madrid said some the dirt roads in the town got it the worst. Morgan said the reason for the flooding was due to washes that flow northeast-southwest through the town. Morgan said flash-flood watches remained in effect for the area Monday and Monday night as the storm system currently buffeting Yuma makes its way north.
Officials say landslides and flooding caused by heavy rains have killed 29 people and left four missing in northern and central Vietnam. Disaster official Ngo Van Hung of northern Yen Bai province said Monday that 16 villagers from the mostly poor Hmong ethnic minority group died in a landslide while they were illegally collecting tin ore from a mine operated by a private company. Authorities are searching for two other people missing from Friday’s incident, he added. The government disaster agency says flooding killed another 13 people and left two missing in central Vietnam over the past week. The agency says on its website that flooding caused by heavy rains has caused an estimated $22 million in damage to rice crops and infrastructure.
On 9 Sep 2012, I measured radiation at Tomioka-Naraha, Border, of Fukushima prefecture Japan.
I monitored 0.86 micro Sievert per hour in air at chest hight, 26.33 on road side dust.
The monitorinig place is 16km (10 miles) from Fukushima Daiichi Nuclear power plant.
Along the national road route 6, No Entory barricade for Fukushima Daiich nuclear power plant.
Young policemen sent from a west region of Japan are guarding this place standing outside for long hours, only wearing “family use” masks.
This Route-6 barricade has been moved 6km (4 miles) closer to Fukushima Daiich since Aug of 2012. They, the young policemen also have been faced to higher risk of internal exposure.
The map shown in the video is from “Radiation counter map of the Fukushima Daiich accident, the 7th edition” by Prof. Yukio HAYAKAWA of Gunma university, Japan.
Measuring instrument is made of Ukraine, ECOTEST MKS-05.
26.33μSv/h 富岡-楢葉町境 国道6号通行止地点 路上砂 2012.9.9
TEPCO announced on September 6 that it was likely that the shavings from the polyethylene pipes were clogging up the valves and pipes and causing the amounts of water injected into the reactors at Fukushima I Nuclear Power Plant to fall below the necessary amounts for cooling.
TEPCO had hinted at the possibility of metal rust clogging the pipes. However, the company thought it important that the problem started to happen after August 30, when the 2.7-kilometer pipes that transport the treated water to the cooling tanks were switched from polyvinyl chloride pipes [probably Kanaflex] to polyethylene pipes (15 centimeter in diameter). The shavings are considered to have been generated when the pipes were being cut. White substances that looks like the shavings have been found inside the [buffer] tank and on the filter of the cooling equipment.
If it is true, I don’t know what to say, other than that TEPCO is fast running out of money and quality subcontractors. This is decidedly not the “nuclear plant” spec.
Exactly one and a half year since the start of the nuclear accident on March 11, 2011, this is where Japan stands. All the lip service to “protecting children” or “children are our future” is, well, lip service.
The mayor of a big city in Kanagawa Prefecture declares eating food containing radioactive cesium in the school lunches is part of children’s education. A large city in Fukushima Prefecture in the highly contaminated Nakadori (middle third) refuses to install air conditioning systems in the city’s public schools because children should not miss the opportunity to learn about global warming. A city in Tokyo has just started feeding children with milk from Fukushima for their school lunch program. A professor in a college in Shizuoka Prefecture with the PhD in tourism sends her students to Fukushima to buy Fukushima produce and goods to dispel “baseless rumors”.
It is worse than the worst that Professor Kunihiko Takeda of Chubu University feared exactly a year ago, with his short poetic prose titled “A girl doesn’t talk“; he pleaded with teachers and educators to do all they could to protect children. His plea has fallen on totally deaf ears, and here we are. This has got to be the end.
First, for Takao Abe, Mayor of Kawasaki City in Kanagawa Prefecture, making children eat food that has been proven to contain radioactive cesium of Fukushima origin is nothing but highly educational, and the parents should just shut up (Tokyo Shinbun 9/5/2012):
Mayor Takao Abe said during the regular press conference on September 4 that it was important for children to learn that they were living in dangers, and that he would continue to use the frozen oranges from Kanagawa and canned apples from Yamagata that were found with radioactive cesium in the school lunches in the elementary schools in Kawasaki City, emphasizing the educational aspect of using food [known to be contaminated with radioactive cesium].
According to the city’s inspection, 9.1 Bq/kg of radioactive cesium was found in the frozen oranges [from Kanagawa], and 1.6 Bq/kg in the canned apple [from Aomori]. However, since the levels are below the national safety limit (100 Bq/kg) the city has been serving the frozen oranges in the school lunches since April this year. The city will start using the canned apple in September.
When asked about Yokohama City and Kamakura City not using the frozen oranges, Mayor Abe responded, “It is a mistake to teach children to be afraid of such a trivial level [of radioactive cesium].” He further commented, “On the road, there is a danger of being hit by a car. A total stranger may stab you. Do you teach children not to walk past a stranger?”
There are parents who are not convinced, but to them, the mayor said, “Don’t be a chicken.”
Mayor Abe was born and raised in Fukushima, by the way. But that has nothing to do with anything, right?
Koriyama City in high-radiation Nakadori of Fukushima Prefecture refused to install air conditioning systems in the city’s schools because it was important for children to suffer to learn about “ecology” (tweet from one of my followers, about an NHK program on the topic):
They don’t allow installation of air conditioning systems in schools in Koriyama City. It was talked about in the meeting with TEPCO in June. The city’s Board of Education also said [to the parents], “We want children to learn ecology.” From the video. The Koriyama City Assembly, TEPCO, and Board of Education all turned down the petition from the parents who worried about their children in the radiation contamination and the severe heat of the summer.
When the Japanese say “ecology“, all they mean is “energy-saving to prevent global warming“. Global warming.
Then, it is more important for Fuchu City in western Tokyo to help Fukushima recover from the “baseless rumors” than protecting children from potentially contaminated food; or good deal with a major milk supplier (Snow Brand Megmilk) cannot be ditched (the link goes to a page with the handout from the Board of Education). The latter, more likely. So, starting September 10, Fuchu City’s milk from Snow Brand Megmilk will contain milk from Fukushima, in addition to Kanagawa, Chiba, Tochigi, Gunma, Iwate, Miyagi, Yamagata, Aomori. In for a penny, in for a pound, or literally, “Eat poison, lick the platter that serves the poison”.
And lastly, Professor Akane Okubo got her PhD in tourism (I never heard of such a thing until I checked her bio), and teaches at Fuji Tokoha University in Shizuoka Prefecture while she continue to work for the research institute of Japan Travel Bureau (JTB), one of the largest tour operators in Japan. In the past, she worked for another tourism outfit (Jalan). How does she educate her students? By sending them off to Fukushima to buy up produce and goods in Fukushima to counter “baseless rumors”. She must have gotten a lucrative grant from the national government for her “research”. From Yomiuri Shinbun (9/10/2012):
Professor Okubo said, “It is important for the student to listen to the local people and to think about what they can do. We would like to do any small thing to help dispel baseless rumors.”
Now that’s unintentionally funny. “Japanese university students” and “think” clearly don’t go together.
The pace of descending into deeper and deeper lunacy seems to be accelerating in Japan. Maybe this is what people must have felt like in the 1930s, right before the last world war.
HANOI: A new highly-toxic strain of the potentially deadly bird flu virus has appeared in Vietnam and is spreading fast, according to state media reports.
The strain appeared to be a mutation of the H5N1 virus which swept through the country’s poultry flocks last year, forcing mass culls of birds in affected areas, according to agriculture officials.
The new virus “is quickly spreading and this is the big concern of the government”, Deputy Minister of Agriculture and Rural Development Diep Kinh Tan said, according to a Thursday report in the VietnamNet online newspaper.
Experts cited in the report said the new virus appeared in July and had spread through Vietnam’s northern and central regions in August.
Outbreaks have been detected in six provinces so far and some 180,000 birds have been culled, the Animal Health department said.
The Central Veterinary Diagnosis Center said the virus appeared similar to the standard strains of bird flu but was more toxic.The center will test how much protection existing vaccines for humans offer, the report said.
Some experts suggested that the new strain resulted from widespread smuggling of poultry from China into the northern parts of Vietnam.
According to the World Health Organization, Vietnam has recorded one of the highest numbers of fatalities from bird flu in southeast Asia, with at least 59 deaths since 2003.
The avian influenza virus has killed more than 330 people around the world, and scientists fear it could mutate into a form readily transmissible between humans, with the potential to cause millions of deaths. — AFP
Today
Epidemic Hazard
China
Hong Kong Special Administrative Region, Hong Kong [Chai Wan District]
A rare superbug first linked to travel to India has been found in a 78-year-old Burmese man who died of pneumonia, the Centre for Health Protection revealed yesterday. The man, a Hong Kong resident who lived in Eastern District, died on Friday 10 days after being admitted to Pamela Youde Nethersole Eastern Hospital, Chai Wan, with fever, shortness of breath and a cough. His urine specimen tested positive for NDM-1, in reference to New Delhi. The man visited Burma from March 21 to June 24 and was treated there for an infection. A center spokesman said NDM is an enzyme, which can inactivate antibiotics carbapenems and other beta-lactams such as penicillin. The case was the 11th detected here since a worldwide health alert was sounded in 2008. The first fatality was recorded two years later. The spokesman said proper use of antibiotics and personal hygiene, especially hand cleansing, are required to prevent contagion. Meanwhile, the center has warned travelers to Sichuan province of a bubonic plague outbreak. It received notification from the Ministry of Health yesterday that three villagers in Ganzizhou ate a dead marmot on September 2. One of them suffered painful swelling to the lymph nodes two days later and died on Friday. The provincial health authority confirmed the case as bubonic plague and has traced 59 close contacts. None, including the other two villagers who ate the animal, has shown symptoms. Plague is transmitted from infected animals, mainly rodents, to man through the bite of a flea from an infected animal. Humans may also contract plague when cuts or other breaks in their skin come into contact with the body fluid or tissue of infected animals. The center spokesman reminded travelers to avoid visiting plague- endemic areas. Those who need to visit such areas should be vigilant, wear long-sleeved shirts and trousers to avoid being bitten by fleas and apply insect repellent.
Biohazard name:
Metallo-beta-lactamase-1 (NDM-1)
Biohazard level:
3/4 Hight
Biohazard desc.:
Bacteria and viruses that can cause severe to fatal disease in humans, but for which vaccines or other treatments exist, such as anthrax, West Nile virus, Venezuelan equine encephalitis, SARS virus, variola virus (smallpox), tuberculosis, typhus, Rift Valley fever, Rocky Mountain spotted fever, yellow fever, and malaria. Among parasites Plasmodium falciparum, which causes Malaria, and Trypanosoma cruzi, which causes trypanosomiasis, also come under this level.
Symptoms:
Status:
confirmed
Today
Epidemic Hazard
China
Municipality of Shanghai, Shanghai [Changqiao area in Xuhui District]
Over 400 residents in the Changqiao area in Xuhui District received emergency measles shots after a migrant woman from Anhui Province living in the neighborhood was detected with the infectious disease on Monday last week, local news portal eastday.com said yesterday. More than 400 nearby residents received measles shots within four hours. The woman is the first measles case detected in the community this year.
Biohazard name:
Measles
Biohazard level:
2/4 Medium
Biohazard desc.:
Bacteria and viruses that cause only mild disease to humans, or are difficult to contract via aerosol in a lab setting, such as hepatitis A, B, and C, influenza A, Lyme disease, salmonella, mumps, measles, scrapie, dengue fever, and HIV. “Routine diagnostic work with clinical specimens can be done safely at Biosafety Level 2, using Biosafety Level 2 practices and procedures. Research work (including co-cultivation, virus replication studies, or manipulations involving concentrated virus) can be done in a BSL-2 (P2) facility, using BSL-3 practices and procedures. Virus production activities, including virus concentrations, require a BSL-3 (P3) facility and use of BSL-3 practices and procedures”, see Recommended Biosafety Levels for Infectious Agents.
With summer season at its prime, one of Malawi’s border districts, Mwanza, has been hit by chickenpox outbreak which according to health officials has already attacked 100 people. Chickenpox, according to various health journals Nyasa Times accessed, is a contagious viral infection in which a person develops extremely itchy blisters all over the body. It used to be one of the classic childhood diseases before the introduction of the chickenpox vaccine. Mwanza district health office spokesperson Taonga Kasomekera told private owned radio Zodiak that the situation is serious as over 100 people have already been given treatment. The situation is under control and as we are speaking our medical team is on the ground administering medical treatment,” said Kasomekera. Meanwhile, the development according to Kasomekera has affected the official opening of some schools in the district. Malawi school calendar got underway on September 3. He added that this is the case because the disease is spread easily to others through coughing or sneezing as well as touching fluids from the blisters. Moses Jumbe a teachers at Matope primary school said that District Education Manager for Neno Reuben Menyere has since advised the Primary Education Advisors for the area not to open the schools for the new term for new term following the out break. “Chickenpox can be spread very easily to others. You may get chickenpox from touching the fluids from a chickenpox blister, or if someone with the disease coughs or sneezes near you. Even those with mild illness may be contagious,” said Kasomekera. Added he: “A person with chickenpox becomes contagious 1 to 2 days before their blisters appear. They remain contagious until all the blisters have crusted over. So I guess that is the reason why some schools especially in most affected areas have not commenced classes.” The disease, according to information Nyasa Times sourced on World Health Organization (WHO) website, mostly occurs in children younger than 10. However, it becomes more deadly when it attacks older children as they get sicker than kids.
Biohazard name:
Chickenpox
Biohazard level:
2/4 Medium
Biohazard desc.:
Bacteria and viruses that cause only mild disease to humans, or are difficult to contract via aerosol in a lab setting, such as hepatitis A, B, and C, influenza A, Lyme disease, salmonella, mumps, measles, scrapie, dengue fever, and HIV. “Routine diagnostic work with clinical specimens can be done safely at Biosafety Level 2, using Biosafety Level 2 practices and procedures. Research work (including co-cultivation, virus replication studies, or manipulations involving concentrated virus) can be done in a BSL-2 (P2) facility, using BSL-3 practices and procedures. Virus production activities, including virus concentrations, require a BSL-3 (P3) facility and use of BSL-3 practices and procedures”, see Recommended Biosafety Levels for Infectious Agents.
Heavy rains washed away a culvert at Takav in Chelavali region of Palghar taluka as people residing near rivers and creeks here shifted to safer locations, the district control room said.
Meanwhile, geological experts visited Jawhar on Monday to study so called ‘tremors’ in the
area and submit their report to the collector directly.The Thane district additional collector Ashok Shingare told PTI that told this correspondent that the intensity of loud sounds were on the rise causing concern among citizens.
Seismologists from IMB Mumbai and Pune as well other experts will also be visiting Jawhar on Tuesday to study the situation, he said.
For the past ten days, Jawhar town’s residents have been running out of their houses after hearing mysterious loud sounds like ‘tremors’ throughout the day on Monday.
The Jawhar municipal council also announced that there was no cause for fear and people should not panic, after they complained of their cots, vessels and even the walls, windows, tables and chairs shaking badly due to ‘tremors’, though walls have not developed any cracks.
The Nationalist Congress Party’s (NCP) state unit secretary Advocate Rajaram Mukne told PTI that there were at least seven ‘tremors’ accompanies by loud sounds.
Jawhar MLA Chintaman Wanga who represents the area also told PTI that locals are of the opinion that these were ‘tremors’.
The North Bay Parry Sound District Health Unit is advising all cottagers and visitors at the Goose Islands in Lake Nipissing that a bloom of blue-green algae has been detected at latitude 46.1539 N, longitude 79.4350 W. Sample results indicate that this bloom is toxin producing, and the bacteria toxin concentration is above the limit for drinking water.
Biohazard name:
Blue-Green (cyanobacteria) Algae bloom
Biohazard level:
0/4 —
Biohazard desc.:
This does not included biological hazard category.
Symptoms:
Status:
………………………………..
Today
Environment Pollution
USA
State of Washington, Richland [Hanford Nuclear Reservation]
The Department of Energy has found evidence that a tank at the Hanford Nuclear Reservation maybe leaking radioactive material. More unknown material has been found in a third place between the two shells of Tank AY-102, which went into use in 1971. A photo taken of the same spot in 2006 shows that the area was clean then. The finding this week of a third spot increases concerns that the tank, one of Hanford’s 28 double shell tanks, has a leak from its inner shell. The tanks are needed to hold high level radioactive waste for up to 40 more years until the last of the waste can be treated for disposal. Tank AY-102 has a capacity of about 1 million gallons but currently stores about 707,000 gallons of liquid waste and 151,00 gallons of waste sludge.
As many as 42 persons, including 38 children of Government High School at Benkatti in Saundatti taluk of Belgaum district were hospitalized due to suspected water poisoning on Monday. The affected included a teacher, a peon and two workers. The condition of all the affected persons is stable and out of danger, Deputy Director of Public Instruction Diwakar Shetty said. Mr. Diwakar Shetty said that children and staff of the school complained of stomach ache and vomiting after consuming water. He suspected that someone had poured about 2 litres of endosulfan into the overhead water tank, thus poisoning the water. Of the victims, 14 were shifted to the government hospital in Saundatti town and 28 were shifted to the district government hospital in Belgaum city. Block Education Officer Srishail Karikatti rushed to the spot and collected water samples to send it for testing. He lodged a complaint with the local police station. The police are investigating. To a question, Mr. Shetty said there was no immediate history of the school staff or members of the School Development and Monitoring Committee having any dispute with anybody.
Power failed across a large swath of western Cuba on Sunday night, plunging millions of people into darkness including those in the capital of Havana and at the popular bearch resort of Varadero. The outage knocked out air-conditioning units and electric fans on a sweltering late-summer Caribbean night. Other cities in central and eastern Cuba also had outages, but for only brief spans. “We were on our balcony waiting for our TV program,” said Richard Laredo, a 47-year-old Havana resident who quickly transferred food from the refrigerator to the freezer. “Nobody knows what happened, but people are worried about what they have in their refrigerators.” There was no immediate word on what caused the blackout, which struck a little after 8 p.m. in the middle of the nightly news on state television and was still out more than two hours later. The lights were back on in at least one eastern Havana suburb after about 2 and half hours. State radio said power was gradually being restored but urged people not to use power-hungry appliances. Calls to the electrical system’s headquarters met busy signals.
Officials in the national government were not immediately able to offer an explanation. In the capital, home to about 2 million people, the lights went out in a 24-mile-wide (40-kilometer) stretch from Havana’s western residential neighborhoods across the city’s center and Old Havana district and on to suburbs on the other side of the bay. In the Vedado entertainment and business district, the only buildings with visible light were tourist hotels and upscale apartment towers, which have backup generators. Problems extended well beyond Havana’s city limits, including in the popular tourist resort of Varadero. “We are on our generators, but our guests are not having any problems,” said a receptionist who answered the phone at the Arenas Doradas hotel in Varadero but would not give her full name. Outages that began at the same time as Havana’s were reported as far away as Santiago, the nation’s second-largest metropolis about 475 miles (740 kilometers) away at the other end of the island. The power in Santiago returned after only a few minutes, however. Electricity was out for about 20 minutes in the central cities of Ciego de Avila and Santa Clara. The western city of Pinar del Rio was also without power.
[In accordance with Title 17 U.S.C. Section 107, this material is distributed without profit, for research and/or educational purposes. This constitutes ‘FAIR USE’ of any such copyrighted material.]
A MODERATELY strong earthquake has hit eastern Indonesia, causing panic among residents, but there were no immediate reports of damage or injuries. No tsunami warning was issued.
The U.S. Geological Survey says the 6.0-magnitude quake struck off the eastern province of Papua. It says it was fairly shallow, just 20 kilometers beneath the sea, which often causes more shaking than deeper quakes.
Witnesses said shocked residents and hotel guests in Nabire town ran outside screaming.
Indonesia has frequent earthquakes because of its location on the Pacific “Ring of Fire,” an arc of volcanoes and fault lines encircling the Pacific Basin.
Video: Moment of deadly China earthquake, landslide caught on
A series of earthquakes hit rural southwestern China on Friday, collapsing homes and triggering landslides. At least 50 people were killed, and the death toll is expected to rise.
08.09.2012
Earthquake
China
Province of Sichuan, [About 51 km NE Zhaotong (affected also Yunnan and Guizhou provinces)]
A shallow earthquake hit southwestern China on Friday, killing at least 24 people, state media said. 150 people were also hurt in the quake that hit Yunnan and Guizhou provinces. An official from the Yunnan provincial government earthquake office, who like many Chinese bureaucrats would not give his name, earlier said 20 people had died. The quake destroyed or damaged 20,000 homes. Buildings in rural areas in China are often constructed poorly. In 2008, a severe earthquake in Sichuan province, just north of Yunnan, killed nearly 90,000 people, with many of the deaths blamed on poorly built buildings, including schools. The U.S. Geological Survey said the magnitude 5.6 quake hit at a depth of 9.8 kilometers (6.1 miles). Shallower earthquakes often cause more damage than deeper ones.
MANAGUA (Reuters) – Nicaragua’s highest volcano belched an ash plume up to 3 miles (5 km) into the atmosphere on Saturday, prompting the evacuation of hundreds of nearby residents.
There were no immediate reports of injuries or damage, authorities said. But the government issued a yellow alert, indicating emergency plans had been activated.
The plume formed a cloud extending 30-miles (48 km) from the 5,725-foot (1,745-meter) San Cristobal volcano, which is about 95 miles (154 km) north of the capital Managua in the country’s volcano-dotted northwest, said the Nicaraguan Institute of Territorial Studies, or Ineter.
Javier Mejia, executive director of Ineter, which monitors seismic and volcanic activity, said he recommended that civil aviation authorities close down the air space near San Cristobal because of the ash plume and cloud, the largest recorded in recent years.
The volcano has long been active, and stirred in mid-2008, when it expelled gas and rumbled with a series of small eruptions. For months it has emitted “abundant gases in a constant manner,” Ineter said in its monthly bulletin.
The government expects to evacuate about 3,000 people from around San Cristobal, though numerous families already have evacuated of their own, said Guillermo Gonzalez, who heads Sinapred, a government emergency and disaster relief agency.
“A response plan exists for volcano eruptions and every community has clearly defined places for people to go to once they are evacuated,” Gonzalez said.
In a preliminary report, Ineter said “more gas emissions and sporadic explosions” could be expected from San Cristobal.
The volcano is one of the most active along Nicaragua’s Pacific coast, according to the institute, and at times averages nearly 100 seismic movements a day.
Government spokeswoman Rosario Murillo earlier said as many as 20,000 people could ultimately be affected.
(Reporting by Ivan Castro; writing by Simon Gardner and Herbert Lash; editing by Will Dunham and Todd Eastham)
Nicaragua’s tallest volcano belched an ash cloud nearly a mile into the atmosphere on Saturday, prompting the evacuation of hundreds of nearby residents who heard explosions emanating from its crater. The 5,725-foot (1,745-meter) San Cristobal volcano, which sits around 95 miles north of the capital Managua in the country’s northwest, has been active in recent years, and stirred in mid-2008, when it expelled gas and rumbled with a series of small eruptions. Government spokeswoman Rosario Murillo said authorities were still assessing the strength of the volcanic activity, and said nearby residents were being evacuated. He said as many as 20,000 people could ultimately be affected by the gas and ash from the volcano.
The Apoyeque Volcano (caldera type volcano), located northwest of the capital, was calm Friday, but officials continued monitoring it for volcanic tremors, a release from the Nicaraguan Institute of Territorial Studies (INETER) said. The agency registered 21 low-intensity volcano-related tremors between Thursday afternoon and Friday morning, prompting the government to issue a green advisory alert. Seismic activity near the volcano, located 10 kilometers northwest of Managua, “decreased Friday morning, but it doesn’t mean that it has disappeared,” INETER Geophysics Director Angélica Munoz told reporters. She also announced that a group of experts will travel to the volcano to investigate the earthquakes causes. The tremors began after a magitude-7.6 earthquake hit neighboring Costa Rica on Wednesday.
NOWATA, Okla. – Authorities say four people — including an infant — have been killed as thunderstorms swept through northeast Oklahoma.
Nowata County Undersheriff Doug Sonenberg tells KSWO-TV (http://www.kswo.com/global/story.asp?s=19489100 ) the infant and two adults were killed Friday when heavy winds destroyed a mobile home. They were found in a creek.
The Oklahoma Highway Patrol also reported that Ash Grove, Mo., resident Jimmy King was killed when straight-line winds flipped the semi he was driving onto a cement barrier wall and trapped him inside near Afton.
Troopers say the 70-year-old King was pinned in the wreckage for nearly three hours and died at the scene of massive injuries.
The storms were part of a system that unleashed winds of 25 mph to 35 mph as it moved through the state.
JACKSON, Miss. – The U.S. Geological Survey mapped the damage caused to Tangipahoa Dam in 3-D earlier this week, using new technology to get a detailed view of the troubled dam. The dam was damaged during heavy rainfall in Hurricane Isaac and caused thousands of people downstream to be evacuated late last week.
Using terrestrial lidar, or T-lidar, the crew captured multiple scans of the dam, including two large landslides on its downstream side. In the larger of the two slides, much of the base of the slide was still underwater and necessitated the use of a kayak-towed acoustic Doppler profiler to measure the toe of the slide.
The first T-lidar scans took place Saturday, with more completed on Monday to assess whether additional movement of the slides had occurred. Monday’s scan showed little change; information that has been provided along with other data to the U.S. Army Corps of Engineers as they continue to address the issue.
“We were fortunately already mobilizing this fabulous 3-D imaging technology when our field crews learned of the need to monitor the stability of the Tangipahoa Dam,” said USGS Director Marcia McNutt. “I know of no other technology that could compete with T-lidar for providing both the precision and ease of deployment or that has the potential to determine whether a structure is in danger of failing when time is of the essence.”
Isaac is the first storm in which USGS has used its terrestrial lidar capabilities to map urban flooding.
“We brought our T-lidar capabilities into the area affected by Isaac as part of a pilot project to assess its use for mapping flood levels in urban areas, and to develop flood inundation maps that will help forecast future flood effects,” said Toby Minear, a research hydrologist at the USGS California Water Science Center, who completed the scans of the dam. “What we’ve found is that, not only can it help assess current flood levels and high-water marks, it has the potential to play a pivotal role in helping assess the health of structures threatened by floodwaters, providing critical information to those who need it in a matter of minutes.”
T-lidar allows scientists to quickly generate 3-D maps of buildings, dams, levees and other structures, and can show areas of storm damage as well. In a four-to-five minute scan, the instrument collects millions of topographic data points in a full 360-degree view to quickly produce highly accurate topographic information and can map areas up to two-thirds of a mile away.
Acoustic Doppler instruments, such as the one used to map the underwater portion of the slide at Tangipahoa Dam, are frequently used to measure stream or lake geometry and water velocity. An acoustic signal is bounced off the river or lake bottom and the amount of time required for the signal to return to the sensor provides a measurement of the distance to the bottom.
USGS crews also deployed storm surge sensors just below the dam, and at four bridge crossings downstream between the dam and the USGS’ real-time permanent streamgage on the Tangipahoa at Osyka. The sensors allowed the USGS to monitor river levels as actions were taken to release the pressure on the dam and reduce water levels.
At least one house was destroyed while another was damaged in Cebu City in the wake of a flash flood brought by heavy rain Saturday, the National Disaster Risk Reduction and Management Council reported Sunday. In a report on its website, the NDRRMC said the incident occurred Saturday afternoon in Sitio Lukana in Kalunasan village in Cebu City. The NDRRMC said the flash flood was due to the overflowing of the Guadalupe River. “One house was totally damaged while another was partially damaged. As of reporting time, no casualty was reported,” it said. It said the Bureau of Fire Protection, the village disaster risk reduction and management council, and the Philippine Red Cross responded to the incident.
……………………
08.09.2012
Tornado
USA
State of New York, New York City [Breezy Point, Queens]
Firefighters are assessing damage caused by a cyclone that struck a beachfront neighborhood in New York City. Videos taken by bystanders show a funnel cloud hurling sand and debris in the air as it moved through the Breezy Point section of the Rockaway peninsula in Queens on Saturday. A Fire Department spokesman says there were power lines down and possibly other damage. The general manager of the Breezy Point Surf Club tells The Associated Press the storm ripped up cabanas and even picked up industrial-sized metal trash bins. The National Weather Service issued a tornado warning for Queens and Brooklyn as the storm moved through the city. It expired at 11:30 a.m. The service says radar detected a “strong rotation” in the storm.
TEPCO submerged a video camera inside the butter tank that stores the treated water before the water is fed back into the reactors (Units 1, 2, and 3). The amount of water being fed to the reactors for cooling has been fluctuating significantly, and TEPCO hasn’t identified the cause yet.
There are white bits (particles) floating in the water. TEPCO explains the bubbling in the video as “nitrogen”.
For more on the problem of the reactor cooling system, read my post: http://bit.ly/PZTFC0
For continued coverage of Fukushima I Nuke Plant accident and radiation contamination in Japan, visit my blogs: http://www.exskf.com (English) http://www.exskf-jp.com (Japanese)
TEPCO still hasn’t identified the cause for the decreased water flow into the reactors (1, 2, and 3), but the company suspects some rust or foreign particles clogging the system somewhere. On September 5, a video camera was submerged into one of the buffer tanks that store the treated water before the water is fed back into the reactors.
White particles floating around, like near the bottom of the ocean. I wonder what they are. TEPCO explains the bubbling seen in the video as “nitrogen”.
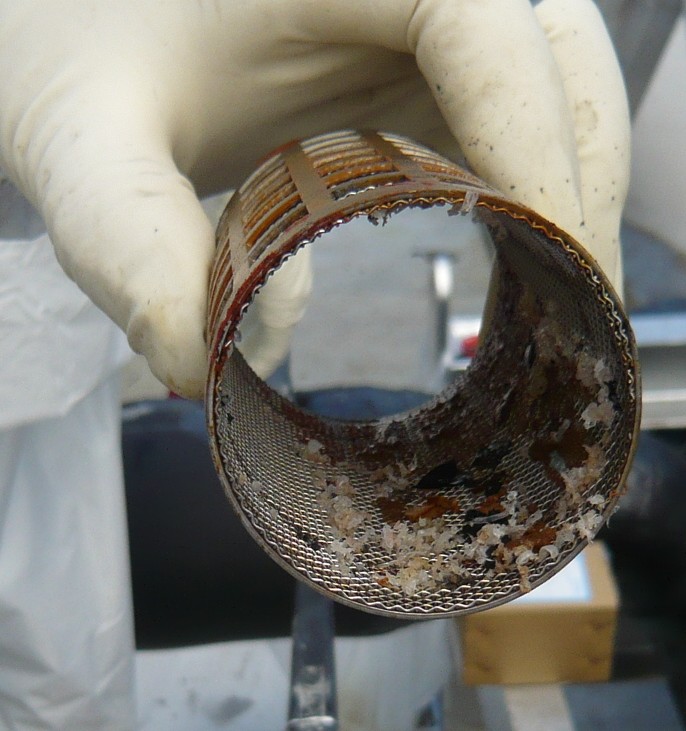
Here’s a photo of the strainer of one of the 5 “chiller” machines (to cool water), from TEPCO’s 9/5/2012 Photos and Videos page. Rust flakes and curled-up white bits. (It looks like bits of jellyfish…) Click to enlarge.
Mangoes are likely responsible for the ongoing Salmonella Braenderup outbreak and Cantaloupes are almost certainly the source of the recent Salmonella Typhimurium outbreak, but what roles do food and water play in spreading Hantavirus, swine flu and West Nile Virus?
None of the three are typically thought of as foodborne diseases, but that does not tell the
whole story.
Hantavirus
For example, the federal Centers For Disease Control and Prevention (CDC) in Atlanta reports that people can contract Hantavirus Pulmonary Syndrome if they eat food contaminated by urine, droppings or saliva from an infected rodent.
That might not happen at your house. Hantavirus infections typically occur in people who are camping, hunting or doing other outdoor activities. This year 10,000 people who visited Yosemite National Park have been warned about Hantavirus because they may have stayed in the park’s Curry Village an area containing permanent tent-like structures.
Three confirmed and one possible case of Hantavirus have been linked to that location.
CDC says many Hantavirus victims probably touch something contaminated with rodent urine, droppings, or saliva and then touch their own nose or mouth. Rodent bites would also do, but those are rare.
Airborne transmission is also likely from tiny droplets of urine, rodent droppings and nesting material get into the air.
Any number of rodents — from deer mice to cotton rats — can spread the virus. CDC has tracked Hantavirus in the U.S. since 1993, the year when attention was first focused on the virus after unexplained deaths began occurring in the Four Corners area of the American Southwest.
The exposure of Yosemite’s many park visitors to Hantavirus this year does not mean that anything extraordinary is going on. Through early July, only 15 new confirmed cases had been recorded since last year when the total count since 1993 stood at 587.
The mean age for a Hantavrirus victim from 1993 to 2011 was 37, with two out three being men from the Four Corners states of Utah, Arizona, Colorado and New Mexico. California and Texas had the most cases.
Swine Flu
More than 300 variant influenza viruses have now been recorded in the U.S. Most of these “swine flu” viruses have been found in Indiana and Ohio, which recently experienced the first deaths. The term “variant” means they are similar to viruses circulating in swine.
The current U.S. outbreak of swine flu involves the H3N2 Influenza A Variant Virus. In addition to the one death, 15 of the 288 people infected required hospitalization.
CDC reports that swine flu has not been shown to be transmissible to people through eating properly handled and prepared pork (pig meat) or other products derived from pork. Key to proper preparation is cooking pork to 145 °F throughout.
West Nile Virus (WNV)
About 30,000 Americans have suffered from West Nile Virus since 1999. Unless you count one case where a nursing mother with West Nile Virus gave it to her baby, WNV is not much of a foodborne disease.
But standing water is another story. Mosquitos do their breeding in standing water, bird baths or pets’ water bowls. Breeding areas mean more mosquitos and more WNV-carrying mosquito bites.
Dr. Lyle Petersen, CDC’s director of the division of vector-borne infectious diseases, says cases of West Nile Virus are on the rise.
“As of August 28th, 2012, a total of 48 states have reported West Nile virus infections in people, birds or mosquitoes. Only Alaska and Hawaii have reported no West Nile virus activity. Forty-three states have reported at least one human case of West Nile virus disease.”
CDC received reports of 1,590 cases of West Nile virus disease in people, including 66 deaths, Petersen told an Aug. 29 press briefing.
“Of these, 889 (56 percent) were classified as neuroinvasive disease, such as meningitis or encephalitis; and 701 (or 44 percent) were classified as non-neuroinvasive disease. These numbers represent a 40 percent increase over last week’s report of 1,118 total cases, 629 neuroinvasive disease cases, and 41 deaths.
“The 1,590 cases reported thus far in 2012, is the highest number of West Nile virus disease cases reported to the CDC through the last week in August since West Nile virus was first detected in the United States in 1999. More than 70 percent of the cases have been reported from 6 states, which in descending order are Texas, South Dakota, Mississippi, Oklahoma, Louisiana, and Michigan. Nearly half of the cases are from Texas.”
Warmer air temperatures since the 1980s may explain significant increases in zinc and other metal concentrations of ecological concern in a Rocky Mountain watershed, according to a new study published in the journal Environmental Science and Technology, led by the U.S. Geological Survey and the University of Colorado, Boulder.
Rising concentrations of zinc and other metals in the upper Snake River just west of the Continental Divide near Keystone, Colo., may be the result of falling water tables, melting permafrost, and accelerating mineral weathering rates, all driven by warmer air temperatures in the watershed. Researchers observed a fourfold increase in dissolved zinc over the last 30 years during the month of September.
“This study provides another fascinating, and troubling, example of a cascading impact from climate warming as the rate of temperature-dependent chemical reactions accelerate in the environment, leaching metals into streams,” said USGS Director Marcia McNutt. “The same concentration of metals in the mountains that drew prospectors to the Rockies more than a century ago are now the source of toxic trace elements that are harming the environment as the planet warms.”
Increases in metals were seen in other months as well, with lesser increases seen during the high-flow snowmelt period. During the study period, local mean annual and mean summer air temperatures increased at a rate of 0.2-1.2 degrees Celsius per decade.
Generally, high concentrations of dissolved metals in the upper Snake River watershed are the result of acid rock drainage, or ARD, formed by natural weathering of pyrite and other metal-rich sulfide minerals in the bedrock. Weathering of pyrite forms sulfuric acid through a series of chemical reactions, and mobilizes metals like zinc from minerals in the rock and carries these metals into streams.
Increased sulfate and calcium concentrations observed over the study period lend weight to the hypothesis that the increased zinc concentrations are due to acceleration of pyrite weathering. The potential for comparable increases in metals in similar Western watersheds is a concern because of impacts on water resources, fisheries and stream ecosystems. Trout populations in the lower Snake River, for example, appear to be limited by the metal concentrations in the water, said USGS scientist Andrew Todd, lead researcher on the project.
“Acid rock drainage is a significant water quality problem facing much of the Western United States,” Todd said. “It is now clear that we need to better understand the relationship between climate and ARD as we consider the management of these watersheds moving forward.”
In cases where ARD is linked directly with past and present mining activities it is called acid mine drainage, or AMD. Another Snake River tributary, Peru Creek, is largely devoid of life due to AMD generated from the abandoned Pennsylvania Mine and smaller mines upstream, and has become a target for potential remediation efforts.
The Colorado Division of Reclamation Mining and Safety, in conjunction with other local, state and federal partners, is conducting underground exploration work at the mine to investigate the sources of heavy metals-laden water draining from the adit. The study conducted by Todd and colleagues has implications in such efforts because it suggests that establishing attainable clean-up objectives could be difficult if natural background metal concentrations are a “moving target.”
Collaborators include USGS, CU Boulder and the Institute of Arctic and Alpine Research (INSTAAR). The data analyzed for the study came from INSTAAR, the USGS and the U.S. Environmental Protection Agency.
The strain appeared to be a mutation of the H5N1 virus which swept through the countryâs poultry flocks last year, forcing mass culls of birds in affected areas, according to agriculture officials. The new virus âis quickly spreading and this is the big concern of the governmentâ, Deputy Minister of Agriculture and Rural Development Diep Kinh Tan said. Experts cited in the report said the new virus appeared in July and had spread through Vietnamâs northern and central regions in August. Outbreaks have been detected in six provinces so far and some 180,000 birds have been culled, the Animal Health department said. The Central Veterinary Diagnosis Centre said the virus appeared similar to the standard strains of bird flu but was more toxic. The centre will test how much protection existing vaccines for humans offer, the report said. Some experts suggested that the new strain resulted from widespread smuggling of poultry from China into the northern parts of Vietnam. Two people have died this year from the virulent disease â but long before the new strain was identified. According to the World Health Organisation, Vietnam has recorded one of the highest numbers of fatalities from bird flu in southeast Asia, with at least 59 deaths since 2003. The avian influenza virus has killed more than 330 people around the world, and scientists fear it could mutate into a form readily transmissible between humans, with the potential to cause millions of deaths.
For a river known as the “golden watercourse,” red is a strange color to see. Yet that’s the shade turning up in the Yangtze River and officials have no idea why. The red began appearing in the Yangtze, the longest and largest river in China and the third longest river in the world, yesterday near the city of Chongquing, where the Yangtze connects to the Jialin River. The Yangtze, called “golden” because of the heavy rainfall it receives year-round, runs through Chongqing, Southwest China’s largest industrial and commercial center, also known as the “mountain city” because of the hills and peaks upon which its many buildings and factories stand. The red color stopped some residents in their tracks. They put water from the river in bottles to save it. Fishermen and other workers who rely on the river for income kept going about their business. While the river’s red coloring was most pronounced near Chongqing it was also reported at several other points. Officials are reportedly investigating the cause.
[In accordance with Title 17 U.S.C. Section 107, this material is distributed without profit, for research and/or educational purposes. This constitutes ‘FAIR USE’ of any such copyrighted material.]
The Hunger Site – Your click helps to feed the hungry
Wheatgrass Kits.com
FAIR USE NOTICE
The material on this site is provided for educational and informational purposes. It may contain copyrighted material the use of which has not always been specifically authorized by the copyright owner. It is being made available in an effort to advance the understanding of scientific, environmental, economic, social justice and human rights issues etc. It is believed that this constitutes a 'fair use' of any such copyrighted material as provided for in section 107 of the US Copyright Law. In accordance with Title 17 U.S.C. Section 107, the material on this site is distributed without profit to those who have an interest in using the included information for research and educational purposes. If you wish to use copyrighted material from this site for purposes of your own that go beyond 'fair use', you must obtain permission from the copyright owner. The information on this site does not constitute legal or technical advice.
Any materials (ie. graphics, articles , commentary) that are original to this blog are copyrighted and signed by it's creator. Said original material may be shared with attribution. Please respect the work that goes into these items and give the creator his/her credit. Just as we share articles , graphics and photos always giving credit to their creators when available. Credit and a link back to the original source is required.
If you have an issue with anything posted here or would prefer we not use it . Please contact me. Any items that are requested to be removed by the copyright owner will be removed immediately. No threats needed or lawsuit required. If there is a problem and you do not wish your work to be showcased then we will happily find an alternative from the many sources readily available from creators who would find it amenable to having their work presented to the subscribers of this feed.
Thank you for your time and attention, blessings to all :)

")
")


 Round 1: An underwater volcano erupts near Tonga in 2009 – perhaps a reminder of an extinction more than 65million years ago
 Thomas Tobin clears sand from around the fossil of a giant ammonite he found in 2009 on James Ross Island in Antarctica
")